Power-to-X Market Size and Share
Market Overview
| Study Period | 2020 - 2031 |
|---|---|
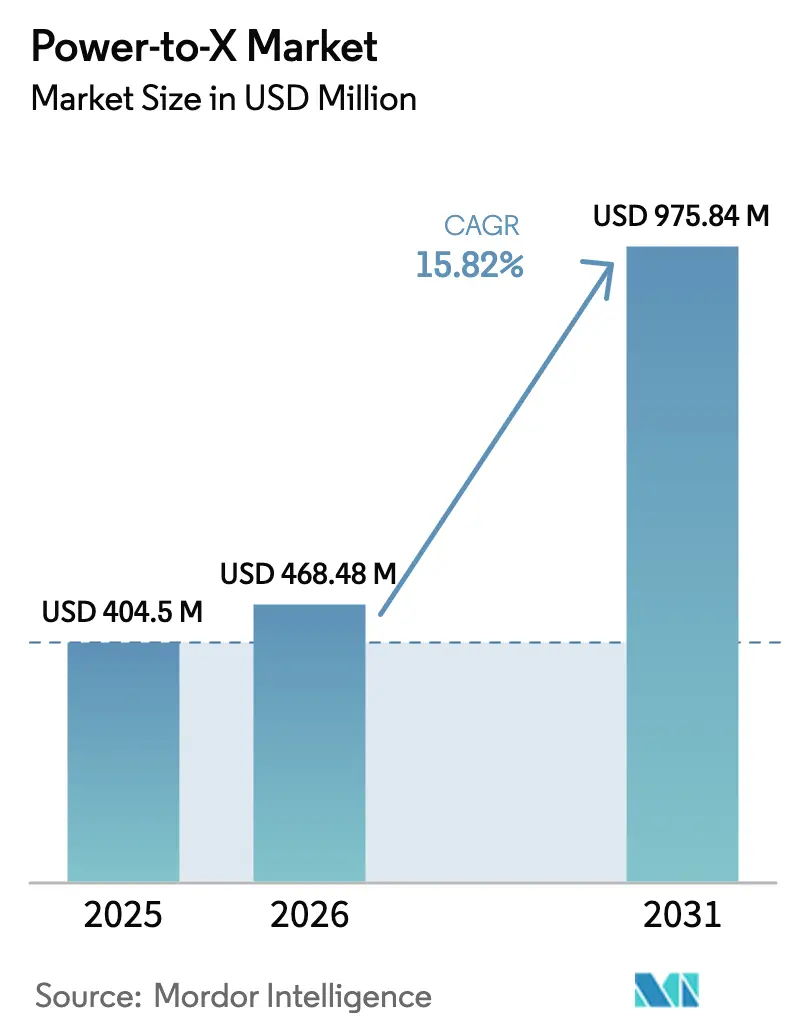
| Market Size (2026) | USD 468.48 Million |
| Market Size (2031) | USD 975.84 Million |
| Growth Rate (2026 - 2031) | 15.82% CAGR |
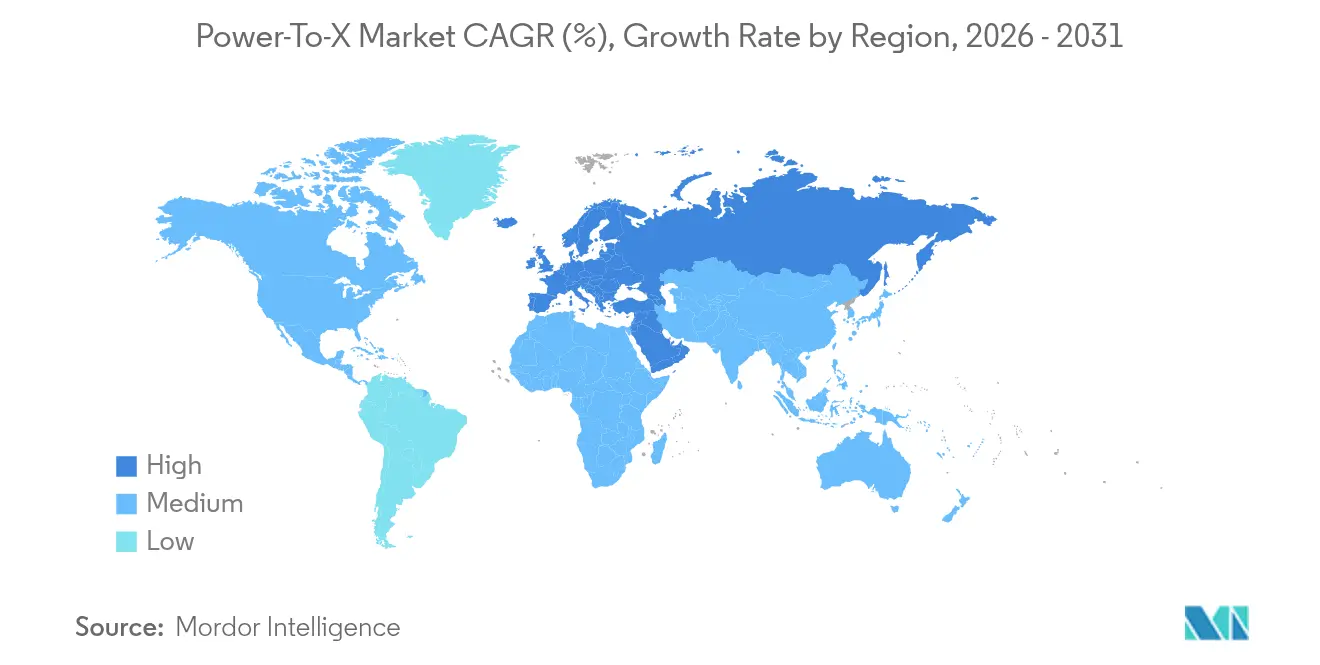
| Fastest Growing Market | Europe |
| Largest Market | Middle East |
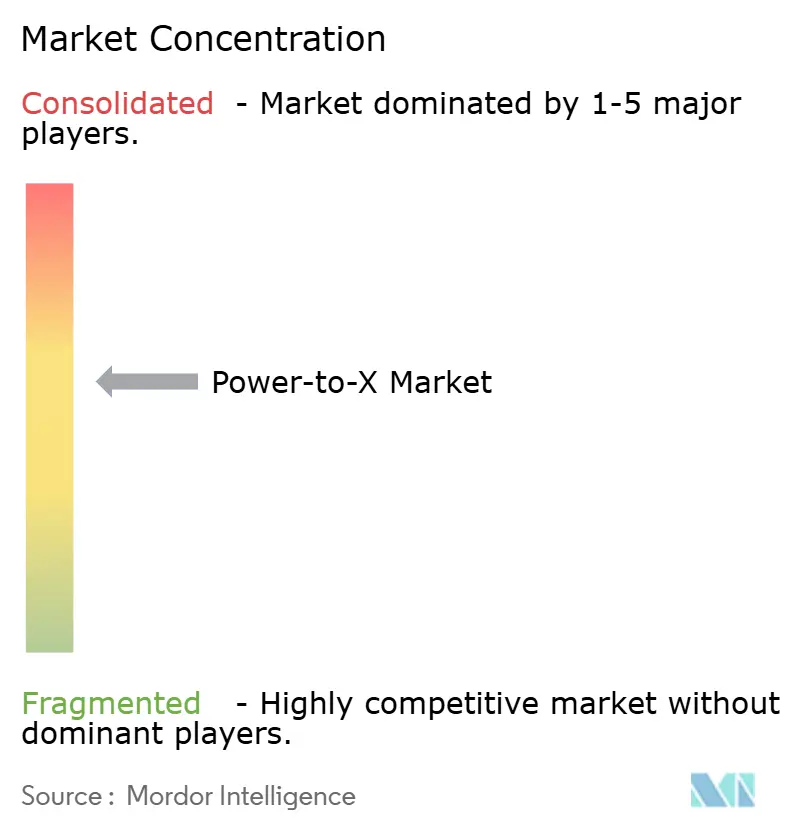
| Market Concentration | Medium |
Major Players
*Disclaimer: Major Players sorted in no particular order Image © Mordor Intelligence. Reuse requires attribution under CC BY 4.0. |
|
Power-to-X Market Analysis by Mordor Intelligence
The Power to X market size is expected to grow from USD 404.5 million in 2025 to USD 468.48 million in 2026 and is forecast to reach USD 975.84 million by 2031 at 15.82% CAGR over 2026-2031. Cost declines in electrolysers, stricter carbon-pricing regimes, and the aviation and maritime sectors’ widening offtake contracts keep demand for renewable hydrogen and e-fuels on a steep curve. Europe’s early-stage policy clarity and subsidy frameworks underpin near-term project flow, while the Middle East moves up the value chain from feedstock supplier to integrated exporter by coupling low-cost solar with large-scale desalination. Corporates facing the European Union’s Carbon Border Adjustment Mechanism are locking in long-dated e-fuel supply, bringing bankability to multi-gigawatt projects. Concurrently, learning-curve effects in China’s alkaline stack factories and the opening of European SOEC gigafactories are compressing capital costs and shortening the payback window. Yet grid-connection delays, cross-border pipeline permitting, and iridium and nickel supply tightness keep execution risk elevated.
Key Report Takeaways
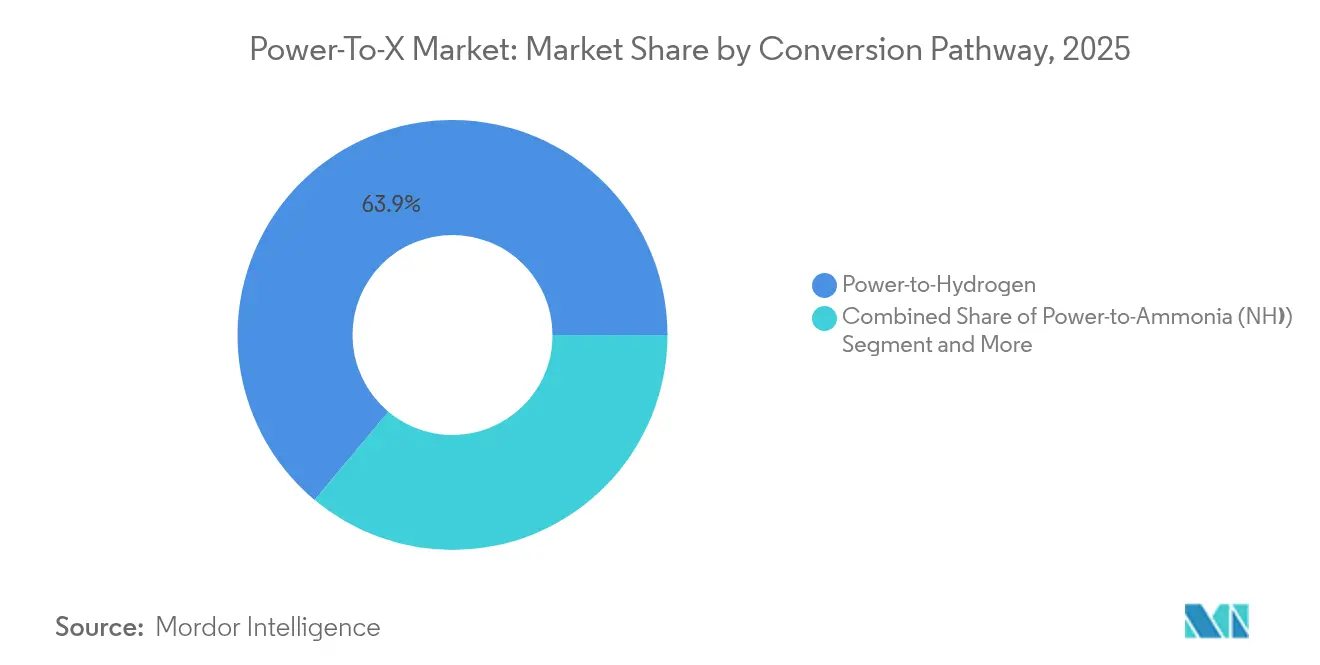
- By conversion pathway, power-to-hydrogen led with 63.92% of the Power to X market share in 2025, while power-to-synthetic aviation fuel is forecast to expand at a 41.12% CAGR through 2031.
- By end-use sector, transportation captured 39.08% revenue share of the Power to X market size in 2025; power generation and storage shows the fastest projected CAGR at 33.26% to 2031.
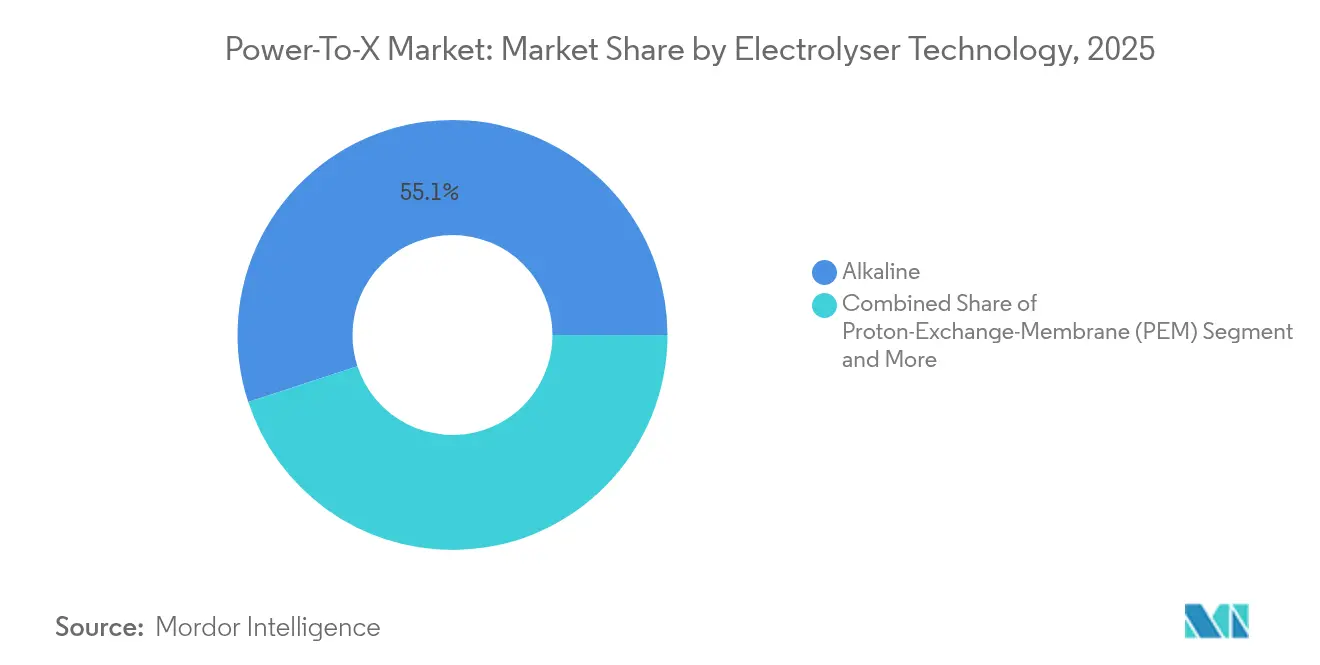
- By electrolyser technology, alkaline systems accounted for 55.05% of the Power to X market size in 2025, whereas solid oxide electrolysis cells are advancing at a 27.64% CAGR to 2031.
- By renewable power source, onshore wind supplied 41.22% of total input to the Power to X market in 2025; offshore wind is forecast to grow at 21.95% per year to 2031.
- By geography, Europe held 35.21% of the Power to X market in 2025, while the Middle East is set to post a 31.45% CAGR between 2026 and 2031.
Note: Market size and forecast figures in this report are generated using Mordor Intelligence’s proprietary estimation framework, updated with the latest available data and insights as of 2026.
Global Power-to-X Market Trends and Insights
Drivers Impact Analysis*
| Driver | (~) % Impact on CAGR Forecast | Geographic Relevance | Impact Timeline |
|---|---|---|---|
| Surge in gigawatt-scale green-hydrogen FIDs post-2025 | +4.2% | Global; Middle East and Europe concentration | Medium term (2-4 years) |
| EU Carbon Border Adjustment Mechanism boosting e-fuels | +3.8% | Europe and trading partners | Short term (≤ 2 years) |
| Alkaline and PEM electrolyser CAPEX falling < USD 300/kW by 2028 | +3.1% | Global | Medium term (2-4 years) |
| Maritime sector shift to green ammonia under IMO CII rules | +2.9% | Global shipping routes | Long term (≥ 4 years) |
| Long-duration storage mandates driving power-to-methane | +1.8% | North America and Europe | Long term (≥ 4 years) |
| Corporate e-SAF offtake contracts from aviation majors | +2.4% | Global; North America and Europe focus | Medium term (2-4 years) |
| Source: Mordor Intelligence | |||
Surge in Gigawatt-Scale Green-Hydrogen FIDs Post-2025
Final investment decisions for multi-gigawatt projects have accelerated since 2024, led by NEOM’s 2.2 gigawatt complex, which is 80% complete. Declining solar and wind levellised costs allow developers in Chile, Australia, and Mauritania to price hydrogen near USD 2/kg by 2030, narrowing the gap with grey hydrogen. China now hosts 60% of global stack output, supplying cost-competitive equipment that underpins project bankability. These headline projects create demand visibility for electrolyser supply chains and allow second-tier developers to unlock debt finance. Nonetheless, regional clustering in resource-rich deserts and coastal zones could widen logistics gaps, requiring long-distance hydrogen or ammonia transport capacity.
EU Carbon Border Adjustment Mechanism Boosting E-Fuels
The CBAM’s phased entry from 2026 forces steel, cement, and chemical exporters to decarbonize or face levies, converting e-fuels from voluntary spend to compliance cost. European Energy’s Kassø plant, producing 42,000 tons of e-methanol yearly, already sells volumes under multiyear contracts to shipping and plastics clients. Indirect-emission coverage widens the addressable market as electricity-intensive goods seek renewable molecules. As Brussels expands the mechanism to more product codes, similar schemes are tabled in Canada and Japan, pushing global suppliers toward the Power to X market to retain EU access.
Alkaline and PEM Electrolyser CAPEX Falling Below USD 300/kW by 2028
Competition between Chinese mass-manufacturers and new European gigafactories is driving factory utilization higher, lowering depreciation per unit. ANDRITZ’s new plant in Erfurt lifts regional capacity while Longi’s automated lines push alkaline stacks below USD 250/kW ex-works. At these levels, green hydrogen in regions with sub-USD 20/MWh renewables undercuts grey hydrogen delivered by pipeline. As projects internalize these cost curves, smaller distributed electrolysers appear in refineries and chemical parks, shrinking exposure to future carbon pricing.
Maritime Sector Shift to Green Ammonia Under IMO CII Rules
The IMO’s Carbon Intensity Indicator ratchets down permissible emissions annually, nudging bulk carriers and container lines toward ammonia because of its volumetric energy density and existing handling codes. Maersk, NYK, and MOL have signed multi-million-ton offtake letters with producers coming online after 2027. Ports in Rotterdam, Singapore, and Hamburg are building bunkering corridors, while class societies finalise dual-fuel engine standards. Crew-training and safety-case work add cost, yet certainty around regulation accelerates adoption.
Restraint Impact Analysis*
| Restraint | (~) % Impact on CAGR Forecast | Geographic Relevance | Impact Timeline |
|---|---|---|---|
| Scarcity of low-cost renewable power in industrial hubs | -2.8% | Asia-Pacific and European manufacturing belts | Medium term (2-4 years) |
| Slow permitting of cross-border H₂ and NH₃ infrastructure | -2.1% | Europe, North America, Asia-Pacific | Long term (≥ 4 years) |
| Iridium and nickel supply bottlenecks for electrolysers | -1.9% | Global | Short term (≤ 2 years) |
| Financial-close risk from volatile renewable-PPA prices | -1.6% | Liberalised power markets worldwide | Medium term (2-4 years) |
| Source: Mordor Intelligence | |||
Scarcity of Low-Cost Renewable Power in Industrial Hubs
Heavy industry sits around legacy fossil-fuel grids, yet the cheapest renewable resources lie hundreds of kilometres away. Ruhr Valley steelmakers and Chinese coastal chemical parks pay a premium for clean electricity, eroding green hydrogen economics. Parallel data-centre build-outs for AI workloads tighten supply further; Amazon secured 1,920 MW of nuclear capacity to shield its cloud operations. Unless transmission upgrades or remote-production import schemes mature, industrial offtakers may defer switching.
Slow Permitting of Cross-Border H₂ and NH₃ Infrastructure
Pipeline and terminal approvals stretch up to five years because hydrogen is neither treated as natural gas nor as a chemical under many statutes. Germany’s hydrogen core-grid plan shows progress, yet alignment across EU member states still lags[1]Clean Energy Wire team, “German Government Clears Core Hydrogen Grid,” cleanenergywire.org. In the United States, split jurisdiction between PHMSA, FERC, and state bodies clouds timelines for interstate lines. Early-stage export corridors, such as Oman-to-Rotterdam liquid hydrogen, require novel technical codes and bilateral treaties that prolong development cycles.
*Our forecasts treat driver/restraint impacts as directional, not additive. The impact forecasts reflect baseline growth, mix effects, and variable interactions.
Segment Analysis
By Conversion Pathway: Hydrogen Dominance Faces E-Fuel Competition
The Power to X market size for hydrogen conversion stood at USD 258.56 million in 2025, equal to 63.92% of total revenue. Established alkaline and PEM systems, broad industrial use-cases, and growing policy incentives anchor its lead. Synthetic aviation fuel, though accounting for a smaller base, is on a 41.12% CAGR path as airlines secure supply to meet SAF blending mandates. That trajectory mirrors long-haul carriers’ urgency because batteries remain unviable for wide-body fleets. Ammonia commands maritime offtake, while methanol gains traction through existing chemical logistics networks.
Hydrogen’s scale lowers electrolyser manufacturing cost, reinforcing its volume advantage, yet e-SAF’s premium pricing offers superior margins. Captive shipping lines accept the higher capital expense of ammonia storage tanks, balancing carbon-pricing exposure versus fuel-switch costs. Methane and methanol continue attracting investors looking for brownfield asset retrofits. The segmentation suggests a multipolar Power to X market where no single molecule addresses all use-cases, so developers tailor technology stack to locked-in offtake.


By End-Use Sector: Transportation Leads Amid Storage Surge
Transportation applications held 39.08% of 2025 revenue, reflecting bulk contracts from container liners and airlines positioned against forward carbon costs. The sector benefits from clear decarbonization timetables under ICAO’s CORSIA and IMO’s CII. Conversely, long-duration storage in grids is the fastest-growing end-use at 33.26% CAGR as curtailment issues mount in high wind-and-solar jurisdictions. Seasonal e-methane injection into gas networks cushions winter demand swings, particularly in Nordic markets.
Regulatory guidance sparks procurement transparency, letting financiers underwrite 10-year offtake linked to inflation-adjusted pricing. Industrial feedstock users still sign flexible volumetric contracts tied to natural-gas benchmarks, delaying stronger demand acceleration. Residential heating remains experimental pending distribution-grid upgrades. Overall, sector splits illustrate how time-bound policy instruments dictate pathway prioritisation across the Power to X market.
By Electrolyser Technology: Alkaline Leads While SOEC Gains Efficiency Edge
Alkaline stacks controlled 55.05% of 2025 shipments due to lower capex and easier supply of commodity catalysts. PEM occupies mid-range niches where fast ramp rates matter. Solid oxide electrolysis cells posted a 27.64% CAGR, moving from lab to factory output as Topsoe and Sunfire ramp European gigafactories. SOEC’s 90% electrical-to-hydrogen efficiency and waste-heat reuse make it compelling in steel and fertilizer complexes.
While alkaline capex slides below USD 250/kW, PEM retains flexibility to chase merchant power swings. Anion exchange designs remain nascent but promise precious-metal freedom. The technology mix implies coexistence: Alkaline will serve giant baseload export projects, PEM will balance renewable intermittency, and SOEC will pair with high-temperature industrial loops, collectively underpinning the diversified Power to X market.
By Renewable Power Source: Onshore Wind Dominance Challenged by Offshore Growth
Onshore wind provided 41.22% of renewable electrons in 2025, primarily in Europe, North America, and China. Turbine uprating and repowering cut levelized costs, strengthening its base. Offshore wind hits a 21.95% CAGR because integrated hydrogen-at-sea concepts bypass congested grids; projects at Hollandse Kust Noord combine 2.5 MW of electrolysis capacity per turbine. Solar PV dominates Middle Eastern schemes, where capacity factors exceed 28% and land-lease rates remain low.
Hydropower’s predictable output delivers 8 000-hour utilization for South American SOEC clusters, improving unit economics. Resource matching shapes localization: desert solar plus desalination feeds ammonia in NEOM, while Baltic offshore wind creates pipeline-fed hydrogen for German steelworks. Such resource-driven clusters foster regional specialization inside the broader Power to X market.
Geography Analysis
Europe overtook North America in cumulative installed electrolysis capacity in 2025, reaching 3.9 GW. Germany funnels EUR 94 million from the Innovation Fund into Topsoe’s Herning plant to ensure stack security. However, renewable build-out lags industrial decarbonization timetables, so the EU eyes import corridors from Morocco and Oman. These supply chains may shift intra-regional trade balances as northern ports evolve into ammonia crackers while southern Europe channels molecules into hard-to-electrify industries.
The Middle East hosts projects exceeding 45 GW in combined solar and wind pipelines dedicated to hydrogen. Saudi Arabia and the UAE allocate sovereign funds to diversify export revenue, while Oman offers long-term land leases for green hydrogen clusters. Water-use constraints are mitigated via large-scale reverse-osmosis, adding under USD 0.40/kg to final hydrogen cost. Political stability, robust EPC ecosystems, and shipping proximity to Rotterdam and Singapore accelerate first-wave financial closures.
Asia-Pacific segmentation reveals China holding a 65% share of global electrolyser manufacturing, supplying both domestic installations and abroad. Japan and South Korea use government-backed procurement schemes to guarantee offtake, reducing counterparty risk for Australian and Malaysian producers. Australia’s Pilbara projects seek to sell into North Asian refineries through liquid-ammonia carriers, although shipping distance inflates delivered cost. India’s new hydrogen policy ties renewable auctions to domestic stack manufacturing quotas, signaling intent to capture higher value-add within the Power to X market.

Competitive Landscape
The Power to X market counts more than 120 active developers, yet the top ten hold only 42% of announced capacity, showing moderate fragmentation. Industrial-gas majors such as Air Liquide and Linde integrate upstream renewables to protect their merchant-hydrogen franchise. Turbine specialists Ørsted and Iberdrola co-develop offshore wind–to–hydrogen hybrids to monetise excess generation. Electrolyser OEMs pursue scale: Longi targets 10 GW/year alkaline output, while thyssenkrupp nucera partners with Fraunhofer IKTS to produce SOEC stacks in Germany.
Strategic moves underscore vertical integration. TotalEnergies bought 50% of RWE’s OranjeWind project to secure feedstock for its Zeeland refinery. Centrica and Equinor signed a GBP 20 billion gas-supply-plus-hydrogen transition deal to hedge European supply volatility. Emerging disruptors like Synhelion commission solar-thermochemical e-fuel pilots, tapping niche high-temperature pathways that sidestep electrolysis.
Patent landscapes concentrate around SOEC electrolyte chemistry and balance-of-plant design, with European entities filing 62% of new applications in 2024. Chinese manufacturers instead focus on process integration and automation IP to drive cost down. The competitive chessboard points to co-opetition: EPC wins often mix technology from multiple vendors to derisk schedules, keeping market entry points open for specialists and conglomerates alike.
Power-to-X Industry Leaders
-
Air Liquide S.A.
-
Linde plc
-
Siemens Energy AG
-
ThyssenKrupp AG
-
Engie S.A.
- *Disclaimer: Major Players sorted in no particular order

Recent Industry Developments
- June 2025: ANDRITZ opened an electrolyser gigafactory in Erfurt, Germany.
- June 2025: Centrica and Equinor agreed on a USD 27.17 billion supply deal transitioning from gas to hydrogen.
- May 2025: Thyssenkrupp Nucera and Fraunhofer IKTS inaugurated the first SOEC pilot stack plant.
- May 2025: European Energy launched the 42 000 t/y Kassø e-methanol facility.


Research Methodology Framework and Report Scope
Market Definitions and Key Coverage
Mordor Intelligence defines the Power-to-X market as the yearly revenue earned from commercial facilities that transform renewable electricity sourced solely from wind, solar, hydro, or similar clean assets into hydrogen, e-fuels, or other synthetic chemicals through electrolysis and downstream synthesis pathways. Conversion equipment, balance of plant, and the value of the produced energy carrier are all counted; grid-connected fossil-powered or CCS retrofit schemes are not.
Scope Exclusions: Small pilot plants below 1 MW and any projects powered by non-renewable electricity are outside this study.
Segmentation Overview
-
By Conversion Pathway
- Power-to-Hydrogen
- Power-to-Ammonia
- Power-to-Methane
- Power-to-Methanol
- Power-to-Synthetic Aviation Fuel
- Other Pathways
-
By End-use Sector
- Transportation
- Power Generation and Storage
- Industrial Feedstock and Process Heat
- Residential and Commercial Heating
- Agriculture
- Other Sectors
-
By Electrolyser Technology (Installed Capacity)
- Alkaline
- Proton-Exchange-Membrane (PEM)
- Solid Oxide (SOEC)
- Anion-Exchange-Membrane (AEM) and Others
-
By Renewable Power Source
- Onshore Wind
- Offshore Wind
- Utility-scale Solar PV
- Hydropower and Other Renewables
-
By Geography
-
North America
- United States
- Canada
- Mexico
-
South America
- Brazil
- Argentina
- Rest of South America
-
Europe
- United Kingdom
- Germany
- France
- Italy
- Spain
- Nordics
- Rest of Europe
-
Middle East and Africa
-
Middle East
- Saudi Arabia
- United Arab Emirates
- Turkey
- Rest of Middle East
-
Africa
- South Africa
- Egypt
- Nigeria
- Rest of Africa
-
Middle East
-
Asia-Pacific
- China
- India
- Japan
- South Korea
- ASEAN
- Australia
- New Zealand
- Rest of Asia-Pacific
-
North America
Detailed Research Methodology and Data Validation
Primary Research
Mordor analysts conducted structured discussions with electrolyzer OEM engineers, renewable project financiers, shipping fuel buyers, and aviation sustainability officers across Europe, North America, the Middle East, and Asia Pacific. These exchanges validated price trajectories, realistic capacity factors, and commissioning lead times, filling gaps that literature alone could not close.
Desk Research
Our desk work pulls consistently from open, high-integrity sources such as the IEA's monthly renewable additions database, Eurostat import-export files for hydrogen derivatives, U.S. EIA plant-level generation data, and policy trackers issued by the International Renewable Energy Agency. Trade groups like the Hydrogen Council and eFuel Alliance supply demand signals, while company 10-K filings, IPO prospectuses, and port authority statistics clarify cost curves and offtake volumes. Paid assets that Mordor analysts access, D&B Hoovers for corporate spend trends, Questel for patent velocity, and Dow Jones Factiva for deal flow round out the fact base. The examples above are illustrative; many other reputable datasets were tapped for cross-checks and context.
Market-Sizing & Forecasting
A top-down build begins with renewable generation capacity earmarked for PtX, multiplies it by modeled capacity factors and conversion yields, then prices output using region-specific power purchase and e-fuel contract rates. Sample bottom-up roll-ups of announced plants (MW × average selling price) act as a reasonableness check before values are aligned. Key drivers in the model include electrolyzer capital cost trends, renewable PPA prices, carbon price escalation, pipeline project FID rates, and regional hydrogen hub incentives. Forecasts to 2030 rely on multivariate regression blended with scenario analysis to reflect policy and metal supply sensitivities; assumptions were stress tested in interviews and adjusted where divergence exceeded the tolerance band.
Data Validation & Update Cycle
Estimates pass three levels of review: automated variance screening, peer analyst audit, and senior sign-off. Outputs are benchmarked against import duties, shipping rates, and observed e-fuel spot trades. The report refreshes annually, with interim updates whenever material policy or technology cost shocks emerge.
Why Our Power-to-X Baseline Commands Reliability
Market figures from different publishers often diverge because each picks its own conversion scope, currency year, and technology inclusion.
By anchoring values to verified renewable input only, updating cost curves quarterly, and capturing off-balance-sheet project finance, Mordor Intelligence offers a balanced midpoint that decision-makers can trace back to public variables.
Benchmark comparison
| Market Size | Anonymized source | Primary gap driver |
|---|---|---|
| USD 404.5 M (2025) | Mordor Intelligence | - |
| USD 703.2 M (2024) | Global Consultancy A | Includes fossil-powered PtX hybrids and counts pre-FID proposals as revenue |
| USD 380.0 M (2025) | Industry Research Firm B | Excludes synthetic aviation fuel stream, understating high-value demand |
| USD 315.2 M (2023) | Trade Journal C | Uses static electrolyzer CAPEX and omits currency inflation adjustments |
Taken together, the comparison shows that when scope inflation or outdated cost baselines are removed, our carefully moderated estimate provides the most transparent, reproducible starting point for strategic planning.


Key Questions Answered in the Report
What is driving the rapid growth of the Power to X market?
Cost declines in electrolysers, strict carbon-pricing mechanisms such as the EU CBAM, and firm offtake contracts from aviation and maritime sectors are propelling a 15.82% CAGR through 2031.
How large is the Power to X market today?
The Power to X market size reached USD 468.48 million in 2026 and is projected to hit USD 975.84 million by 2031.
Which conversion pathway dominates current revenues?
Power-to-hydrogen leads with 63.92% of 2025 revenue, supported by broad industrial and mobility applications.
Where is the fastest regional expansion expected?
The Middle East shows the highest forecast CAGR at 31.45% as it builds solar-based export hubs for ammonia and hydrogen.
How low can electrolyser costs realistically fall?
Industry roadmaps and factory announcements point to alkaline and PEM capex sliding below USD 300/kW by 2028, enabling cost-competitive green hydrogen in low-cost renewable regions.
What risks could slow market deployment?
Delayed permitting for hydrogen pipelines and terminals, scarce low-cost renewables near industrial centres, and critical-metal supply constraints could shave up to 2.8 percentage points off forecast CAGR.
Page last updated on:


