Utility Poles Market Size and Share
Market Overview
| Study Period | 2020 - 2031 |
|---|---|
| Market Size (2026) | USD 60.59 Billion |
| Market Size (2031) | USD 256.03 Billion |
| Growth Rate (2026 - 2031) | 33.41% CAGR |
| Fastest Growing Market | Middle East |
| Largest Market | Asia Pacific |
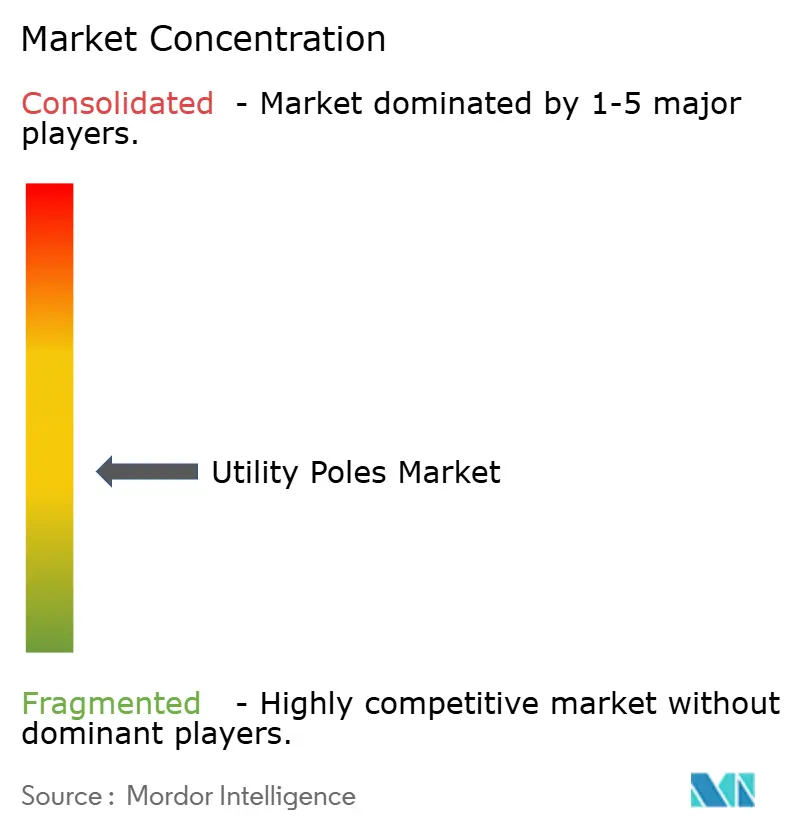
| Market Concentration | Medium |
Major Players*Disclaimer: Major Players sorted in no particular order Image © Mordor Intelligence. Reuse requires attribution under CC BY 4.0. | |
Utility Poles Market Analysis by Mordor Intelligence
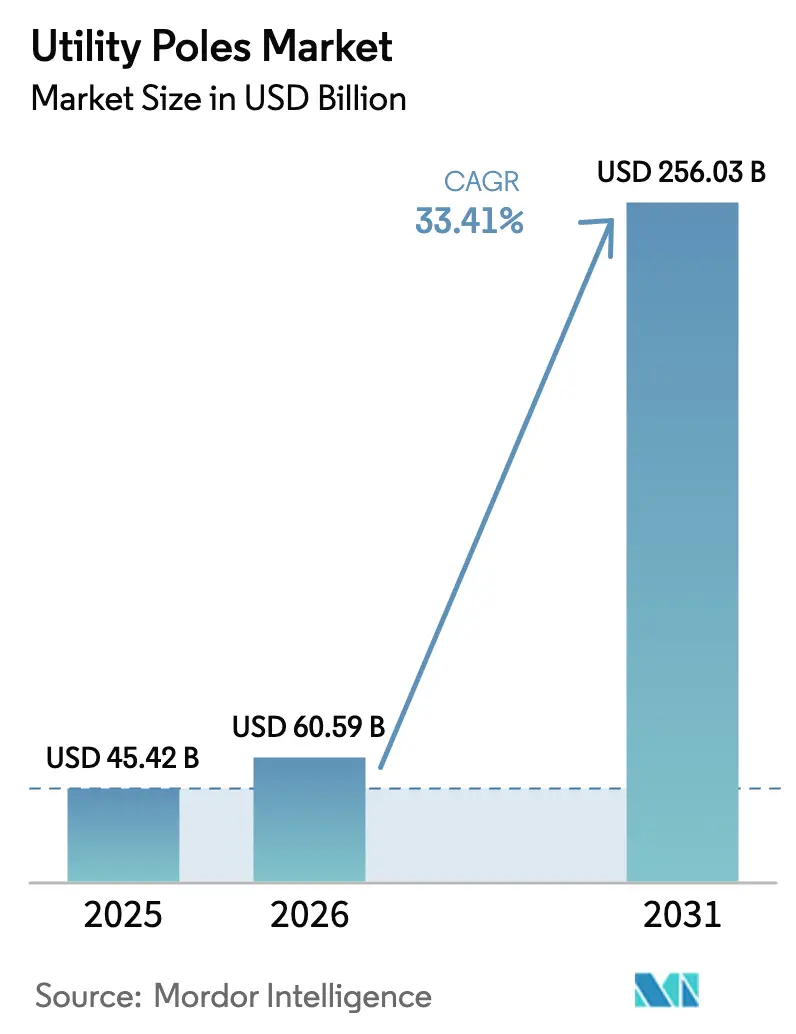
The utility poles market size was valued at USD 45.42 billion in 2025 and estimated to grow from USD 60.59 billion in 2026 to reach USD 256.03 billion by 2031, at a CAGR of 33.41% during the forecast period (2026-2031). Rising grid-modernization programs, accelerated renewable-energy interconnections, and densifying 5G roll-outs are expanding the utility poles market across all major material classes. Massive capital spending—such as China’s more than 600 billion-yuan grid budget for 2024—keeps order books full while Europe’s EUR 584 billion electricity-infrastructure plan underpins long-term demand. Telecommunications joint-use leasing, rural electrification schemes in Sub-Saharan Africa, and lifecycle-cost advantages of composite poles further reinforce the growth outlook for the utility poles market. Competition intensifies through acquisitions that add production scale, vertical integration, and smart-pole technologies, but supply-chain risks for Southern Yellow Pine and localized undergrounding mandates create pockets of volatility.
Key Report Takeaways
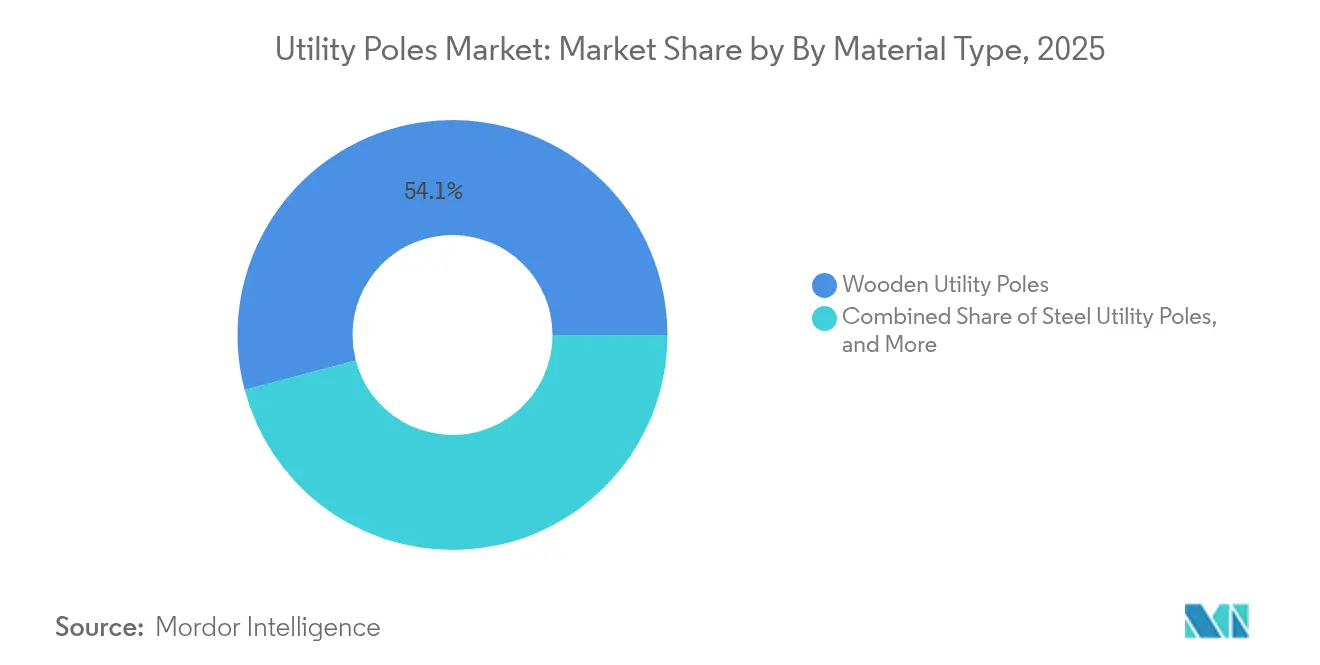
- By material type, wood poles led with 54.12% revenue share in 2025; fiber-reinforced polymer poles post the fastest 7.55% CAGR through 2031.
- By product, distribution poles held 66.90% of the utility poles market share in 2025, while smart poles grew at 10.05% CAGR to 2031.
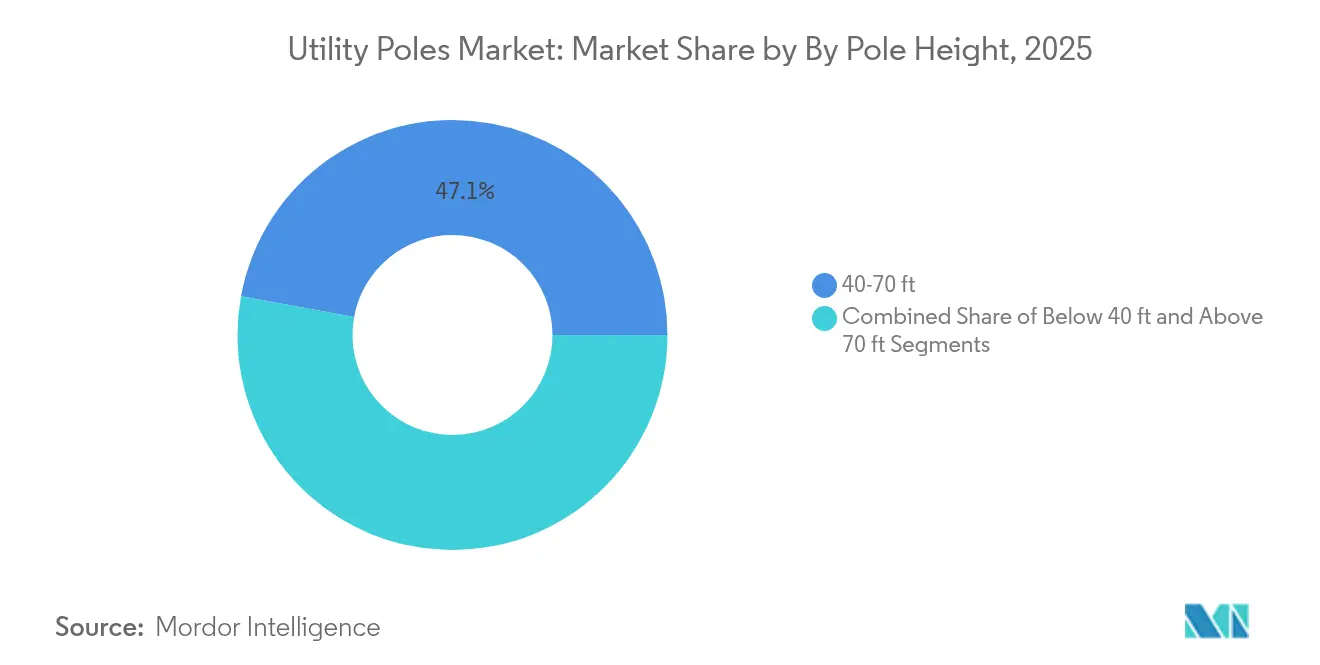
- By pole height, the 40-70 ft category accounted for 47.12% of the utility poles market size in 2025; poles above 70 ft rise at an 8.45% CAGR.
- By end user, transmission and distribution utilities contributed 65.05% revenue in 2025; telecommunications operators expanded at 9.25% CAGR.
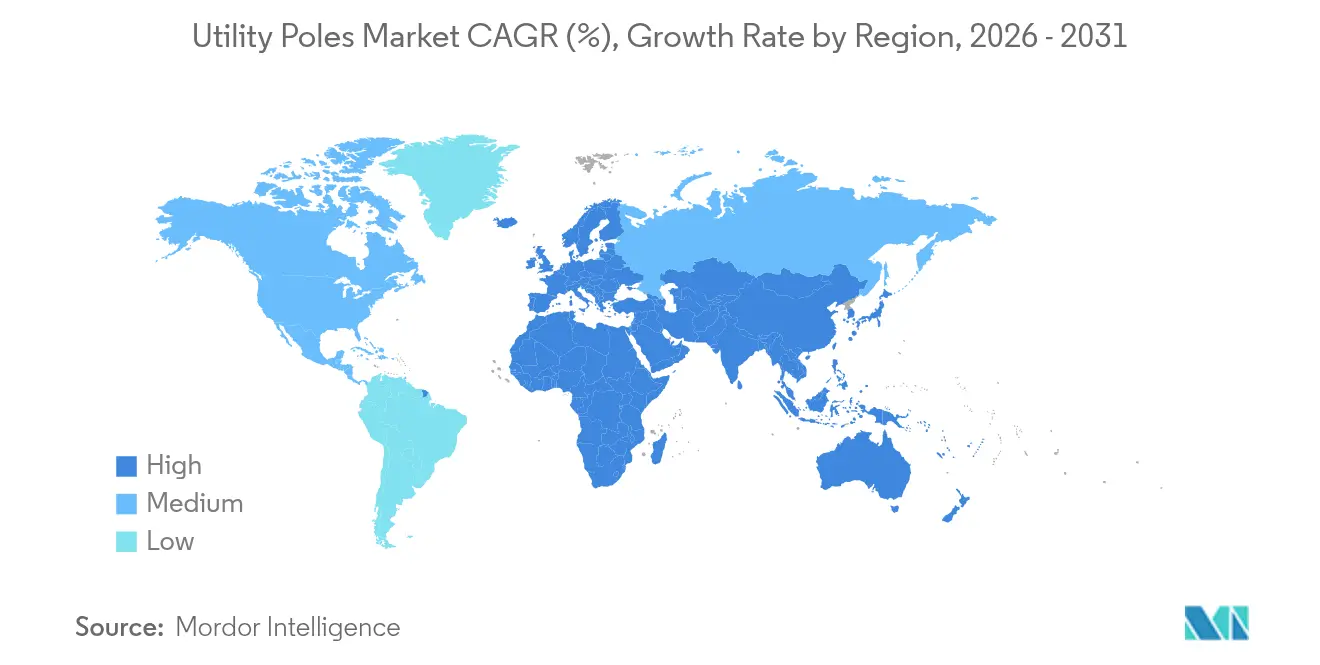
- Asia-Pacific commanded 38.20% share of the utility poles market in 2025; the Middle East and Africa are projected to advance at 6.22% CAGR.
Note: Market size and forecast figures in this report are generated using Mordor Intelligence’s proprietary estimation framework, updated with the latest available data and insights as of 2026.
Global Utility Poles Market Trends and Insights
Drivers Impact Analysis*
| Driver | (~) % Impact on CAGR Forecast | Geographic Relevance | Impact Timeline |
|---|---|---|---|
| Growing grid hardening and storm resilience programs | +8.2% | North America, Europe, and the Asia-Pacific coastal regions | Medium term (2-4 years) |
| Accelerated rural electrification in Sub-Saharan Africa and ASEAN | +6.8% | Sub-Saharan Africa, ASEAN core markets | Long term (≥4 years) |
| 5G densification driving joint-use pole leases | +7.1% | Global urban centers | Short term (≤2 years) |
| Lifecycle-cost advantage of hybrid FRP-steel poles | +4.3% | Global, early adoption in developed markets | Medium term (2-4 years) |
| Federal tax incentives for renewable interconnections | +5.8% | North America, Europe | Short term (≤2 years) |
| Edge-AI pole sensors enabling predictive maintenance | +2.9% | Global, led by developed markets | Long term (≥4 years) |
| Source: Mordor Intelligence | |||
Growing grid hardening and storm resilience programs
Major United States utilities committed more than USD 5 billion for pole replacements and system hardening after Hurricane Beryl, while the U.S. Department of Energy disbursed USD 2.3 billion in resilience grants in 2024[2]U.S. Department of Energy, “Grid Resilience State and Tribal Formula Grants,” energy.gov. Comparable programs in France allocate over EUR 5 billion annually through 2032. These investments lift annual tender volumes for composite and steel poles that withstand high wind loads and require minimal maintenance. The utility poles market therefore benefits from accelerated replacement cycles, higher average selling prices, and rising demand for smart-grid-ready structures. Suppliers able to certify poles for hurricane, ice, and fire zones secure priority positions in multi-year framework contracts.
5G densification driving joint-use pole leases
Small-cell operators cut deployment costs by 42% when attaching radios to existing wood poles rather than erecting standalone steel structures. In the United Kingdom, Virgin Media O2 pilots smart poles that combine mobile coverage, environmental sensing, and lighting. The regulatory easing by the U.S. Federal Communications Commission allows faster attachment approvals, turning poles into multi-use revenue generators and stimulating upgrades to higher-capacity designs. The utility poles market experiences a structural uplift as telecom leases diversify income streams for pole owners and justify investments in taller, stronger poles pre-engineered for radio loads.
Accelerated rural electrification in Sub-Saharan Africa and ASEAN
The African Development Bank’s Mission 300 targets 300 million new electricity connections by 2030. Nigeria already connected 50,000 households through solar mini-grids that rely on low-cost wood poles. ASEAN members need USD 210 billion of annual infrastructure spending, and Japan’s Partnership for Quality Infrastructure earmarks USD 110 billion to support those projects. These programs emphasize low-cost distribution networks that favor wood and concrete poles yet open niches for corrosion-resistant composites in coastal zones. Volume requirements in emerging regions underpin stable growth for the utility poles market even where margins remain thin.
Lifecycle-cost advantage of hybrid FRP-steel poles
Composite poles last 50-80 years versus 25-40 years for treated wood, lowering total cost of ownership in corrosive or fire-prone environments. Utilities implement asset-management models that price projects over life cycles, tilting specifications toward FRP and hybrid poles despite higher purchase prices. As manufacturing scale rises, composite premiums narrow, encouraging adoption in urban and industrial corridors. The trend supports differentiated pricing and margin expansion for suppliers of advanced composites within the utility poles market.
Restraint Impact Analysis*
| Restraint | (~) % Impact on CAGR Forecast | Geographic Relevance | Impact Timeline |
|---|---|---|---|
| Undergrounding mandates in wildfire-prone regions | -4.7% | California, Australia, Mediterranean Europe | Medium term (2-4 years) |
| Escalating timber certification and traceability costs | -3.2% | Global, concentrated in OECD markets | Short term (≤2 years) |
| VOC/creosote restrictions tightening in OECD markets | -2.8% | North America, Europe, developed APAC | Medium term (2-4 years) |
| Supply crunch of Southern Yellow Pine logs | -2.1% | North America, global wood-pole markets | Short term (≤2 years) |
| Source: Mordor Intelligence | |||
Undergrounding mandates in wildfire-prone regions
California utilities plan to bury 3,100 miles of distribution lines by 2032 under Senate Bill 884. Conversion costs exceed USD 3 million per mile, displacing short-term demand for overhead poles yet raising long-term need for premium fire-resistant structures where overhead remains permissible. Australian state regulators and Mediterranean European agencies study similar mandates, signaling regional demand compression that producers must offset through geographic diversification and product mix shifts toward fire-rated composites.
Escalating timber certification and traceability costs
Phase-outs of pentachlorophenol and stricter Forest Stewardship Council audits add 8-15% to raw-wood input costs. Compliance spending squeezes smaller sawmills, consolidating wood-pole supply around large integrated players with certified forests. Higher costs narrow wood’s price advantage, accelerating substitution by steel and composite poles and altering competitive positioning within the utility poles market.
*Our forecasts treat driver/restraint impacts as directional, not additive. The impact forecasts reflect baseline growth, mix effects, and variable interactions.
Segment Analysis
By Material Type: Wood Leadership Meets Composite Momentum
Wood poles generated 54.12% of 2025 revenue, underscoring entrenched supply chains and installer familiarity. Yet steel addresses heavy-load corridors while concrete suits regions with limited timber. Fiber-reinforced polymer, the fastest-expanding material at 7.55% CAGR to 2031, wins share where corrosion, fire risk, or sustainability targets dominate project criteria. Utilities in coastal United States funded pilot programs that placed 1,200 iron and composite poles worth USD 3.5 million in challenging wetlands. Total-cost-of-ownership evaluations tilt procurement toward long-life hybrids, positioning composites to capture premium segments of the utility poles market.
Wood suppliers face rising certification expenses and regulatory scrutiny. Ongoing pentachlorophenol withdrawal pushes producers toward nascent borate-based treatments that extend lead times and boost costs. Steel makers target tall transmission structures, especially in China’s UHV corridors, while concrete plays a cost-driven role in Latin America. Composite vendors invest in recyclability and automated pultrusion lines, narrowing price gaps. Diversifying away from a single material class therefore remains a strategic imperative across the utility poles market.


By Product: Distribution Demand Dominates, Smart Poles Accelerate
Distribution poles represented 66.90% of 2025 shipments, reflecting ubiquitous low-voltage networks worldwide. Transmission poles carry fewer units yet higher invoice values because of reinforcement, galvanizing, and greater heights. Street-lighting and high-mast poles serve urban and industrial projects, while monopoles satisfy telecom and constrained-right-of-way jobs. Smart poles expand at 10.05% CAGR, integrating 5G radios, IoT sensors, EV charging, and adaptive lighting in a single platform. Seoul’s S-Pole program illustrates multifunction deployment, bundling air-quality monitoring and emergency call boxes in standard poles.
The utility poles market size for smart poles is projected to grow significantly as cities monetize Wi-Fi offload, environmental analytics, and digital advertising. Manufacturers enter partnerships with telecom carriers to pre-wire poles for small-cell power supplies. Governments that demand infrastructure convergence for streetscape aesthetics further accelerate adoption. Meanwhile, traditional distribution poles continue to underpin volume, especially in emerging economies embarking on rural electrification drives.
By Pole Height: Mid-Range Rules, Tall Segments Rise
Poles between 40 ft and 70 ft held 47.12% revenue in 2025, aligning with predominant distribution clearances. Heights below 40 ft fit street lighting and suburban broadband drops, whereas poles above 70 ft exhibit an 8.45% CAGR to 2031 on the back of renewable-energy transmission projects. China’s State Grid plans more than 30,000 km of UHV lines requiring specialized towers and high-strength poles. Similar tall-pole demand emerges in North American wind belts, where long spans reduce foundation counts.
Steel and hybrid composite poles thrive in the tall segment because of their strength and corrosion resistance. Taller structures also lower right-of-way widths per megawatt transferred, improving permit success rates. As utilities interconnect remote renewable assets, tall-pole engineering prowess becomes a core differentiator within the utility poles market.
By End User: Utilities Lead, Telecom Grows Fast
Transmission and distribution utilities created 65.05% of 2025 demand, endorsing the utility poles market’s traditional base. Street-lighting authorities maintain predictable replacement cycles, while rail corridors use specialty catenary poles. Telecommunications operators deliver the fastest 9.25% CAGR because 5G densification leverages joint-use permits. DigitalBridge’s USD 4.25 billion Zayo deal to acquire Crown Castle’s fiber business underscores cross-sector infrastructure convergence.
Small-cell deployments need pole top adaptations, heavier arm attachments, and reinforced footing designs. These requirements shift procurement toward upgraded steel or composite alternatives, elevating average pole prices. Utilities that extract lease revenues for antenna placements improve return on invested capital and favor smart-pole orders that come pre-equipped with power metering and fiber pull-through conduits.
Geography Analysis
Asia-Pacific dominated with 38.20% revenue in 2025, led by China’s multi-year spending plan exceeding 600 billion yuan and India’s rural electrification push. Japan’s infrastructure partnership commits USD 110 billion to the region, supporting ASEAN pole orders in both wood and concrete. Coastal corrosion issues motivate early adoption of composites, especially in typhoon-exposed eastern China. Fast urbanization adds telecom-ready smart poles to city-center streetscapes, broadening the product mix across the utility poles market.
The Middle East and Africa post the highest 6.22% CAGR through 2031. The African Development Bank’s Mission 300 aspires to connect 300 million people, driving distribution-pole volumes. Gulf states invest in grid reliability to integrate solar and hydrogen projects, demanding galvanized steel and hybrid composites that withstand sand and heat. Nigeria’s mini-grid rollouts and Kenya’s electrified railway projects each draw on tailored pole solutions to balance cost, durability, and theft resistance.
North America and Europe remain steady yet innovation intensive. The U.S. Inflation Reduction Act incentivizes renewable ties, spurring orders for high-clearance transmission poles. Europe’s EUR 584 billion network investment through 2030 focuses on digital substations and climate resilience. Wildfire undergrounding mandates curb Western U.S. volumes but raise demand for fire-rated composite poles in remaining overhead corridors. Tightening preservative rules push utilities to test borate and copper-napthenate treatments, while composite alternatives attract total-cost analysis in both regions.

Competitive Landscape
Competition is moderately fragmented, with the top five producers controlling near-40% of global revenue. Valmont Industries raised its quarterly dividend 13% after posting USD 969.3 million Q1 2025 net sales. Stella-Jones leverages vertically integrated timber sourcing, and Koppers Holdings scales creosote substitutes to preserve share. Arcosa acquired Ameron Pole Products for USD 180 million to broaden steel-pole capacity. Macquarie Asset Management took a controlling stake in DynaGrid to expand manufacturing throughput.
Innovation shapes differentiation. Signify markets lighting-plus-5G smart-pole suites, while Creative Pultrusions and Strongwell invest in recyclable FRP matrices that meet circular-economy mandates. Regional players such as Nippon Concrete Industries supply seismic-resistant precast poles in Japan. Partnerships between pole vendors and analytics firms—Osmose and Neara joined forces in June 2025—offer digital twins and predictive maintenance that raise switching costs for utility customers.
Market entrants face high certification hurdles, especially for fire zones and high-voltage corridors. Integrated manufacturers with pressure-treating, galvanizing, and pultrusion lines capture scale economies and cross-sell into converging telecom sectors. Smart-pole platforms open new revenue pools but invite competition from telecom-equipment vendors and IT integrators, intensifying technology alliances in the utility poles market.
Utility Poles Industry Leaders
Valmont Industries Inc.
RS Technologies Inc.
Skipper Limited
Koppers Inc.
Stella-Jones Inc.
- *Disclaimer: Major Players sorted in no particular order

Recent Industry Developments
- June 2025: Osmose and Neara unveiled a partnership to merge pole inspection data with 3-D grid models, advancing predictive maintenance.
- March 2025: FirstEnergy completed a USD 26 billion grid-modernization program, adding 15 new poles and replacing 200 insulators across Pennsylvania.
- February 2025: China’s State Grid announced a record power grid investment of above 600 billion yuan for ultra-high-voltage projects.
- January 2025: The European Commission published anticipatory-grid guidance projecting EUR 730 billion for distribution and EUR 477 billion for transmission by 2040.


Global Utility Poles Market Report Scope
Commonly known as transmission poles, telephone poles, or power poles, utility poles are columns or posts. Typically constructed from wood or aluminum alloy, these poles support overhead power lines and other public utilities. Depending on their application, they can also hold equipment like transformers, street lights, and fiber optic cables.
The utility poles market is segmented by product (transmission & distribution pole [steel, concrete, wood], light pole, high mast pole, monopole, others), height (below 40 feet, 40-70 feet, above 70 feet), end users (electricity transmission, electricity distribution, lighting, telecommunication, others), geography (North America, Europe, Asia Pacific, Latin America, Middle East and Africa). The market size and forecasts are provided in terms of value (USD) for all the above segments.
| Wooden Utility Poles | |
| Steel Utility Poles | Stepped Steel Poles |
| Swaged Steel Poles | |
| Concrete Utility Poles | |
| Fiber-Reinforced Polymer (FRP) Composite Poles |
| Transmission Poles |
| Distribution Poles |
| Street / Lighting Poles |
| High-Mast Poles |
| Monopoles |
| Smart Poles |
| Others |
| Below 40 ft |
| 40-70 ft |
| Above 70 ft |
| Electricity Transmission Utilities |
| Electricity Distribution Utilities |
| Street and Area Lighting Agencies |
| Telecommunication Operators |
| Railways and Transport Infrastructure |
| Others |
| North America | United States | |
| Canada | ||
| Mexico | ||
| South America | Brazil | |
| Argentina | ||
| Rest of South America | ||
| Europe | United Kingdom | |
| Germany | ||
| France | ||
| Italy | ||
| Spain | ||
| Nordics | ||
| Rest of Europe | ||
| Middle East and Africa | Middle East | Saudi Arabia |
| United Arab Emirates | ||
| Turkey | ||
| Rest of Middle East | ||
| Africa | South Africa | |
| Egypt | ||
| Nigeria | ||
| Rest of Africa | ||
| Asia-Pacific | China | |
| India | ||
| Japan | ||
| South Korea | ||
| ASEAN | ||
| Australia | ||
| New Zealand | ||
| Rest of Asia-Pacific | ||
| By Material Type | Wooden Utility Poles | ||
| Steel Utility Poles | Stepped Steel Poles | ||
| Swaged Steel Poles | |||
| Concrete Utility Poles | |||
| Fiber-Reinforced Polymer (FRP) Composite Poles | |||
| By Product | Transmission Poles | ||
| Distribution Poles | |||
| Street / Lighting Poles | |||
| High-Mast Poles | |||
| Monopoles | |||
| Smart Poles | |||
| Others | |||
| By Pole Height | Below 40 ft | ||
| 40-70 ft | |||
| Above 70 ft | |||
| By End-User | Electricity Transmission Utilities | ||
| Electricity Distribution Utilities | |||
| Street and Area Lighting Agencies | |||
| Telecommunication Operators | |||
| Railways and Transport Infrastructure | |||
| Others | |||
| By Geography | North America | United States | |
| Canada | |||
| Mexico | |||
| South America | Brazil | ||
| Argentina | |||
| Rest of South America | |||
| Europe | United Kingdom | ||
| Germany | |||
| France | |||
| Italy | |||
| Spain | |||
| Nordics | |||
| Rest of Europe | |||
| Middle East and Africa | Middle East | Saudi Arabia | |
| United Arab Emirates | |||
| Turkey | |||
| Rest of Middle East | |||
| Africa | South Africa | ||
| Egypt | |||
| Nigeria | |||
| Rest of Africa | |||
| Asia-Pacific | China | ||
| India | |||
| Japan | |||
| South Korea | |||
| ASEAN | |||
| Australia | |||
| New Zealand | |||
| Rest of Asia-Pacific | |||


Key Questions Answered in the Report
What is the current value of the utility poles market?
The utility poles market stands at USD 60.59 billion in 2026 and is projected to reach USD 256.03 billion by 2031.
Which material type holds the largest share of the utility poles market?
Wood poles lead with 54.12% of 2025 revenue because of cost advantages and established supply chains.
Why are smart poles growing faster than traditional pole segments?
Smart poles bundle 5G radios, lighting, and IoT sensors, creating new revenue streams and driving a 10.05% CAGR through 2031.
Which region shows the fastest future growth?
The Middle East and Africa is forecast to expand at 6.22% CAGR, propelled by rural electrification and grid-modernization funding.
How do undergrounding mandates affect pole demand?
Mandatory undergrounding in wildfire-prone areas cuts regional overhead-pole orders but increases demand for fire-resistant composite poles where overhead remains.
Page last updated on:


