China Data Center Power Market Size and Share
Market Overview
| Study Period | 2020 - 2031 |
|---|---|
| Forecast Data Period | 2026 - 2031 |
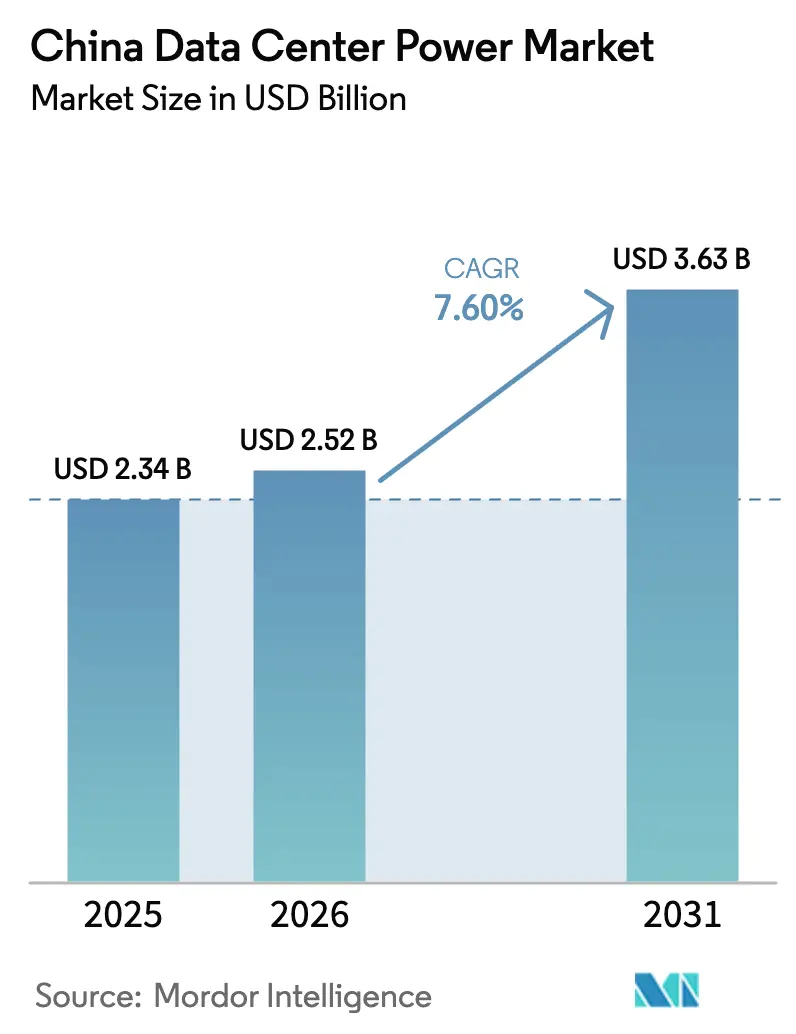
| Base Year Market Size (2025) | USD 2.34 Billion |
| Market Size (2026) | USD 2.52 Billion |
| Market Size (2031) | USD 3.63 Billion |
| Growth Rate (2026 - 2031) | 7.60% CAGR |
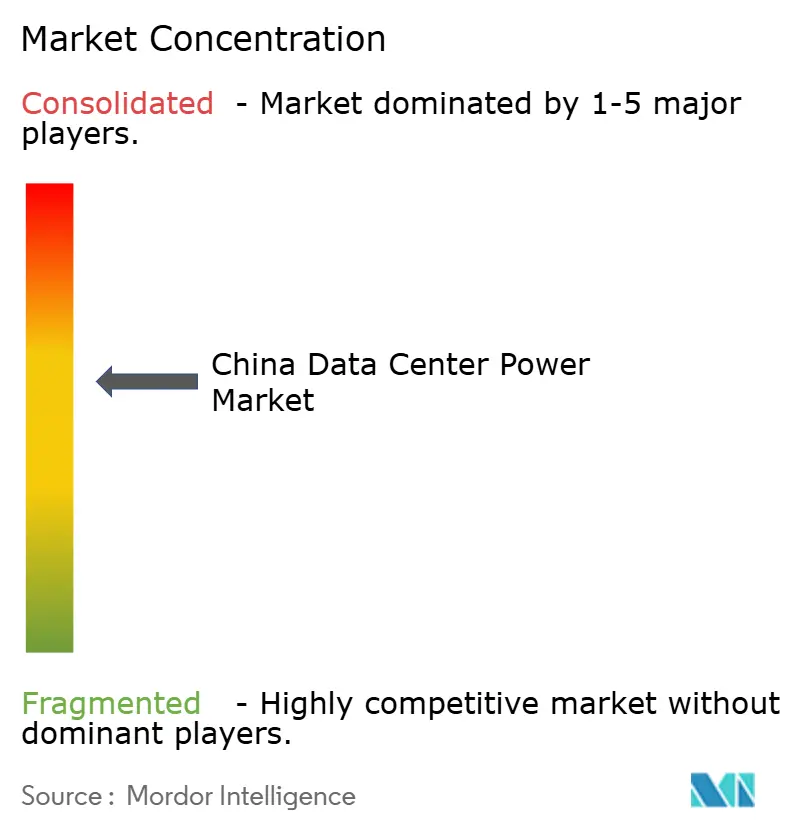
| Market Concentration | Medium |
Major Players *Disclaimer: Major Players sorted in no particular order Image © Mordor Intelligence. Reuse requires attribution under CC BY 4.0. | |
China Data Center Power Market Analysis by Mordor Intelligence
The China data center power market size is expected to grow from USD 2.34 billion in 2025 to USD 2.52 billion in 2026 and is forecast to reach USD 3.63 billion by 2031 at 7.60% CAGR over 2026-2031. Growth is underpinned by large‐scale investments in digital infrastructure, rapid adoption of AI workloads, and government incentives that favor high-efficiency power architectures. Nationwide policies are steering facilities from conventional AC distribution toward DC configurations that can trim energy losses by 10% and lower infrastructure outlays by 15%. Demand is further propelled by renewable-energy procurement rules that reward operators able to integrate wind and solar power into stable on-site systems. Domestic suppliers are leveraging cost advantages and familiarity with local regulations to challenge multinational incumbents, while city-level power‐grid constraints are accelerating the shift of new capacity toward western provinces with surplus green energy. Competitive pressure is therefore leaning toward integrated power designs that combine UPS, battery storage, and intelligent distribution within modular frames optimised for GPU-dense racks.
Key Report Takeaways
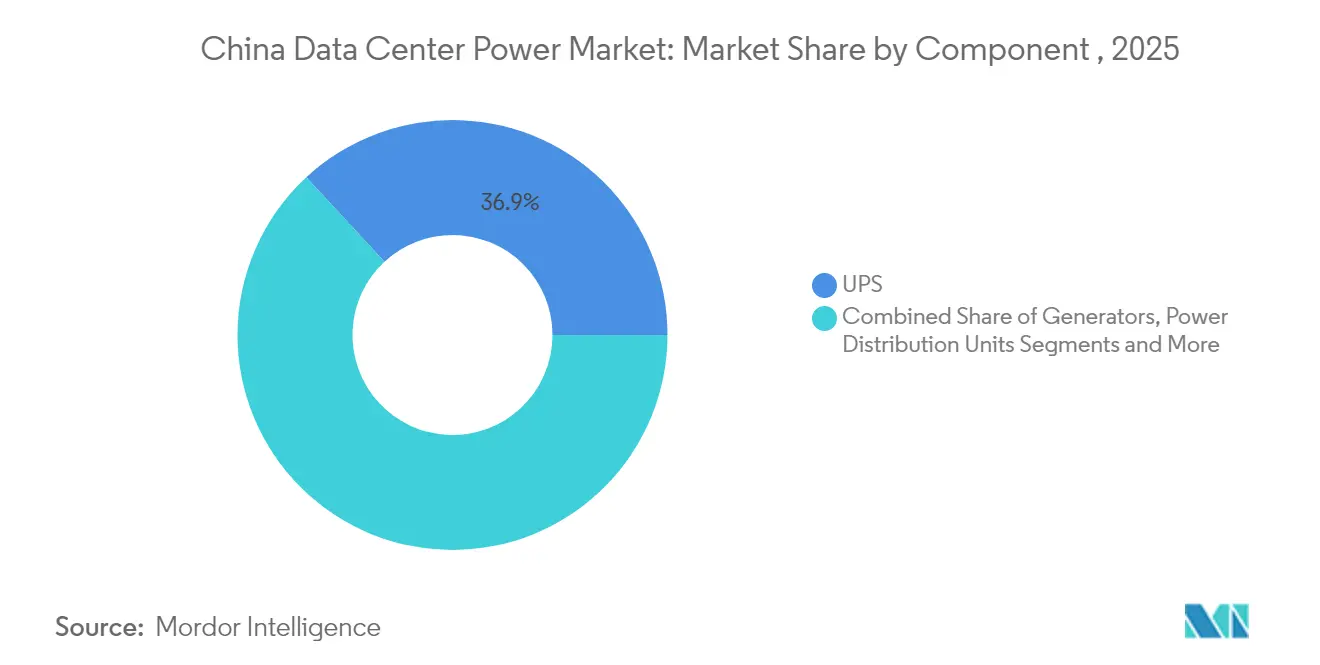
- By component, UPS systems led with 36.90% revenue share in 2025; power distribution units are forecast to expand at a 12.35% CAGR to 2031.
- By data-center type, colocation providers held 44.30% of the China data center power market share in 2025, while hyperscale/cloud providers are projected to grow at 14.40% CAGR through 2031.
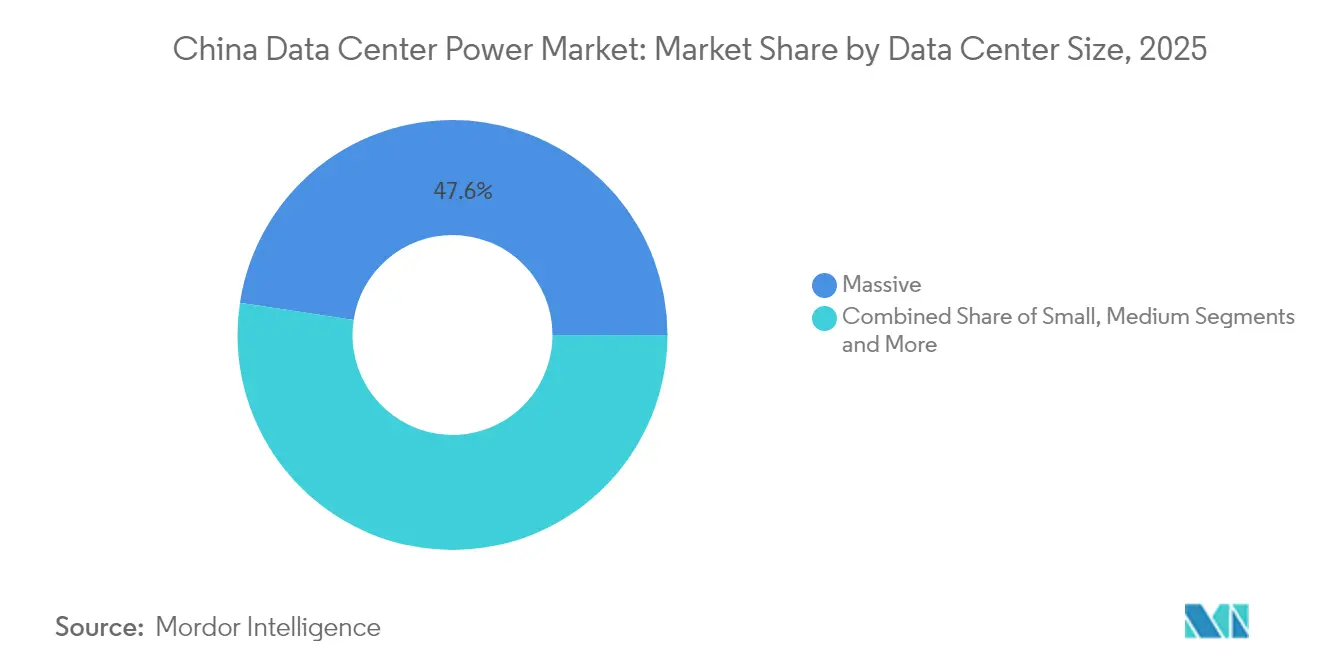
- By data-center size, massive facilities accounted for 47.60% of the China data center power market size in 2025; the mega-size category is anticipated to rise at an 10.75% CAGR between 2026-2031.
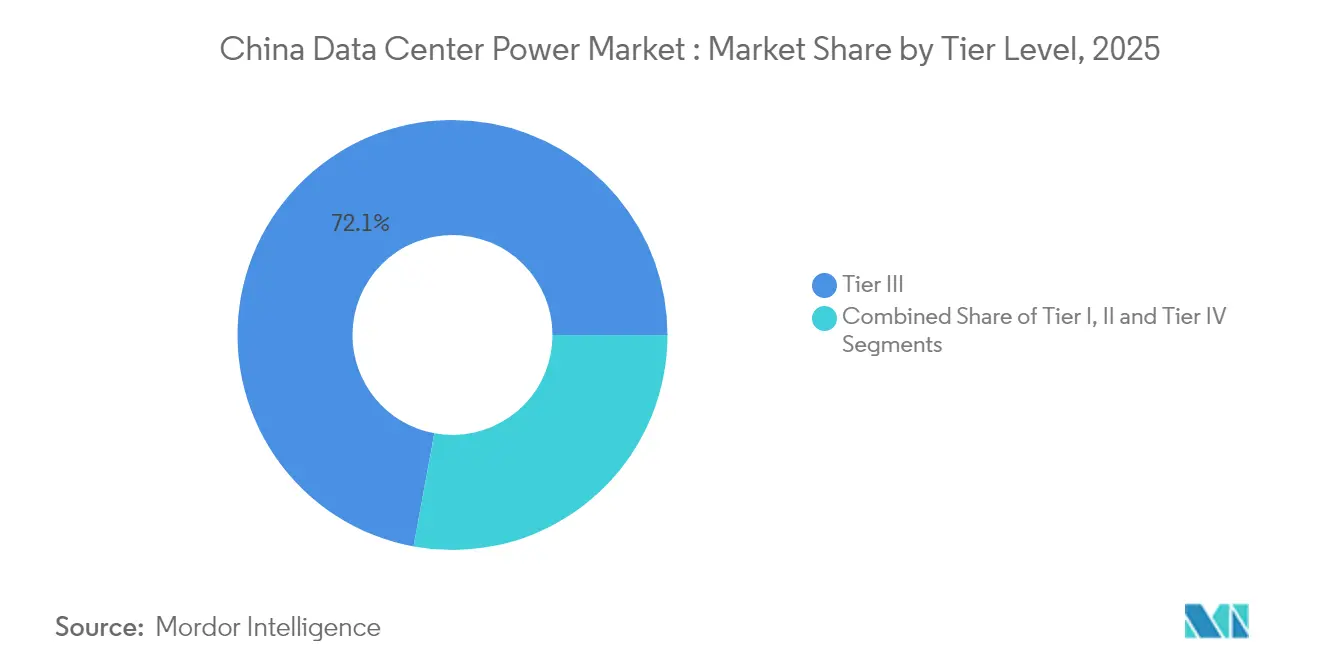
- By tier level, Tier III sites commanded 72.10% share of the China data center power market size in 2025, whereas Tier IV facilities are set to advance at 12.95% CAGR to 2031.
- By region, Beijing contributed 26.80% revenue in 2025; Hebei is expanding fastest with an 10.85% CAGR over the forecast horizon.
Note: Market size and forecast figures in this report are generated using Mordor Intelligence’s proprietary estimation framework, updated with the latest available data and insights as of 2026.
China Data Center Power Market Trends and Insights
Drivers Impact Analysis*
| Driver | ( ~ ) % Impact on CAGR Forecast | Geographic Relevance | Impact Timeline |
|---|---|---|---|
| Rising adoption of hyperscale and AI mega data centers | +2.1% | National; Beijing-Tianjin-Hebei cluster | Medium term (2-4 years) |
| Government “New Infrastructure” stimulus fueling cloud build-out | +1.8% | National; western provinces | Short term (≤ 2 years) |
| Shift to high-efficiency UPS and modular power to cut OPEX | +1.2% | Tier-1 cities first | Medium term (2-4 years) |
| 5G and IoT-driven edge and colocation demand boom | +0.9% | Urban clusters | Medium term (2-4 years) |
| Renewable-energy quotas enabling green power procurement | +0.7% | Hebei, Inner Mongolia | Long term (≥ 4 years) |
| Pilots of small modular reactors for data-center clusters | +0.5% | Limited pilot zones | Long term (≥ 4 years) |
| Source: Mordor Intelligence | |||
Rising adoption of hyperscale and AI mega data centers
AI training workloads push rack densities up to 10 times those of legacy halls, forcing operators to re-engineer power trains for higher amperage and tighter voltage tolerance. According to the Ministry of Industry and Information Technology, Hyperscalers plan to deploy more than 300 EFLOPS of AI compute by 2025, accelerating demand for modular busways, battery-ready UPS blocks, and liquid-cooling-compatible PDUs. The International Energy Agency projects that electricity consumed by AI-optimised Chinese data centers will quadruple by 2027.[1]International Energy Agency, “AI is set to drive surging electricity demand from data centres while offering the potential to transform how the energy sector works,” iea.org Equipment vendors have responded with rack-level DC architectures that cut conversion loss, and with lithium-battery UPS modules able to discharge at higher ambient temperatures.
Government “New Infrastructure” stimulus fueling cloud build-out
Central authorities have earmarked RMB 1.2 trillion (USD 0.17 trillion) for cloud and intelligent-computing capacity by 2025.[2]National Development and Reform Commission, “China plans to build 8 national computing hubs with 10 data center clusters,” ndrc.gov.cn Eight national computing hubs with ten data-center clusters are already under construction, redirecting workloads from coastal metros to inland zones where land and green energy are plentiful. State-owned utilities, provincial governments, and private carriers are coordinating grid connections so that clusters can draw bulk power at favourable tariffs while conforming to a mandated PUE ceiling of 1.3 by 2025. These policies shorten payback periods for high-efficiency electrical gear and create clear volumes for domestic production lines.
5G and IoT-driven edge and colocation demand boom
Full nationwide 5G coverage is spurring real-time analytics for industry, healthcare, and connected vehicles. These low-latency applications require micro-data-centers embedded in malls, factories, and roadside shelters, increasing the count of sites that must run autonomously on compact power modules. Colocation firms are leveraging distributed campuses to aggregate edge workloads that demand sub-5 ms round-trip latency. The number of 5G base stations in China has hit 4.25 million, with the number of gigabit broadband users surpassing 200 million.[3]The State Council Information Office, “The number of 5G base stations in China has hit 4.25 million,” scio.gov.cn Intelligent PDUs with on-board metering help track per-customer usage, enabling granular billing and early fault detection. Vendors integrating UPS, sequenced transfer switches, and cooling in a single rack cabinet are gaining share in this fast-moving niche.
Renewable-energy quotas enabling green power procurement
Grid operators in provinces such as Hebei and Inner Mongolia are required to boost green-power dispatch annually, opening priority access for data-center clusters that commit to long-term renewable purchases. Tencent, the Chinese tech player, has rolled out a renewable-powered hybrid microgrid at its data center in Huailai County, Hebei Province. With a total installed capacity of 10.99MW, the project boasts an annual generation capacity of 14 million kWh. Operators deploying hybrid AC-DC backbones report smoother voltage profiles that limit generator runtime and lower carbon intensity enough to meet investor disclosure frameworks.
Restraint Impact Analysis*
| Restraint | ( ~ ) % Impact on CAGR Forecast | Geographic Relevance | Impact Timeline |
|---|---|---|---|
| High upfront CAPEX for advanced power systems | -1.2% | Nationwide | Short term (≤ 2 years) |
| Grid-power constraints in Tier-1 cities | -0.9% | Beijing, Shanghai, Guangzhou, Shenzhen | Medium term (2-4 years) |
| Provincial water-use limits hitting evaporative cooling | -0.6% | Water-scarce districts | Medium term (2-4 years) |
| Export controls on GPUs slowing hyperscaler CAPEX | -0.5% | National | Short term (≤ 2 years) |
| Source: Mordor Intelligence | |||
High upfront CAPEX for advanced power systems
Lithium-ion UPS arrays, intelligent PDUs, and integrated storage solutions command premiums of 30-40% over legacy equipment, deterring cash-constrained enterprises despite lower lifecycle cost. Financing challenges are most acute in edge and second-tier colocation projects, where owners struggle to align customer contracts with amortisation schedules. Domestic vendors now offer tiered product lines that match step-wise upgrade paths, yet smaller operators still postpone replacements, potentially locking in higher energy losses and maintenance overhead for years.
Grid-power constraints in Tier-1 cities
Urban load pockets already operate near transmission capacity, forcing authorities in Beijing and Shanghai to cap data-center megawatts per site. Operators therefore pursue high-density rack designs that squeeze more compute into limited footprints but also intensify cooling and power-delivery complexity. Battery energy storage systems rated for fast discharge are being adopted to shave peaks and smooth incoming supply. Where grid applications are denied, some providers migrate expansion phases to adjacent provinces, reinforcing the national east-to-west rebalancing plan.
*Our forecasts treat driver/restraint impacts as directional, not additive. The impact forecasts reflect baseline growth, mix effects, and variable interactions.
Segment Analysis
By Component: UPS Systems Anchor Critical Infrastructure
UPS platforms captured 36.90% revenue in 2025 and remain the cornerstone of power resilience across the China data center power market. Vendors are retiring lead-acid strings in favour of lithium packs that offer double the cycle life and occupy half the floor area. Modular topologies allow hot-swap maintenance without load transfer, lifting availability, and meeting Tier III redundancy norms. Sales of intelligent PDUs are climbing at a 12.35% CAGR as operators chase outlet-level monitoring to manage AI clusters that can spike from 6 kW to 20 kW per rack in seconds. Generators are evolving toward fuel-cell hybrids that promise near-zero local emissions; Tencent’s 400 kW hydrogen cell deployment illustrates the move away from diesel. Battery energy storage systems complement peak-shaving strategies, enabling facilities to honour grid demand-response contracts.


By Data Center Type: Colocation Providers Hold the Lead
Colocation facilities commanded 44.30% of the China data center power market in 2025, favoured by enterprises that prefer opex-driven models over self-build. Providers leverage economies of scale to negotiate bulk clean electricity and to invest in high-efficiency UPS blocks that lower power costs for tenants. The hyperscale cloud segment, growing at 14.40% CAGR, is erecting 100 MW campuses that embed on-site substations and direct-wire renewables. These operators adopt DC busways and immersion cooling to support AI training farms, setting new benchmarks that smaller sites strive to emulate. Enterprises continue to run on-premise halls for regulated workloads, but tightening green mandates are nudging many toward green colocation nodes that guarantee PUE below 1.3.
By Data Center Size: Massive Facilities Dominate Capacity Build-outs
Massive sites above 10,000 sq m held 47.60% share of installed megawatts in 2025, reflecting national policies that favour clustering for energy efficiency. Operators achieve economies of scale through centralised chilled-water plants and high-voltage feed lines that serve dozens of halls. The China data center power market size for mega facilities, defined as campuses exceeding 100 MW IT load, is projected to expand at 10.75% CAGR as AI workloads demand contiguous compute farms. Each mega campus often warrants a dedicated 220 kV substation, demanding early collaboration with grid planners. Within the same perimeter, operators zone racks by power density, using busway segments that can be hot-swapped as chip TDP ratings climb. Small and medium halls remain relevant for latency-sensitive or compliance-bound data, but many must retrofit cooling and electrical plants to hit the 1.3 PUE target.
By Tier Level: Tier III Sets the Baseline
Tier III achieved 72.10% share in 2025 and represents the default reliability benchmark for financial, e-commerce, and public-sector workloads. Operators deploy N+1 UPS, dual utility feeds, and concurrent maintainability to secure 99.982% uptime. The average PUE in Tier III halls fell to 1.48 in 2024 and is expected to improve further as lithium batteries and liquid cooling become mainstream. Tier IV footprints are projected to grow at 12.95% CAGR because critical AI inference and fintech platforms require fault-tolerant 2N architectures. Each Tier IV build threads dual power paths down to rack level, doubling demand for identical switchgear and monitored branch circuits. The market also recognises a hybrid “Tier III+” practice, where operators add selective 2N components often UPS and distribution without full mechanical redundancy.
Geography Analysis
Beijing remained the largest regional contributor with 26.80% revenue share in 2025. Strict municipal rules now bar projects whose PUE exceeds 1.5, which has accelerated migration toward lithium UPS blocks, aisle containment, and chilled-water economiser loops. Operators investing early in these upgrades gain priority grid allotments, enabling them to support AI start-ups clustered in Zhongguancun and fintech workloads in the city’s CBD. Yet limited grid headroom is capping expansion, prompting providers to lease capacity in neighbouring Hebei and Tianjin while maintaining cross-region DR nodes.
Hebei recorded the fastest rise, advancing at 10.85% CAGR through 2031 as part of the Beijing-Tianjin-Hebei integrated data-hub plan. Zhangjiakou hosts 330,000 standard racks, fuelled largely by wind power generated on the Mongolian plateau. Operators pair battery energy storage systems with smart inverters to smooth variability, demonstrating compliance with green data-center scorecards. Lower land cost and abundant renewable certificates make the province attractive for hyperscalers that need fresh megawatts without the grid congestion seen in the capital.
Competitive Landscape
Domestic firms increasingly dictate the pace and standards within the China data center power market. Multinationals such as Schneider Electric and ABB still lead in switchgear and holistic building-management platforms but face mounting localisation requirements that favour local assembly lines. Joint ventures between state power groups and private integrators are emerging to bundle grid connection, renewable procurement, and critical power hardware in turnkey packages.
Strategic investment underscores the battle for scale. Huawei’s 2025 energy-trend paper promotes converged power architectures that merge UPS, battery storage, and renewable interfaces into a single controller, guiding product roadmaps across its FusionPower line.. Delta Electronics and Sungrow are diversifying from solar inverters into battery storage racks sized for data-center discharge profiles, betting on policy-driven demand for on-site renewables.
China Data Center Power Industry Leaders
Schneider Electric SE
Vertiv Group Corp.
ABB Ltd
Eaton Corporation plc
Huawei Technologies Co., Ltd.
- *Disclaimer: Major Players sorted in no particular order

Recent Industry Developments
- May 2025: Vertiv expanded production in China with a USD 50 million factory dedicated to high-efficiency UPS systems and liquid-cooling components.
- March 2025: The National Development and Reform Commission approved 12 additional data-center projects in Zhangjiakou, Hebei, reinforcing the green cluster model.
- February 2025: Kehua Data won a USD 100 million contract to supply modular UPS and PDUs for a hyperscale campus in western China
- January 2025: The Ministry of Industry and Information Technology began piloting the removal of the 50% foreign ownership cap on data centers in four major cities


Research Methodology Framework and Report Scope
Market Definitions and Key Coverage
Our study treats the China data center power market as the annual revenue generated by power distribution, backup, and monitoring equipment, principally UPS systems, PDUs, switchgear, generators, and battery energy storage, together with associated installation and maintenance services that keep servers, storage, and networking hardware online within purpose-built data centers.
Scope Exclusions: Stand-alone building wiring, HVAC chillers, on-site renewable generation assets, and software-only DCIM modules are not part of the sizing.
Segmentation Overview
- By Component
- Electrical Solutions
- UPS Systems
- Generators
- Diesel Generators
- Gas Generators
- Hydrogen Fuel-cell Generators
- Power Distribution Units
- Switchgear
- Transfer Switches
- Remote Power Panels
- Energy-storage Systems
- Service
- Installation and Commissioning
- Maintenance and Support
- Training and Consulting
- Electrical Solutions
- By Data Center Type
- Hyperscaler/Cloud Service Providers
- Colocation Providers
- Enterprise and Edge Data Center
- By Data Center Size
- Small Size Data Centers
- Medium Size Data Centers
- Large Size Data Centers
- Massive Size Data Centers
- Mega Size Data Centers
- By Tier Level
- Tier I and II
- Tier III
- Tier IV
- By Region
- Beijing
- Tianjin
- Hebei
- Other Regions
Detailed Research Methodology and Data Validation
Primary Research
Mordor analysts conducted interviews with facility managers at colocation sites in Beijing, Shanghai, Hebei, and Guizhou, senior engineers from UPS suppliers, and consultants specializing in grid tie-in procedures. These conversations verified real-world ASP shifts, redundancy preferences, and service margins, filling gaps left by desk research.
Desk Research
We began with publicly available datasets from MIIT, CAICT, and the National Development and Reform Commission that map installed IT load, new facility approvals, and mandatory PUE caps across provinces. Trade statistics from China Customs clarified import volumes for lithium-ion UPS, while State Grid tender bulletins signposted average unit prices for medium-voltage switchgear. News flows in Dow Jones Factiva and company 10-Ks helped link hyperscale expansion timetables to capital outlays. Lastly, academic work from Tsinghua University and Greenpeace reports on electricity consumption trends grounded energy efficiency assumptions. This list is illustrative; many additional sources were consulted for cross-checks and context.
Market-Sizing & Forecasting
A top-down reconstruction starts with installed IT load (MW) per province, multiplies it by average PUE and prevailing electricity tariffs to approximate total power infrastructure spend, then allocates revenue by equipment mix using shipment data. Supplier roll-ups of sampled ASP multiplied by volume for UPS and PDU units act as a bottom-up reasonableness test. Key variables include new rack capacity additions, Tier III/IV adoption rates, median PUE, lithium battery penetration, and utility tariff movements. Five-year forecasts employ multivariate regression blended with ARIMA to project each driver before scenario weighting for policy or supply chain shocks. Gaps in component splits are bridged with weighted averages from primary interviews.
Data Validation & Update Cycle
Outputs pass variance screens against historical ratios, peer benchmarks, and power demand proxies. Senior analysts review anomalies; findings are refreshed annually, with interim updates triggered by material events such as tariff revisions or hyperscale landings. A final pre-publish sweep ensures clients receive the latest view.
Why Mordor's China Data Center Power Baseline Is Trusted
Published estimates differ because firms choose dissimilar product baskets, life cycle cost assumptions, and refresh cadences.
According to Mordor Intelligence, our clear boundary between power hardware revenue and wider facility CAPEX, plus yearly data pulls, reduces distortion.
Key gap drivers include whether services are bundled, if under construction sites are counted, and how backups such as dual-cord redundancy are valued.
Benchmark comparison
| Market Size | Anonymized source | Primary gap driver |
|---|---|---|
| USD 2.34 B (2025) | Mordor Intelligence | - |
| USD 1.18 B (2024) | Regional Consultancy A | Excludes UPS services and retrofit projects |
| USD 4.20 B (2024) | Global Consultancy B | Rolls whole electrical CAPEX plus planned Tier IV builds |
| USD 1.30 B (2025) | Industry Association C | Relies mainly on import data, omitting domestic redundancy upgrades |
These comparisons show that our disciplined scope selection, dual track modeling, and annual refresh cycle deliver a balanced, transparent baseline that decision makers can replicate and trust.


Key Questions Answered in the Report
What is the current value of the China data center power market?
The market stands at USD 2.52 billion in 2026 and is projected to grow to USD 3.63 billion by 2031.
Which component segment leads spending
UPS systems hold 36.90% of 2025 revenue due to their central role in uptime assurance
Why are western provinces favoured for new campuses?
Regions such as Hebei offer abundant renewable energy, lower land cost, and supportive policies under the “Eastern Data, Western Computing” scheme.
How are operators improving PUE?
They deploy lithium-ion UPS blocks, liquid or immersion cooling, and optimise airflow containment to meet the mandated PUE threshold of 1.3 by 2025.
Page last updated on:


