Ethernet Connector And Transformer Market Size and Share
Market Overview
| Study Period | 2019 - 2030 |
|---|---|
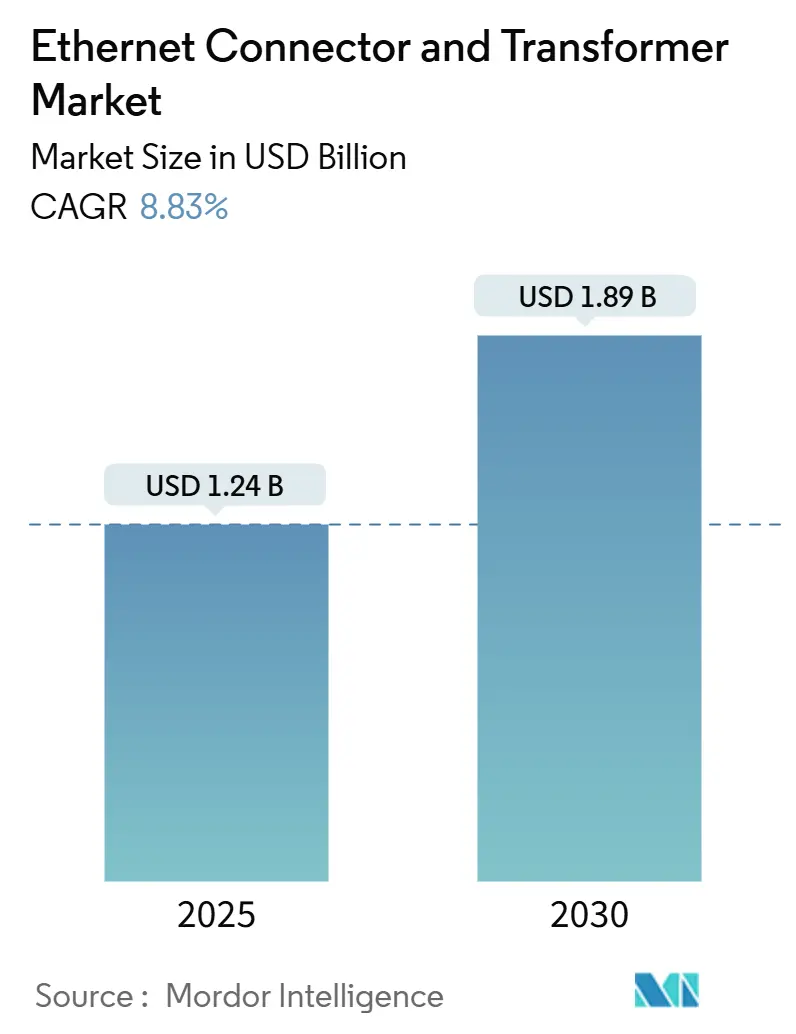
| Market Size (2025) | USD 1.24 Billion |
| Market Size (2030) | USD 1.89 Billion |
| Growth Rate (2025 - 2030) | 8.83% CAGR |
| Fastest Growing Market | South America |
| Largest Market | Asia Pacific |
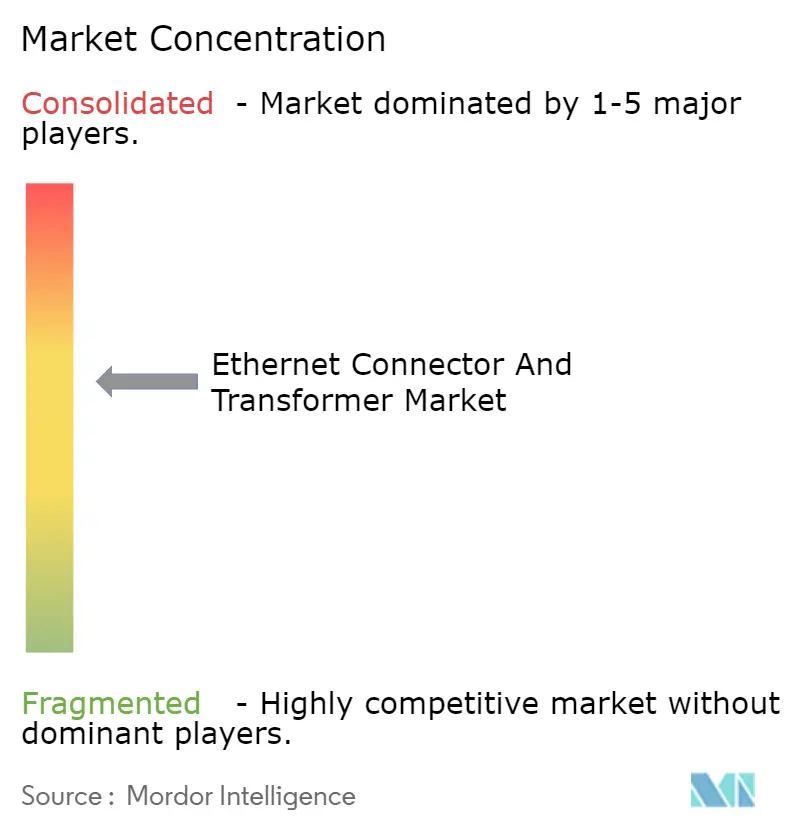
| Market Concentration | Medium |
Major Players *Disclaimer: Major Players sorted in no particular order Image © Mordor Intelligence. Reuse requires attribution under CC BY 4.0. | |
Ethernet Connector And Transformer Market Analysis by Mordor Intelligence
The global Ethernet connector and transformer market size reached USD 1.24 billion in 2025 and is projected to climb to USD 1.89 billion by 2030, translating to an 8.83% CAGR during the forecast window. Rapid adoption of single-pair Ethernet (SPE) in industrial automation, mandatory PoE++ support in smart-building projects, and hyperscale data-center upgrades to 25 G/40 G/100 G port speeds anchor the expansion of the Ethernet connector and transformer market. Competitive intensity is rising as vertically integrated incumbents confront cost-focused Asian suppliers, while persistent ferrite-core shortages strain lead times for high-frequency designs. Simultaneously, integration of magnetics within RJ45 housings compresses PCB footprints in space-restricted equipment, and zonal automotive architectures fuel demand for rugged, automotive-grade interconnects.
Key Report Takeaways
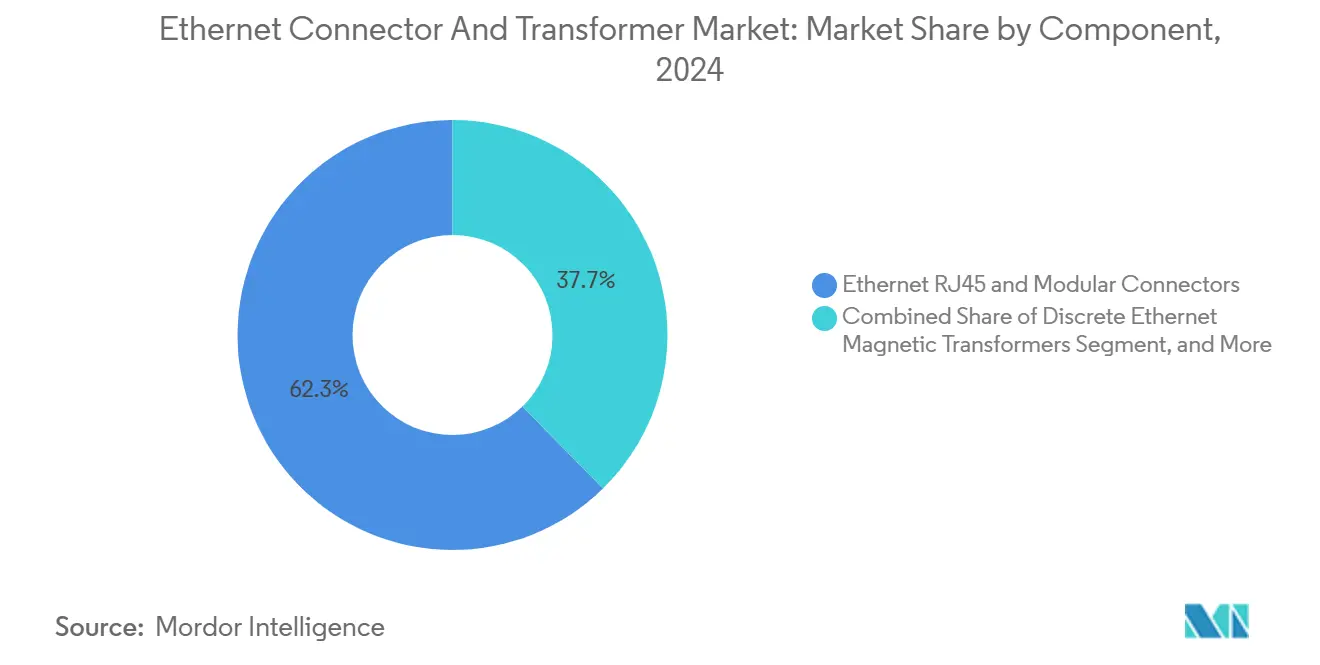
- By component, RJ45 and modular connectors led with 62.34% of Ethernet connector and transformer market share in 2024; Integrated Connector-Magnetics (ICM) modules are growing at an 11.23% CAGR through 2030.
- By mounting type, through-hole technology retained 61.89% share of the Ethernet connector and transformer market size in 2024, while surface-mount variants are advancing at a 10.35% CAGR to 2030.
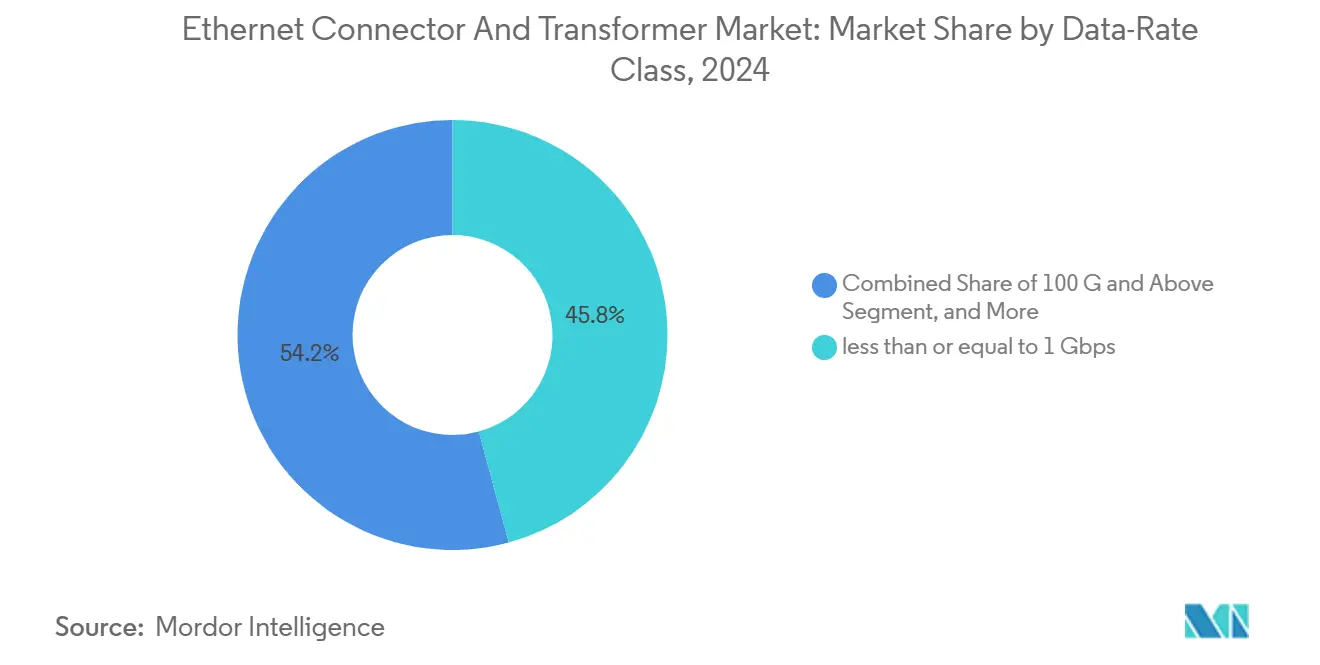
- By data-rate class, traditional sub-1 Gbps solutions accounted for 45.78% share of the Ethernet connector and transformer market size in 2024 and the 25 G/40 G segment is progressing at a 9.91% CAGR through 2030.
- By end-user industry, telecommunications equipment captured 28.83% of Ethernet connector and transformer market share in 2024, while automotive and transportation exhibits the fastest 9.67% CAGR to 2030.
- By geography, Asia-Pacific commanded 41.23% revenue share in 2024; South America is forecast to expand at an 8.98% CAGR to 2030.
Global Ethernet Connector And Transformer Market Trends and Insights
Drivers Impact Analysis*
| Driver | (~) % Impact on CAGR Forecast | Geographic Relevance | Impact Timeline |
|---|---|---|---|
| Shift to single-pair Ethernet in IIoT architectures | +1.8% | Global with Asia-Pacific and Europe leadership | Medium term (2-4 years) |
| Rapid adoption of 25 G/40 G/100 G port speeds in hyperscale data centers | +2.1% | North America and Asia-Pacific core | Short term (≤ 2 years) |
| Automotive OEM move toward zonal Ethernet backbones | +1.5% | Global with early gains in Germany, Japan, South Korea | Medium term (2-4 years) |
| Mandatory PoE++ (IEEE 802.3bt) in smart buildings | +1.2% | North America and EU, expanding to Asia-Pacific | Long term (≥ 4 years) |
| Migration from legacy fieldbus to Ethernet-based automation | +1.4% | Global manufacturing centers | Long term (≥ 4 years) |
| Integration of magnetics into high-density RJ45 (ICM) | +0.9% | Global, especially consumer electronics hubs | Medium term (2-4 years) |
| Source: Mordor Intelligence | |||
Rapid adoption of 25 G/40 G/100 G port speeds in hyperscale data centers
Hyperscale operators now specify ≥ 25 G ports for 40% of new servers, up from 15% in 2023, to feed AI training clusters.[1]IEEE Standards Association, “Ethernet’s Next Bar Is Now – 800 Gb/s,” ieee.org The IEEE 802.3 approval of 800 GbE in 2024 cements a high-speed road-map, while linear pluggable optics shave 30% power versus conventional transceivers. Elevated signal-integrity needs are shifting demand toward ICM modules that embed high-permeability ferrite cores. Suppliers capable of managing insertion loss below 0.35 dB at 25 °C differentiate in this environment. Consequently, the Ethernet connector and transformer market benefits from value-added design wins tied to thermal management and crosstalk suppression.
Automotive OEM move toward zonal Ethernet backbones
Vehicle platforms migrate from point-to-point harnesses to centralized compute zones connected through 10 Gbps Ethernet links, trimming wiring weight by up to 40%.[2]Infineon Technologies, “Infineon to Acquire Marvell’s Automotive Ethernet Business,” infineon.com Infineon's USD 2.5 billion acquisition of Marvell's automotive Ethernet assets underpins a forecast USD 225–250 million revenue addition in fiscal 2026. Connector vendors must meet LV214 and USCAR vibration and temperature mandates while delivering shield effectiveness beyond 45 dB at 1 GHz. Demand concentration in Germany, Japan, and South Korea is accelerating AEC-Q200 qualified connector launches and pushing the Ethernet connector and transformer market toward higher ASPs.
Shift to single-pair Ethernet in IIoT architectures
Single-pair Ethernet halves conductor counts compared with four-pair Cat 5e while supporting 600 MHz bandwidth under IEC 63171-6.[3]Würth Elektronik, “Single-Pair Ethernet Application Guide,” we-online.com Manufacturing sites report 25% installation-cost savings versus legacy fieldbus wiring. SPE connectors offering IP20/IP67 options allow field-device migration without gateway conversions, enhancing deterministic control for Industry 4.0. Rising adoption in Asia-Pacific discrete-manufacturing hubs lifts mid-volume orders for compact, board-edge SPE jacks that integrate 100 W PoE++ capability, sustaining growth for the Ethernet connector and transformer market.
Mandatory PoE++ in smart buildings
Municipal building codes across North America and the EU increasingly require PoE++ ready cabling to power IoT endpoints such as LED luminaires and access-control systems. Connector suppliers that integrate 100 W power magnetics within the RJ45 cavity deliver 30–40 mm PCB savings relative to discrete implementations. Demand escalates for surface-mount PoE++ modules rated for operating temperatures up to 70 °C at full current, reinforcing product-mix shifts that favor premium solutions within the Ethernet connector and transformer market.
Restraints Impact Analysis*
| Restraint | (~) % Impact on CAGR Forecast | Geographic Relevance | Impact Timeline |
|---|---|---|---|
| Short-term supply instability of high-frequency ferrite cores | -0.8% | Global with acute Asia-Pacific impact | Short term (≤ 2 years) |
| Cost pressure from commoditized low-end PCB jack suppliers in Asia | -0.6% | Global, price-sensitive segments | Long term (≥ 4 years) |
| Adoption of contactless power/data connectors in harsh-motion robotics | -0.4% | Asia-Pacific and Europe automation centers | Medium term (2-4 years) |
| Increasing preference for wireless backhaul in small-cell 5G | -0.3% | Global urban areas | Medium term (2-4 years) |
| Source: Mordor Intelligence | |||
Short-term supply instability of high-frequency ferrite cores
Premium ferrite materials require permeability ≥ 220 µʹ at 100 MHz, yet only a limited supplier pool meets these tolerances. Price swings of 15-20% and lead times extending beyond 16 weeks have appeared since 2024. Connector makers are qualifying secondary sources but expect 18–24 months before volume readiness, causing selective allocation of high-speed ICM modules. End-user projects with strict timeline constraints may switch to optical inter-faces, trimming near-term revenue for the Ethernet connector and transformer market.
Cost pressure from commoditized low-end PCB jack suppliers in Asia
Shenzhen-based producers market RJ45 jacks 40-50% cheaper than branded equivalents, undercutting incumbents in consumer routers and low-tier switches. Margin compression pushes tier-one vendors to emphasize differentiated features such as extended temperature ranges and EMI gaskets. The pricing divide leads to consolidation as volume leaders absorb non-viable mid-tier competitors, reshaping the competitive landscape of the Ethernet connector and transformer market.
*Our forecasts treat driver/restraint impacts as directional, not additive. The impact forecasts reflect baseline growth, mix effects, and variable interactions.
Segment Analysis
By Component: ICM Integration Drives Innovation
ICM modules contributed USD 0.46 billion to the Ethernet connector and transformer market size in 2025 and are projected to post an 11.23% CAGR to 2030, faster than any peer segment. Their share gain arises from 30-40% board-area savings that unlock denser 48-port gigabit switches. At 10 Gbps data rates, PulseChip transformers sustain insertion loss below 0.7 dB and meet IEEE 802.3bt isolation, underscoring performance parity with discrete designs.
RJ45 and modular connectors still held 62.34% of Ethernet connector and transformer market share in 2024, reflecting their universal footprint. Discrete transformers occupy a declining middle ground, yet remain vital where design flexibility or elevated isolation voltage matters. Connector vendors bundle discrete transformers with SPE jacks to simplify certification workflows for industrial OEMs. This balanced product mix enables suppliers to cushion cyclical swings while the Ethernet connector and transformer market migrates toward higher-density solutions.


By Mounting Type: Surface-Mount Gains Momentum
Through-hole variants represented USD 0.77 billion or 61.89% of the Ethernet connector and transformer market size in 2025, sustained by legacy telecom switchgear, outdoor PoE injectors, and factory-floor equipment that require robust solder joints. Tight-pitch through-hole tails simplify 90-degree board deployment and assure board-level coplanarity under thermal shock cycles.
Surface-mount devices clock a 10.35% CAGR to 2030 as automated pick-and-place lines dominate high-volume consumer and server builds. Automotive SPE modules adopt gull-wing leads compatible with reflow profiles at +245 °C, facilitating zonal control-unit miniaturization. SMT adoption elevates inspection stringency, encouraging X-ray monitoring of solder voids under magnetics. Consequently, assembly-yield gains underpin vendor gross-margin defense even as unit ASPs edge downward, reinforcing revenue momentum in the Ethernet connector and transformer market.
By Data-Rate Class: High-Speed Segments Accelerate
Sub-1 Gbps connectivity still accounts for 45.78% of Ethernet connector and transformer market share, indispensable for voice switches, POS terminals, and legacy PLCs. Yet its revenue weight drifts lower as unit ASPs compress.
The 25 G/40 G class grows 9.91% annually, buoyed by NVIDIA GPU clusters connecting through 800 GbE fabrics that demand eight-lane breakout cables. ICM suppliers qualify new ferrite mixes to curb common-mode noise at 10 GHz harmonic frequencies. Parallel development of 100 G/400 G pluggables primes a virtuous cycle of bus-bar power modules that reuse PCB real estate freed by connector consolidation, sustaining high-value shipments within the Ethernet connector and transformer market.
By End-user Industry: Automotive Transformation Accelerates
Telecom equipment comprised 28.83% of Ethernet connector and transformer market share in 2024 on the back of 5 G macro-cell rollouts and fixed-mobile convergence gateways. Project pipelines include Open RAN platforms that embed 100 W PoE++ endpoints needing 25 µH isolation magnetics for Class 8 power budgets.
Automotive and transportation expands 9.67% a year, catalyzed by over-the-air update regimes and sensor fusion loads that lean on 10 Gbps links. Y-HDE connectors deliver 20 Gbps differential skew below 15 ps to satisfy ADAS latency thresholds. Compliance with ISO 16750 vibration and USCAR-2 mating-force curves separates premium suppliers from commodity vendors, amplifying value creation in the Ethernet connector and transformer market.
Geography Analysis
Asia-Pacific leads the Ethernet connector and transformer market at 41.23% thanks to its dual role as global production hub and largest consuming region. China’s Made-in-China 2025 and Japan’s Society 5.0 strategies accelerate factory digitalization that relies on SPE field networks. South Korea’s 300 mm fab expansions lift demand for 25 Gbps network cards needing low-leakage inductors. Robust supply chains for ferrite cores exist, but face cobalt-oxide price volatility. Regional OEMs increasingly adopt IEEE 802.3bt Class 8 designs, stimulating local ICM capacity expansion.
North America follows with strong demand from hyperscale data-centers clustered in Virginia, Ohio, and Alberta. Major cloud operators are migrating to 400 GbE front-panel ports, creating pull-through for high-frequency isolation transformers. Automotive plants in Michigan and Ontario adopt zonal Ethernet harnesses to support Level-4 autonomy pilots. These projects favor suppliers capable of PPAP documentation, sustaining premium ASPs.
South America, while smaller, registers the fastest CAGR at 8.98%. Brazil’s national smart-meter rollout deploys PoE++ gateways in multi-dwelling units, while Argentina’s agritech sector adopts ruggedized PoE injectors for field sensors. Localization policies spur connector vendors to partner with contract assemblers in Campinas. Despite macroeconomic swings, regional customers prefer Ethernet over Wi-Fi for latency-sensitive machine-vision stations, extending market runway.


Competitive Landscape
The Ethernet connector and transformer market displays moderate concentration. TE Connectivity, Amphenol, and Molex collectively account for roughly 45% of global revenue through expansive portfolios and vertical integration in stamping, plating, and over-mold processes. Amphenol’s USD 10.5 billion purchase of CommScope’s connectivity division widens its fiber and copper offering breadth and secures volume leverage in ferrule polishing.
Second-tier players such as Bel Fuse, Pulse Electronics, JAE, and Samtec carve out high-speed or high-power niches. Bel Fuse leverages 75 years of magnetics expertise to market MagJack ICMs rated up to 10 Gbps and 100 W PoE++. JAE demonstrates 224 Gbps PAM4 prototypes at DesignCon 2025, illustrating R&D readiness for terabit transceiver ecosystems.
Asian challengers offer stripped-down RJ45 jacks for sub-USD 0.10 volumes, compressing commodity margin pools. Top vendors respond by adding co-design services, pre-certification support for IEEE 802.3cg SPE, and end-of-line test automation to defend pricing. Intellectual-property holdings in press-fit pin geometries and EMI gasket alloys act as barriers. Consortium participation in the Ultra Ethernet Alliance and Open Compute Project influences roadmap visibility and keeps incumbents anchored in standards development.
Ethernet Connector And Transformer Industry Leaders
TE Connectivity Ltd.
Amphenol Corporation
Molex LLC
Hirose Electric Co., Ltd.
Bel Fuse Inc.
- *Disclaimer: Major Players sorted in no particular order

Recent Industry Developments
- August 2025: Amphenol completed its USD 10.5 billion acquisition of CommScope’s connectivity and cable solutions business.
- April 2025: Infineon signed a USD 2.5 billion agreement to acquire Marvell’s automotive Ethernet business.
- April 2025: Samtec introduced Si-Fly LP low-profile cable assemblies suited for under-heat-sink routing.
- January 2025: JAE previewed a 224 Gbps PAM4 connector and a 0.8 mm coaxial unit rated to 145 GHz at DesignCon 2025.


Global Ethernet Connector And Transformer Market Report Scope
| Ethernet RJ45 and Modular Connectors |
| Discrete Ethernet Magnetic Transformers |
| Integrated Connector-Magnetics (ICM) |
| Through-Hole (THT) |
| Surface-Mount (SMT) |
| less than or equal to 1 Gbps |
| 2.5 G/5 G |
| 10 Gbps |
| 25 G/40 G |
| 100 G and Above |
| Telecommunications Equipment |
| Hyperscale and Enterprise Data Centers |
| Industrial Automation and IIoT |
| Automotive and Transportation |
| Consumer Electronics |
| Aerospace and Defense |
| North America | United States | |
| Canada | ||
| Mexico | ||
| Europe | Germany | |
| United Kingdom | ||
| France | ||
| Russia | ||
| Rest of Europe | ||
| Asia-Pacific | China | |
| Japan | ||
| India | ||
| South Korea | ||
| Australia | ||
| Rest of Asia-Pacific | ||
| Middle East and Africa | Middle East | Saudi Arabia |
| United Arab Emirates | ||
| Rest of Middle East | ||
| Africa | South Africa | |
| Egypt | ||
| Rest of Africa | ||
| South America | Brazil | |
| Argentina | ||
| Rest of South America | ||
| By Component | Ethernet RJ45 and Modular Connectors | ||
| Discrete Ethernet Magnetic Transformers | |||
| Integrated Connector-Magnetics (ICM) | |||
| By Mounting Type | Through-Hole (THT) | ||
| Surface-Mount (SMT) | |||
| By Data-Rate Class | less than or equal to 1 Gbps | ||
| 2.5 G/5 G | |||
| 10 Gbps | |||
| 25 G/40 G | |||
| 100 G and Above | |||
| By End-user Industry | Telecommunications Equipment | ||
| Hyperscale and Enterprise Data Centers | |||
| Industrial Automation and IIoT | |||
| Automotive and Transportation | |||
| Consumer Electronics | |||
| Aerospace and Defense | |||
| By Geography | North America | United States | |
| Canada | |||
| Mexico | |||
| Europe | Germany | ||
| United Kingdom | |||
| France | |||
| Russia | |||
| Rest of Europe | |||
| Asia-Pacific | China | ||
| Japan | |||
| India | |||
| South Korea | |||
| Australia | |||
| Rest of Asia-Pacific | |||
| Middle East and Africa | Middle East | Saudi Arabia | |
| United Arab Emirates | |||
| Rest of Middle East | |||
| Africa | South Africa | ||
| Egypt | |||
| Rest of Africa | |||
| South America | Brazil | ||
| Argentina | |||
| Rest of South America | |||


Key Questions Answered in the Report
What is the projected value of the Ethernet connector and transformer market in 2030?
The market is forecast to reach USD 1.89 billion by 2030.
Which region holds the largest share of global demand?
Asia-Pacific leads with 41.23% revenue share in 2024.
Which segment shows the fastest growth rate?
Integrated Connector-Magnetics modules register an 11.23% CAGR through 2030.
Why are automotive applications expanding rapidly?
Automakers are shifting to zonal Ethernet backbones that require rugged, high-speed connectors, driving a 9.67% CAGR.
How are supply constraints affecting the market?
Limited availability of high-frequency ferrite cores extends lead times and causes price volatility that restrains near-term growth.
What impact does PoE++ adoption have on connector design?
PoE++ mandates 100 W power delivery, accelerating demand for connectors that integrate isolation magnetics and manage higher thermal loads.
Page last updated on:


