Power Over Ethernet (PoE) Chipset Market Size and Share
Market Overview
| Study Period | 2019 - 2030 |
|---|---|
| Market Size (2026) | USD 756.21 Million |
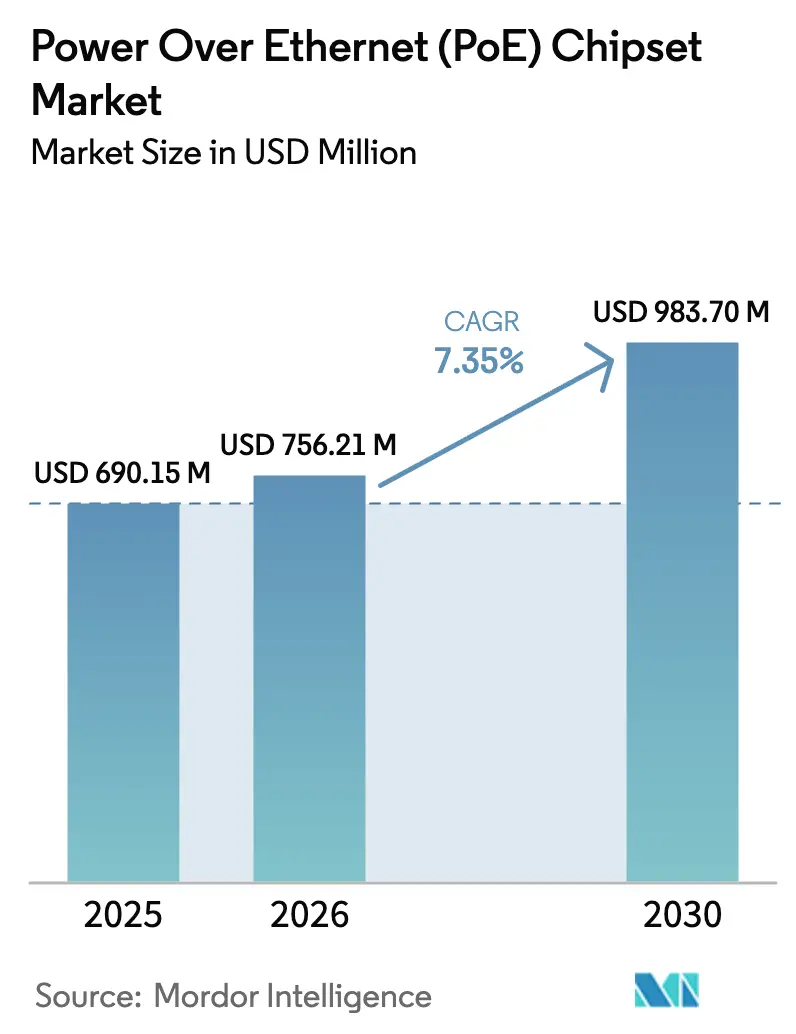
| Market Size (2030) | USD 983.70 Million |
| Growth Rate (2025 - 2030) | 7.35% CAGR |
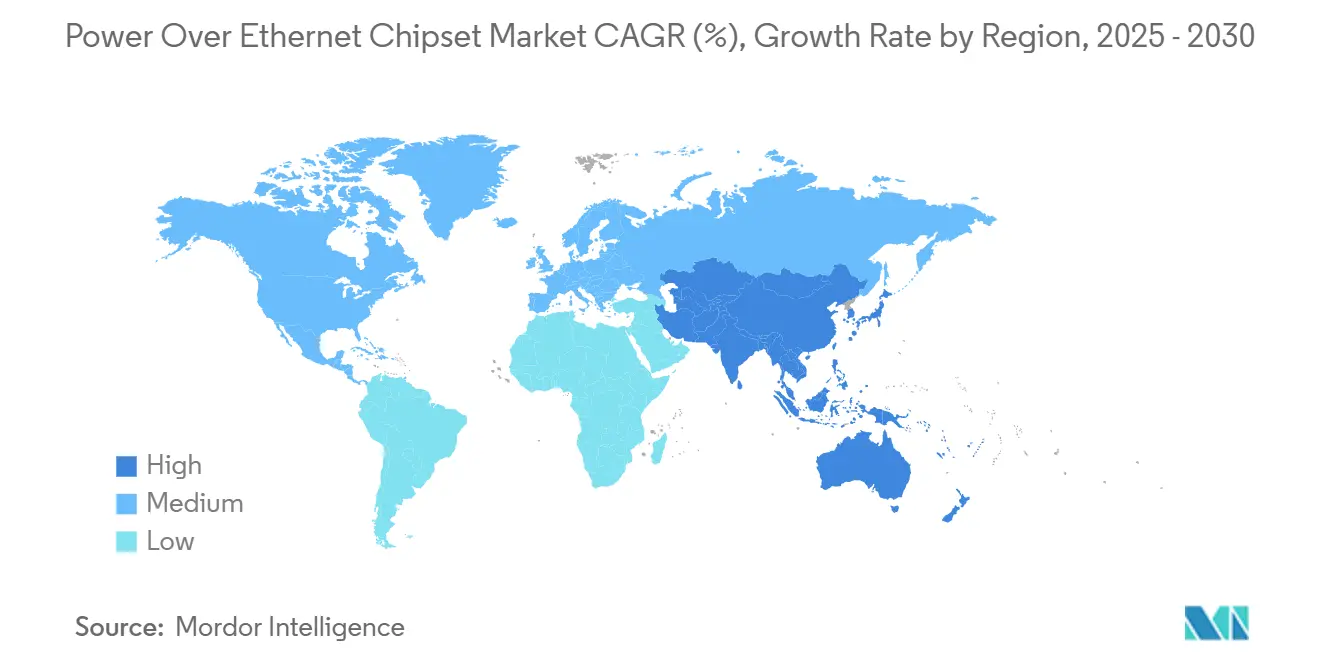
| Fastest Growing Market | Asia Pacific |
| Largest Market | North America |
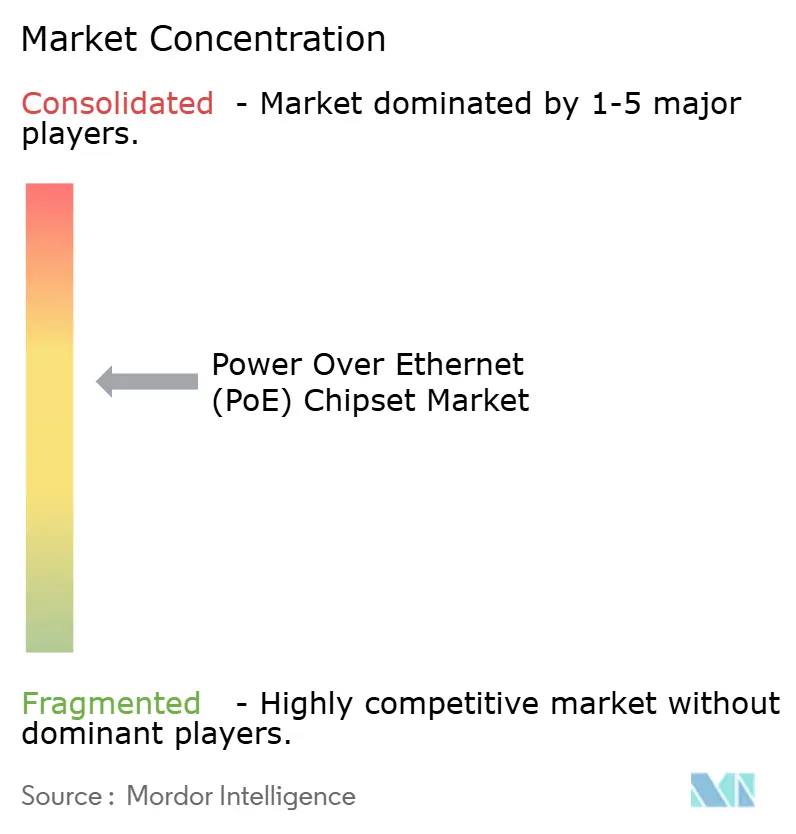
| Market Concentration | Medium |
Major Players *Disclaimer: Major Players sorted in no particular order Image © Mordor Intelligence. Reuse requires attribution under CC BY 4.0. | |
Power Over Ethernet (PoE) Chipset Market Analysis by Mordor Intelligence
The Power Over Ethernet Chipset Market size was valued at USD 690.15 million in 2025 and is estimated to grow from USD 756.21 million in 2026 to reach USD 983.70 million by 2030, at a CAGR of 7.35% during the forecast period (2026-2030). Rising demand for converged power-and-data networks in smart buildings, industrial automation, and IoT ecosystems underpins expansion. Higher-power IEEE 802.3bt deployments are widening the addressable application set to digital signage, LED lighting, and edge AI cameras. Domestic manufacturing incentives in the United States are tempering average selling prices while improving supply resiliency, and Asia-Pacific’s smart-city investments are accelerating regional uptake. Competitive focus is shifting toward mixed-signal efficiency, thermal performance, and advanced power-negotiation firmware to overcome heat-dissipation limits above 60 W.
Key Report Takeaways
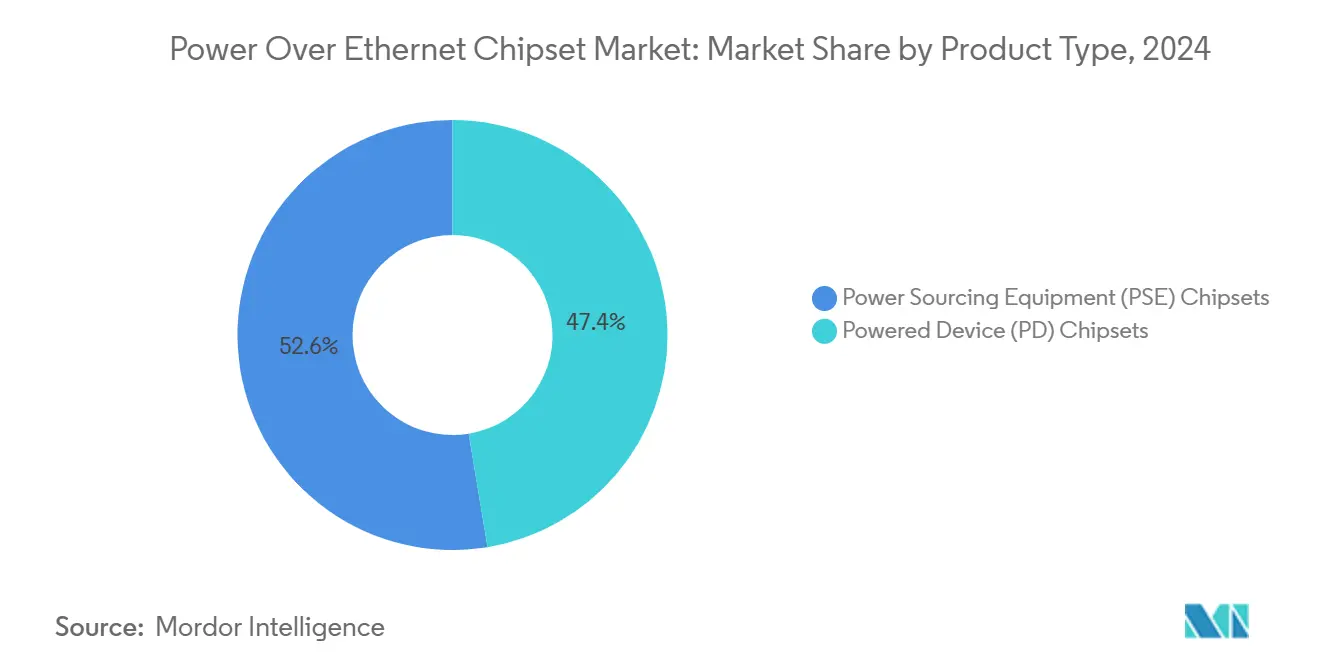
- By product type, Power Sourcing Equipment chipsets led with 52.6% of Power over Ethernet chipset market share in 2024; Powered Device chipsets record the fastest 13.8% CAGR through 2030.
- By standard, IEEE 802.3at commanded 46.2% of the Power over Ethernet chipset market size in 2024, while IEEE 802.3bt expands at 18.8% CAGR to 2030.
- By device type, IP/network cameras captured 38.4% Power over Ethernet chipset market share in 2024; LED/PoE lighting accelerates at 20.3% CAGR.
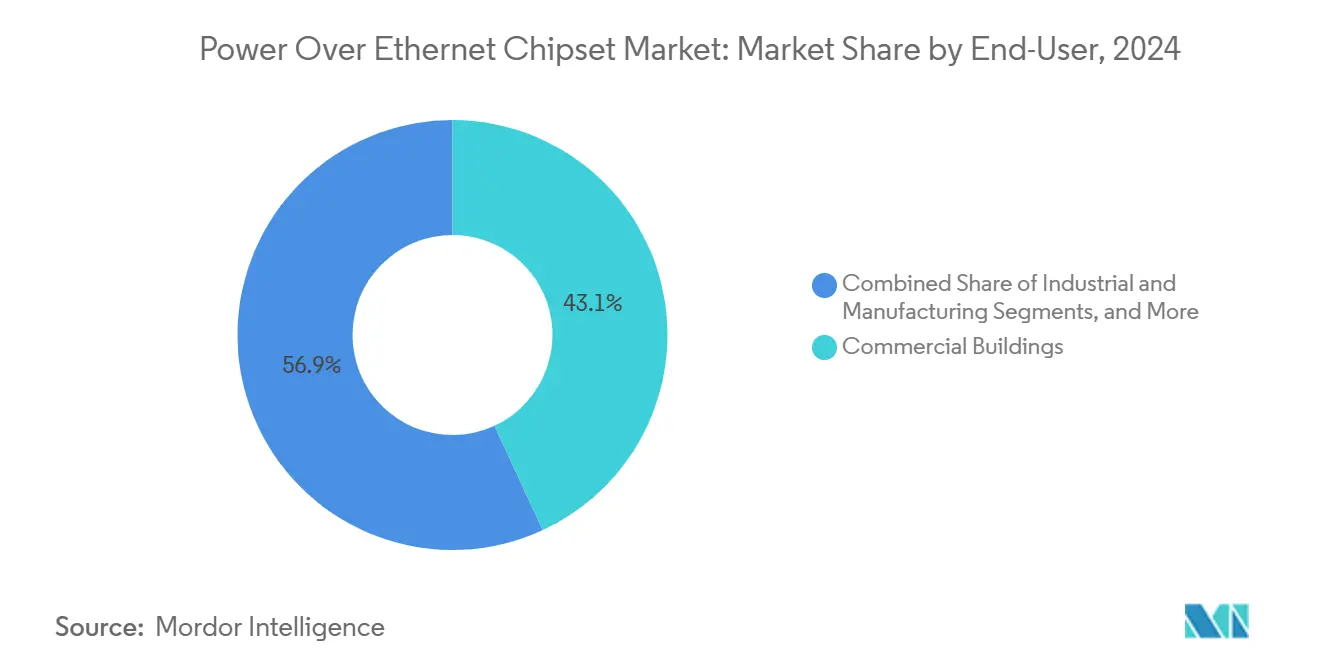
- By end-user, commercial buildings held 43.1% share of the Power over Ethernet chipset market size in 2024, with data centers advancing at 15.2% CAGR.
- By power class, the 15.5-30 W segment accounted for a 44.5% share in 2024, while the 60-100 W class recorded the highest 19.4% CAGR.
- By geography, North America led with a 37.8% share in 2024; Asia-Pacific posts a 15.9% CAGR through 2030.
Note: Market size and forecast figures in this report are generated using Mordor Intelligence’s proprietary estimation framework, updated with the latest available data and insights as of January 2026.
Global Power Over Ethernet (PoE) Chipset Market Trends and Insights
Drivers Impact Analysis*
| Driver | (~) % Impact on CAGR Forecast | Geographic Relevance | Impact Timeline |
|---|---|---|---|
| Smart-building infrastructure deployment | +2.6% | North America, Europe, urban Asia-Pacific | Medium term (2-4 years) |
| IoT-enabled IP surveillance expansion | +1.8% | China, North America, global | Short term (≤ 2 years) |
| IEEE 802.3bt adoption for high-power endpoints | +1.5% | North America, Europe | Medium term (2-4 years) |
| Industrial Ethernet growth in automation | +1.1% | Europe, North America, East Asia | Medium term (2-4 years) |
| Automotive Single-Pair Ethernet with PoDL rollout | +0.7% | Europe, East Asia, North America | Long term (≥ 4 years) |
| US CHIPS Act capacity additions lowering chipset ASPs | +0.4% | North America with global spill-over | Medium term (2-4 years) |
| Source: Mordor Intelligence | |||
Growing Deployment of Smart Building Infrastructure
PoE is becoming the nervous system of connected buildings, with 60% of the roughly 2,500 devices per 100,000 ft² in modern offices powered through Ethernet cabling.[1]Cisco Systems, “What Is a Smart Building?,” cisco.com Up-scaling from 15 W to 90 W standards expands support from IP phones to monitors and USB-C laptop docks. Facility managers benefit from centralized power budgeting and faster moves-adds-changes, while semiconductor vendors respond with controllers that integrate dynamic power allocation, port-level metering, and fault logging.
Expansion of IoT-Enabled IP Surveillance Networks
Network cameras already account for 38.4% of PoE endpoints. Higher-resolution sensors, edge analytics, and PTZ functions push demand toward IEEE 802.3bt chipsets that supply up to 90 W alongside gigabit data rates. With 65% of new security installs embedding edge AI, reliable power negotiation, and graceful-shutdown firmware become procurement priorities.
Rapid Adoption of IEEE 802.3bt for High-Power Endpoints
The 2018 ratification of IEEE 802.3bt introduced Type 3 and Type 4 classes at 60 W and 90 W, respectively, enabling applications such as digital signage and PoE lighting. Autoclass allows endpoints to report actual draw, enhancing switch-side utilization and reducing stranded capacity. Chipsets now bundle high-efficiency DC-DC converters that maintain 95% conversion efficiency while respecting thermal budgets.
Surging Demand for Industrial Ethernet in Automation
Manufacturing sites adopt ruggedized PoE switches rated –40 °C to +85 °C and conformal-coated electronics to power sensors and gateways without installing extra mains circuits. Integration with Time-Sensitive Networking assures synchronized motion control, and chipset makers embed IEEE 802.1AS-compliant timestamping alongside higher surge immunity.
Restraints Impact Analysis*
| Restraint | (~) % Impact on CAGR Forecast | Geographic Relevance | Impact Timeline |
|---|---|---|---|
| Heat-dissipation and cable-bundle temperature > 60 W | –1.1% | Global, more acute in hot climates | Short term (≤ 2 years) |
| Multi-vendor interoperability gaps | –0.7% | Global | Medium term (2-4 years) |
| Copper-price volatility elevating TCO | –0.4% | Global, higher impact in developing regions | Short term (≤ 2 years) |
| Shortage of mixed-signal PoE design talent | –0.4% | North America, Europe | Medium term (2-4 years) |
| Source: Mordor Intelligence | |||
Heat-Dissipation and Cable-Bundle Temperature Limits Above 60 W
Testing on 100-cable bundles shows temperature rises of 10 °C at full IEEE 802.3bt power over Category 5e. Enterprise installers, therefore, shift to Category 6A and tighter derating, adding cost. Silicon vendors counter with 95%-efficient converters and adaptive port power throttling to avoid over-temperature trips, yet the physical limits of copper remain.
Inter-Operability Gaps Across Multi-Vendor Implementations
Up to 30% of cross-brand connections suffer reduced power or missing management features despite apparent compliance. The Ethernet Alliance certification scheme is gaining traction, but enterprise buyers still schedule exhaustive bench tests, elongating deployment cycles. Chipset firms that supply comprehensive reference designs and in-house conformance reports gain procurement preference.
*Our forecasts treat driver/restraint impacts as directional, not additive. The impact forecasts reflect baseline growth, mix effects, and variable interactions.
Segment Analysis
By Product Type: PSE Chipsets Drive Infrastructure Expansion
PSE controllers generated 52.6% of the Power over Ethernet chipset market revenue in 2024. Flagship eight-port Type 4 devices, such as Texas Instruments’ TPS23881B, consolidate DC-DC conversion, detection, and eight programmable current limits into a single mixed-signal die, trimming board space and BOM cost.[2]Texas Instruments, “Power Sourcing Equipment Overview,” ti.com Higher power density demands sophisticated thermal fold-back algorithms, prompting vendors to integrate real-time temperature telemetry accessible over I²C. Commercial and industrial switches remain the core outlet, but growth also stems from mid-spans retrofitted into legacy racks.
Powered Device controllers trail in share yet accelerate at 13.8% CAGR through 2030 as every incremental endpoint—wireless access point, IoT gateway, e-paper sign—adds embedded PoE. Silicon Labs compresses switching FETs, synchronous rectification, and low-IQ regulators into miniature QFN packages, cutting module footprints for slimline cameras. IEC 62368-1 safety pre-certification speeds OEM time-to-market and magnifies adoption in consumer-proximate devices.


By Standard: IEEE 802.3bt Enables Power-Hungry Applications
IEEE 802.3at maintained a 46.2% share in 2024, supported by broad compatibility with existing cabling plant and sufficiency for mainstream VoIP, WLAN, and HD camera loads. Mature silicon economies of scale keep port costs low, ensuring continued volume.
IEEE 802.3bt advances at an 18.8% CAGR and positions the Power over Ethernet chipset market size for higher-wattage use cases such as 4K signage, mini desktops, and ceiling-mounted LiDAR scanners. Autoclass messaging and four-pair energization motivate switch OEMs to transition entire product lines. Silicon roadmaps add multi-phase isolated fly-back stages and synchronous rectification that cap insertion loss, which alleviates rising thermal constraints.
By Device Type: IP Cameras Lead While Lighting Accelerates
IP cameras held 38.4% of segment revenue in 2024 and continue migrating to edge AI architectures. Local inference reduces backend bandwidth but raises board-level power envelopes to 40 W and beyond, pushing demand for robust Type 4 PD silicon with integrated e-Fuse protection.
LED lighting, though smaller today, races ahead at 20.3% CAGR. Case studies have demonstrated an 86% reduction in building energy after converting fluorescent fixtures to addressable PoE luminaires. Fixture makers bundle daylight sensors and Bluetooth beacons powered over the same cable, increasing semiconductor content per socket.
By End-User: Commercial Buildings Dominate, Data Centers Surge
Commercial real-estate portfolios account for 43.1% of 2024 demand, leveraging PoE to converge HVAC, access control, surveillance, and lighting on a unified network. Retrofits gain added momentum as property managers prioritize ESG scorecards and tenant experience metrics.
Data centers and edge points of presence expand at a 15.2% CAGR. Operators deploy PoE for access control, environmental sensing, and micro data halls that support latency-sensitive workloads in retail locations. Reliability requirements translate into redundant PSE silicon with hitless fail-over and cycle-by-cycle current limiting.
By Power Class: Class 4 Leads, Higher Classes Accelerate
Class 4 (15.5-30 W) devices held a 44.5% share in 2024, sustaining the majority of WLAN and mid-tier camera installs. Optimized silicon in this band now offers sub-100 mW no-load losses and peak 97% efficient synchronous rectification.
Classes 7-8 (60-100 W) scale at 19.4% CAGR, enabled by improved four-pair magnetics and thermally-rated patch cords. Vendors differentiate via digital power-management engines that dynamically re-allocate unused budget across ports and implement pre-emptive thermal-foldback to comply with building-code bundle-temperature ceilings.
Geography Analysis
North America accounted for 37.8% of 2024 sales. Early IEEE 802.3bt adoption and proactive energy-efficiency retrofits support volume, while the CHIPS Act injects USD 162 million into domestic PoE silicon fabrication that tempers lead times and ASP volatility.[3]Morrison and Foerster, “Early Impact of the CHIPS Act,” mofo.com
Asia-Pacific is the fastest-growing region at 15.9% CAGR through 2030. China’s discrete-manufacturing makeover relies on ruggedized PoE switches to power sensor clusters on moving gantries, cutting re-wiring downtime during line reconfiguration. Automotive OEMs in Japan adopt Single-Pair Ethernet with PoDL to cut harness weight and enable over-the-air firmware streams to domain controllers.
Europe secures a significant share anchored by Germany’s Industry 4.0 programs. Regulations that push for near-zero-energy buildings prompt the adoption of PoE-driven smart-lighting and air-quality sensors. The United Kingdom accelerates retrofits of heritage properties, leveraging mid-span injectors to avoid disruptive electrical rework, while French municipalities pilot PoE-powered street furniture that integrates Wi-Fi and CCTV.

Competitive Landscape
Market concentration is moderate. Texas Instruments, Analog Devices, and Microchip Technology hold multi-generation portfolios that span PSE and PD controllers. Continuous integration of MOSFETs, current-sense amplifiers, and thermal diodes compresses board footprint and enhances efficiency. Silicon Labs, Kinetic Technologies, and Asian challengers target OEMs seeking compact, cost-sensitive solutions for high-volume IoT nodes.
Strategic moves in 2025 include Texas Instruments’ release of the LM7468x ideal-diode bridge controller optimized for 48 V PoE rails, trimming forward losses, and board size. Würth Elektronik published a reference design for Single-Pair Ethernet with PoDL to accelerate adoption in industrial and automotive networks.[4]Würth Elektronik, “Design of a Single Pair Ethernet System with Power over Data Lines,” we-online.com Vendors increasingly bundle PoE with other connectivity blocks such as Wi-Fi 6 or CAN-FD to deliver platform-level value and defend margins against commoditization.
White-space opportunities revolve around high-voltage automotive PoDL, conformal-coated industrial PSE modules, and millimeter-footprint PD ASICs for wearables and smart tags. Suppliers capable of delivering reference designs that address heat, EMC, and system-level safety abbreviate OEM design cycles and earn design-win premiums.
Power Over Ethernet (PoE) Chipset Industry Leaders
Texas Instruments Incorporated
Analog Devices Inc.
Microchip Technology Inc.
Broadcom Inc.
STMicroelectronics N.V.
- *Disclaimer: Major Players sorted in no particular order

Recent Industry Developments
- May 2025: Ikan Corporation launched the LBX10-POE broadcast-studio lighting system, cutting installation cost by 35% while achieving 92-94% power-conversion efficiency.
- March 2025: Infineon Technologies AG became the global microcontroller leader with a 21.3% share, showcasing PSOC families that integrate PoE-ready power management.
- March 2025: Planet Technology USA debuted the NMS-AIoT Application Server, which orchestrates thousands of PoE devices and holds IEC 62443 certification.
- March 2025: Amphenol Connect released Magnetic Jack and SPE connectors tailored to rugged PoE edge-computing enclosures.


Research Methodology Framework and Report Scope
Market Definitions and Key Coverage
Our study defines the Power over Ethernet (PoE) chipset market as the global value generated from integrated circuits that combine data switching and low-voltage power delivery functions compliant with IEEE 802.3af/at/bt standards inside network switches, mid-span injectors, and powered devices such as IP cameras and wireless access points. According to Mordor Intelligence, this market reached USD 690.15 million in 2025 and is forecast through 2030.
Scope exclusion: assemblies like complete PoE switches, extenders, cabling, and lighting fixtures are outside the present valuation.
Segmentation Overview
- By Product Type
- Power Sourcing Equipment (PSE) Chipsets
- Powered Device (PD) Chipsets
- By Standard
- IEEE 802.3af
- IEEE 802.3at (PoE+)
- IEEE 802.3bt (PoE++)
- IEEE 802.3cg/PoDL (Single-Pair Ethernet)
- By Device Type
- IP/Network Cameras
- VoIP Phones and UC End-points
- Wireless Access Points
- LED/PoE Lighting Luminaires
- POS and Kiosk Terminals
- Others (Sensors, Thin Clients, etc.)
- By End-user
- Commercial Buildings
- Industrial and Manufacturing
- Healthcare Facilities
- Retail and Hospitality
- Residential / Smart Homes
- Data Centres and Edge POPs
- By Power Class
- ≤15.4 W (Class 0-3)
- 15.5–30 W (Class 4)
- 30–60 W (Class 5-6)
- 60–100 W (Class 7-8)
- By Geography
- North America
- United States
- Canada
- South America
- Brazil
- Argentina
- Rest of South America
- Europe
- Germany
- United Kingdom
- France
- Italy
- Russia
- Rest of Europe
- Asia-Pacific
- China
- Japan
- South Korea
- India
- Rest of Asia-Pacific
- Middle East and Africa
- Middle East
- GCC
- Rest of Middle East
- Africa
- South Africa
- Rest of Africa
- Middle East
- North America
Detailed Research Methodology and Data Validation
Primary Research
Mordor analysts conducted structured interviews with analog IC design engineers, PoE controller product managers, and low-voltage systems integrators across North America, Europe, and Asia-Pacific. These conversations verified port-level power class migration, typical chipset bill-of-materials, and future procurement intentions that secondary data could not capture.
Desk Research
We start with desk research that mines freely available tier-1 references such as IEEE standard drafts, US International Trade Commission HS-code shipment data, the World Semiconductor Trade Statistics bulletin, and statistics from the PoE Consortium. Company 10-Ks, investor decks, and quarterly earning transcripts complement these sources by revealing chipset average selling prices and design-win counts. Proprietary libraries within D&B Hoovers and Dow Jones Factiva help our analysts capture revenue splits and patent momentum for leading suppliers. These inputs anchor the historical demand baseline and reveal adoption inflection points.
Additional direction comes from building-automation associations, regional smart-city white papers, and peer-reviewed power-management journals, which trace deployment densities in commercial real estate and industrial automation. The sources mentioned illustrate our approach and are not exhaustive; many more were consulted for cross-checks and clarifications.
Market-Sizing & Forecasting
We construct an initial top-down model that recreates global PoE-enabled Ethernet port shipments from trade statistics and vendor unit disclosures, which are then multiplied by verified chipset attach rates and weighted ASPs. Select bottom-up approximations, supplier revenue roll-ups and channel checks, validate and fine-tune totals. Key variables include new commercial floor space fitted with smart lighting, shipment curves of IP surveillance cameras, IEEE 802.3bt penetration, and regional data-center rack additions. A multivariate regression projects each driver to 2030, after which scenario analysis tests high-power adoption sensitivity. Gaps in bottom-up coverage are bridged by triangulating three-year moving averages and expert ranges.
Data Validation & Update Cycle
Our model undergoes variance checks against WSTS semiconductor billings and customs values. Senior reviewers investigate anomalies before sign-off. Reports refresh annually, while material events, standard upgrades or tariff shifts, trigger interim amendments, ensuring clients receive the latest view.
Why Mordor's Power Over Ethernet Chipset Baseline Deserves Boardroom Confidence
Published estimates often diverge because firms choose different component scopes, currency years, and refresh rhythms. We acknowledge these factors up front so decision-makers can judge fit.
Key gap drivers include whether passive magnetics or full PoE switches are folded into revenue, how aggressively high-power classes are assumed to ramp, and the cadence at which analyst teams revisit price erosion. Mordor's disciplined scope, annual refresh, and attach-rate auditing keep our figures grounded.
Benchmark comparison
| Market Size | Anonymized source | Primary gap driver |
|---|---|---|
| USD 690.15 mn (2025) | Mordor Intelligence | - |
| USD 659.1 mn (2024) | Regional Consultancy A | Excludes emerging single-pair PoE standards and Asia-Pacific channel checks |
| USD 1.51 bn (2024) | Global Consultancy B | Bundles complete PoE switches, mid-spans, and cabling alongside chipsets |
| USD 1.20 bn (2024) | Industry Journal C | Uses uniform ASP decline across all power classes and lacks primary validation |
The comparison shows that wide swings stem mainly from scope stretch or untested assumptions, whereas Mordor's numbers flow from transparent variables, balanced cross-validation, and a repeatable update cadence that users can trust.


Key Questions Answered in the Report
What is driving the recent growth of the Power over Ethernet chipset market?
Rising adoption in smart buildings, high-power IEEE 802.3bt deployments for devices like LED lighting and AI cameras, and regional manufacturing incentives are key drivers supporting a 7.35% CAGR to 2030.
Which chipset type currently generates the most revenue?
Power Sourcing Equipment controllers dominate with a 52.6% share in 2024 because they reside in switches and mid-spans that anchor every PoE network.
How does IEEE 802.3bt differ from earlier PoE standards?
IEEE 802.3bt energizes all four cable pairs to supply up to 90 W, introduces autoclass power reporting, and enables applications such as digital signage and high-end PTZ cameras.
Why are thermal constraints an issue for high-power PoE?
Bundles carrying 60 W or more can heat by 10 °C, risking performance degradation; solutions include Category 6A cabling and higher-efficiency conversion silicon.
Which region will expand fastest through 2030?
Asia-Pacific is projected to grow at 15.9% CAGR, propelled by industrial automation and smart-city initiatives in China, Japan, and India.
What new opportunities are emerging beyond traditional enterprise networks?
Automotive Single-Pair Ethernet with PoDL, ruggedized industrial switches, and broadcast-studio lighting are creating fresh demand for specialized PoE chipsets.
How large is the Power Over Ethernet (PoE) Chipset market in 2026?
The Power Over Ethernet Chipset Market size was valued at USD 690.15 million in 2025 and is estimated to grow from USD 756.21 million in 2026 to reach USD 983.70 million by 2030, at a CAGR of 7.35% during the forecast period (2026-2030).
Page last updated on:


