Positive Material Identification Market Size and Share
Market Overview
| Study Period | 2019 - 2030 |
|---|---|
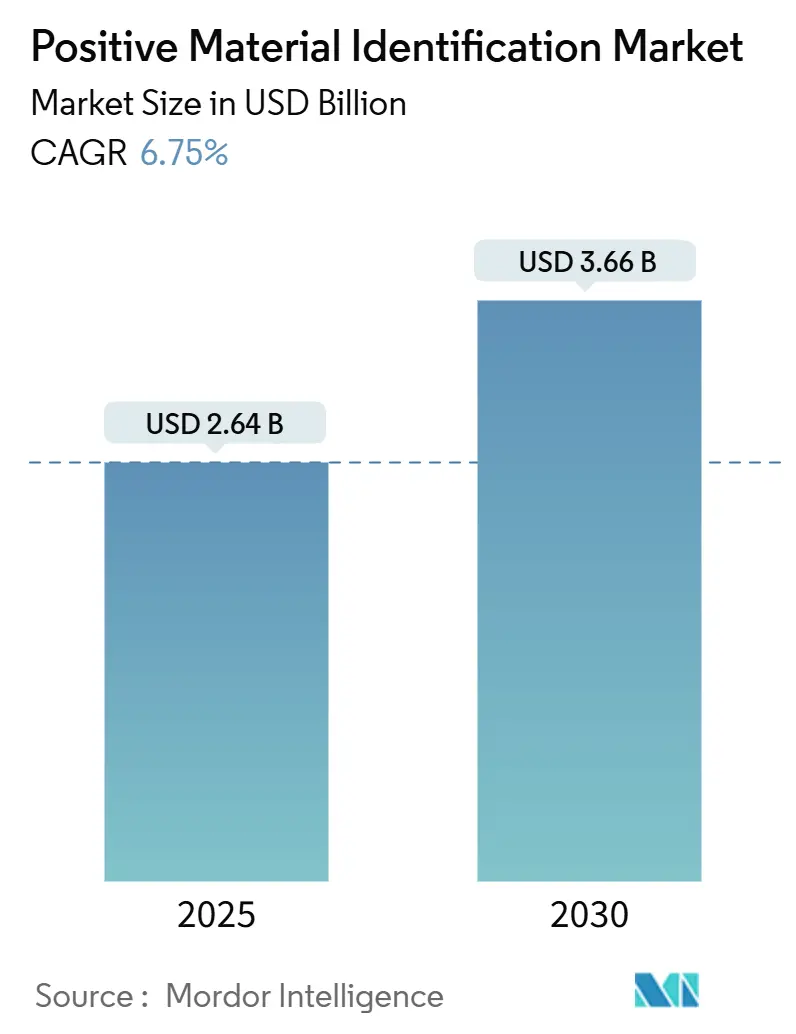
| Market Size (2025) | USD 2.64 Billion |
| Market Size (2030) | USD 3.66 Billion |
| Growth Rate (2025 - 2030) | 6.75% CAGR |
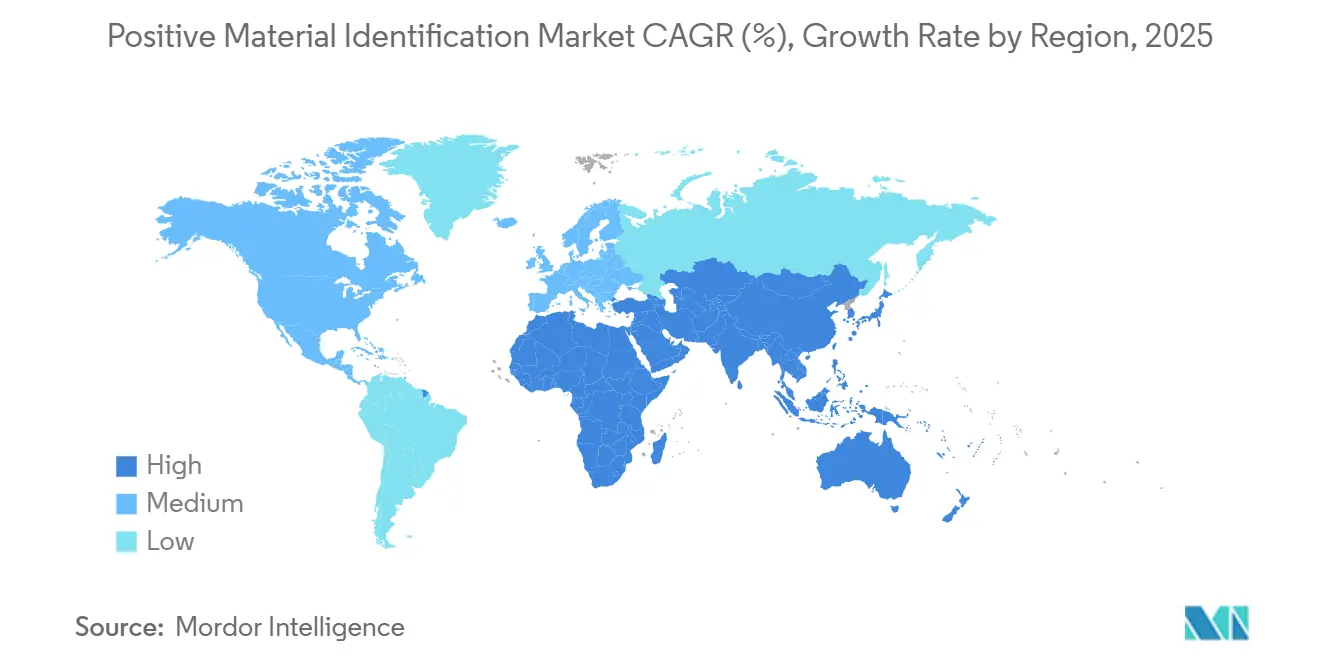
| Fastest Growing Market | Asia Pacific |
| Largest Market | North America |
| Market Concentration | Medium |
Major Players *Disclaimer: Major Players sorted in no particular order Image © Mordor Intelligence. Reuse requires attribution under CC BY 4.0. | |
Positive Material Identification Market Analysis by Mordor Intelligence
The Positive Material Identification market size reached USD 2.64 billion in 2025 and is projected to achieve USD 3.66 billion by 2030, advancing at a 6.75% CAGR. Rising regulatory scrutiny, particularly around refinery turnarounds and pipeline replacement programs, underpins this expansion while preventing costly alloy mix-ups that can lead to multimillion-dollar downtime events. The Positive Material Identification market is further buoyed by faster adoption of handheld laser-induced breakdown spectroscopy (LIBS) that improves light-element detection, by the migration of inspection budgets toward comprehensive service contracts, and by escalating demand from circular economy initiatives requiring precise alloy sorting. Competitive intensity is increasing as LIBS cost deflation challenges the long-standing dominance of x-ray fluorescence (XRF) platforms, with cloud-connected databases and artificial intelligence (AI) providing near-instant alloy matching in the field. North America remains the largest regional buyer owing to federally mandated pipeline safety upgrades, yet Asia-Pacific shows the most rapid acceleration on the back of India’s steel capacity build-out and China’s scrap-processing appetite.
Key Report Takeaways
- By technique, XRF led with 60.47% of the Positive Material Identification market share in 2024 while LIBS is projected to expand at a 7.84% CAGR to 2030.
- By form factor, handheld devices accounted for 71.86% share of the Positive Material Identification market size in 2024 and are advancing at an 8.12% CAGR through 2030.
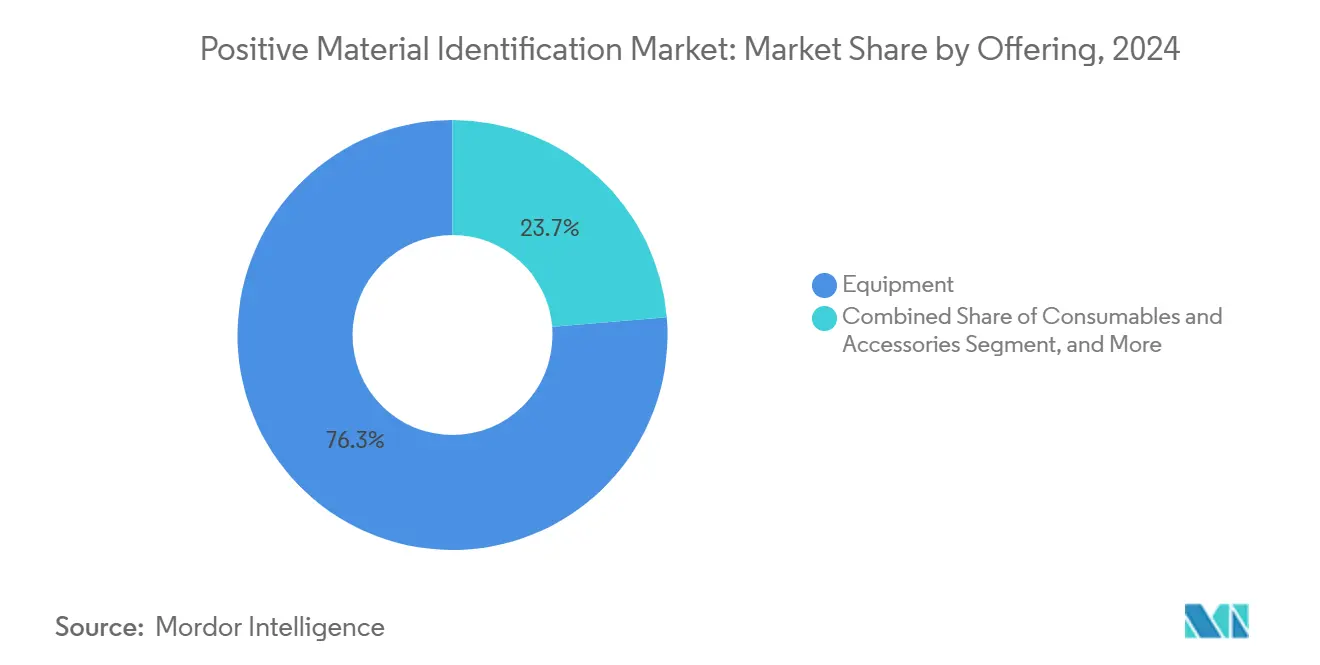
- By offering, equipment held 76.32% revenue share in 2024 whereas services represent the fastest growth at 8.32% CAGR to 2030.
- By end-user, oil and gas commanded 27.39% share of the Positive Material Identification market size in 2024 but scrap and recycling is set to grow at a 6.92% CAGR to 2030.
- By geography, North America captured 35.32% Positive Material Identification market share in 2024 and Asia-Pacific is registering 7.21% CAGR through 2030.
Global Positive Material Identification Market Trends and Insights
Drivers Impact Analysis*
| Driver | (~) % Impact on CAGR Forecast | Geographic Relevance | Impact Timeline |
|---|---|---|---|
| Escalating alloy verification mandates in refinery turn-arounds | +1.2% | North America and Europe, expanding to MEA | Medium term (2-4 years) |
| Rising global pipeline replacement programmes | +1.8% | Global, with concentration in North America | Long term (≥ 4 years) |
| Shift from wet chemistry to portable spectrometry | +0.9% | Global | Short term (≤ 2 years) |
| Cost deflation of handheld LIBS devices | +1.1% | Asia-Pacific core, spill-over to global markets | Medium term (2-4 years) |
| Demand for scrap sorting in circular metals economy | +0.8% | Global, led by Europe and China | Long term (≥ 4 years) |
| AI-enabled real-time elemental matching on cloud databases | +0.7% | Global, early adoption in developed markets | Short term (≤ 2 years) |
| Source: Mordor Intelligence | |||
Escalating alloy verification mandates in refinery turn-arounds
American Petroleum Institute Recommended Practice 578 now obliges 100% Positive Material Identification verification during refinery shutdowns. Plants routinely deploy handheld XRF that measures silicon below 0.1% to mitigate sulfidation corrosion, which forensic reviews identified in one-third of historic failures. Operators treat PMI spend as risk insurance because each unplanned outage can erase USD 50 million to USD 100 million in earnings. The imperative has shifted PMI from discretionary quality control to a line-item compliance cost that extends across maintenance budgets. Rapid turnaround windows favor handheld devices capable of thousands of readings per shift, reinforcing demand for portable platforms with instant pass/fail outputs.
Rising global pipeline replacement programs
The United States alone manages more than 300,000 miles of natural-gas transmission lines subject to the PHMSA 192 Mega Rule that requires retroactive material traceability and in-situ Positive Material Identification testing. Canadian regulators updated CSA Z662:23 to include hydrogen readiness, further widening the scope of alloy verification across future energy networks. State-level cast-iron replacement has eliminated legacy materials in 24 jurisdictions, creating continuous inspection need as new steel and plastic lines come online. Long-duration infrastructure budgets lock in a pipeline of PMI projects that extend through the decade, stabilizing equipment sales and catalyzing multi-year service contracts.
Shift from wet chemistry to portable spectrometry
Laboratory wet chemistry once dominated alloy confirmation but turnaround pressure, offshore logistics costs, and the need for real-time weld qualification have moved decisions onto the plant floor. Modern handheld XRF delivers laboratory-grade results without sample prep and without the helicopter charter once required to ferry coupons from rigs to shore. LIBS adds carbon and lithium detection so welding engineers can confirm carbon equivalency on the spot. The time savings translate into shorter shutdowns and higher asset availability, reinforcing the value proposition of portable Positive Material Identification solutions.
Cost deflation of handheld LIBS devices
Volume manufacturing and diode-laser miniaturization have cut average unit prices, narrowing the LIBS-to-XRF price gap from 2:1 to roughly 1.3:1. Vendors eliminate radiation permitting costs while offering 1-3 second analysis cycles, making LIBS attractive for light-element work and speedy sorting. [1]Thermo Fisher Scientific, “Handheld XRF Evolution,” thermofisher.com Lower acquisition outlays open new customer tiers in emerging economies, while simplified safety requirements reduce onboarding time. Service providers gain a competitive edge by deploying mixed fleets that match application needs, accelerating LIBS penetration across the Positive Material Identification market.
Restraints Impact Analysis*
| Restraint | (~) % Impact on CAGR Forecast | Geographic Relevance | Impact Timeline |
|---|---|---|---|
| Volatility in capital expenditure of oil and gas sector | -0.8% | Global, particularly North America and MEA | Medium term (2-4 years) |
| Technical limitations analysing light elements with XRF | -0.4% | Global | Long term (≥ 4 years) |
| Shortage of skilled PMI technicians in emerging markets | -0.6% | Asia-Pacific, MEA, Latin America | Long term (≥ 4 years) |
| Import-export restrictions on high-power laser sources | -0.5% | Global, concentrated in Asia-Pacific and MEA | Medium term (2-4 years) |
| Source: Mordor Intelligence | |||
Volatility in capital expenditure of oil and gas sector
Energy transition pressures cause refiners and pipeline operators to defer maintenance during low-margin cycles, compressing inspection demand into narrow windows that strain Positive Material Identification service capacity. Schedule volatility complicates workforce planning and can push daily technician rates higher. Geopolitical risks and ESG-driven capital realignment shift dollars toward renewables, limiting budget for traditional hydrocarbon infrastructure even as asset aging raises the technical need for verification. The mismatch between structural safety requirements and cyclical spending creates unpredictable order books for PMI vendors.
Shortage of skilled PMI technicians in emerging markets
Certification from the American Society for Nondestructive Testing demands mastery of metallurgy, radiation safety, and multi-technique competencies that take 12-18 months to acquire. [2]American Society for Nondestructive Testing, “ASNT-AWS Collaboration,” asnt.org Rapid industrialization has outpaced training capacity in India and the Gulf states, leading to project delays or the import of expatriate inspectors. New ASNT and AWS academies in Gujarat seek to close the gap yet language skills and local safety cultures remain obstacles. Without adequate staffing, end-users may under-utilize advanced PMI features, slowing adoption momentum in the fastest-growing regions.
*Our forecasts treat driver/restraint impacts as directional, not additive. The impact forecasts reflect baseline growth, mix effects, and variable interactions.
Segment Analysis
By Technique: LIBS disrupts XRF through light-element precision
XRF contributed 60.47% to the Positive Material Identification market share in 2024, a position earned through decades of installed base and a 500-grade alloy library. [3]Thermo Fisher Scientific, “Real-Time Analysis of Metals and Alloys,” thermofisher.com The Positive Material Identification market size represented by LIBS is forecast to rise at 7.84% CAGR to 2030 as the method uniquely measures carbon, lithium, and beryllium on the spot. Recent breakthroughs in plasma-grating technologies have tripled signal strength and doubled plasma lifetime, lifting accuracy for trace constituents.
Handheld LIBS enjoys Class 1 laser classification, limiting personal protective equipment to safety glasses and removing radiation exposure paperwork. AI-driven spectral algorithms now deliver 98.4% real-time identification accuracy, pushing LIBS toward mission-critical weld qualification and battery-recycling duties. OES remains a laboratory gold-standard for deep quantification, while Raman addresses molecular identification niches such as polymer liners. Competitive dynamics will hinge on hybrid devices that combine XRF’s heavy-element strength with LIBS’s light-element prowess, presenting end-users with multi-modal Positive Material Identification market options.


By Form Factor: Handheld devices dominate through operational flexibility
Handheld analyzers captured 71.86% of the Positive Material Identification market size in 2024 and are on course for an 8.12% CAGR through 2030. Eight-hour battery packs, IP54 enclosures, and sub-3 kg weight profiles enable technicians to complete hundreds of shots daily in confined spaces. Portable or benchtop units cater to high-precision laboratory tasks, whereas in-line systems underpin high-throughput scrap yards.
Form-factor innovation now includes GPS tagging, barcode integration, and cloud synchronization to meet traceability mandates. Inspection managers can geofence inspection points, attach photographic evidence, and stream data to enterprise asset-management systems, tightening compliance loops. These advances reinforce the central role of handhelds in the Positive Material Identification market while allowing fixed systems to serve volume-sorting applications.
By Offering: Services growth outpaces equipment sales
Equipment accounted for 76.32% of 2024 revenue, yet services will grow at 8.32% CAGR, reflecting a pivot toward cradle-to-grave inspection programs. Frequent calibration, alloy database updates, and operator training are bundled into multi-year contracts that guarantee performance standards and regulatory traceability.
Consumables such as calibration coupons and protective window film provide recurring margin streams. Testing laboratories leverage third-party accreditation to validate customer procedures, lowering liability exposure. In emerging economies where capex is constrained, service rental fleets make Positive Material Identification market adoption feasible, broadening the overall user base.
By End-User Industry: Oil and gas leadership challenged by scrap recycling growth
Oil and gas held 27.39% Positive Material Identification market share in 2024, anchored by stringent API standards that mandate alloy verification across refineries, pipelines, and petrochemical complexes. Inspection intensity ties directly to safety and environmental risk, keeping device utilization rates high.
Scrap and recycling, though a smaller base, is projected to achieve 6.92% CAGR as AI-enabled LIBS sorting reaches 95% aluminum-purity thresholds, unlocking higher resale value. Aerospace requires titanium conformity down to parts-per-million trace impurities, whereas power generation demands PMI in nuclear-grade piping. Metals and heavy machinery apply bulk alloy checks to thwart counterfeit parts, while pharmaceutical firms confirm stainless-steel compliance within good manufacturing practice protocols.
Geography Analysis
North America generated 35.32% of Positive Material Identification market revenue in 2024, driven by the PHMSA Mega Rule and by Dominion Energy’s USD 4 billion pipeline replacement in Ohio that alone necessitates tens of thousands of alloy checks. Established service networks and comprehensive technician training capacity further cement regional leadership. Canada’s hydrogen-ready CSA Z662:23 standard raises the alloy verification bar for next-generation energy corridors.
Asia-Pacific is forecast to post a 7.21% CAGR through 2030, supported by India’s 8.5% steel-production growth and China’s 35% share of global scrap consumption. Local skills shortages spur partnerships between equipment vendors and academic institutes, while government infrastructure outlays accelerate deployment of portable spectrometers at construction and shipbuilding sites. The Positive Material Identification market size in the region benefits from large-scale manufacturing clusters that integrate PMI checkpoints into quality-assurance loops.
Europe maintains momentum through circular-economy mandates that incentivize advanced alloy sorting. The HySort LIBS facility in Michigan illustrates transatlantic technology transfer, with similar plants slated for Norway and Germany that target post-consumer aluminum purity above 90%. Strict environmental directives propel steady adoption across recycling and automotive lightweighting. Meanwhile, Middle East and Africa see incremental demand from refining expansions, and South America leverages mining royalties to modernize metallurgical verification infrastructure.

Competitive Landscape
Global suppliers such as Thermo Fisher Scientific, Bruker, and Hitachi High-Tech span XRF, LIBS, and OES modalities, combining hardware breadth with deep application support. New entrants push cloud-connected LIBS units that embed machine-learning firmware and offer subscription-based alloy libraries. Partnerships between incumbents and laser-component specialists accelerate time-to-market for hybrid platforms that merge XRF and LIBS in a single chassis.
Mergers focus on geographic expansion and software capabilities. Bruker’s acquisition of Ridom extended reach into genomic diagnostics, signaling convergence of spectrometry and bioanalytics. Thermo Fisher’s robotic Vulcan Automated Lab addresses semiconductor metrology, highlighting cross-industry equipment synergies. Competitive pressure now centers on total cost of ownership and data-integration features rather than raw hardware performance, redefining buying criteria in the Positive Material Identification market.
White-space opportunities lie in predictive analytics that mine PMI datasets to forecast corrosion risk and optimize alloy selection for new builds. Vendors experimenting with blockchain-anchored material passports aim to provide cradle-to-grave traceability, adding a compliance premium that could reshape procurement practices across aerospace and energy verticals.
Positive Material Identification Industry Leaders
Thermo Fisher Scientific Inc.
Evident Corporation (Olympus Scientific Solutions)
Hitachi High-Tech Analytical Science Ltd.
Bruker Corporation
Rigaku Corporation
- *Disclaimer: Major Players sorted in no particular order

Recent Industry Developments
- June 2025: Bruker launched the LUMOS II ILIM quantum-cascade laser infrared microscope for pharmaceutical and life-science research.
- May 2025: Thermo Fisher Scientific introduced the Vulcan Automated Lab for semiconductor analysis, blending robotics with AI-enhanced transmission-electron microscopy.
- April 2025: Bruker invested in Ridom GmbH to expand next-generation sequencing applications for hospital hygiene testing.
- March 2025: Bruker released the timsMetabo mass spectrometer featuring TIMS Mobility Range Enhancement for 4D-metabolomics.


Global Positive Material Identification Market Report Scope
| X-ray Fluorescence (XRF) |
| Optical Emission Spectroscopy (OES) |
| Laser-Induced Breakdown Spectroscopy (LIBS) |
| Raman Spectroscopy |
| Handheld |
| Portable / Benchtop |
| Stationary / In-line |
| Equipment |
| Services (Testing and Calibration) |
| Consumables and Accessories |
| Oil and Gas |
| Aerospace and Defense |
| Metals and Heavy Machinery |
| Power Generation |
| Scrap and Recycling |
| Pharmaceutical and Life Sciences |
| Petrochemical and Refining |
| Other End-user Industries |
| North America |
| Europe |
| Asia-Pacific |
| South America |
| Middle East and Africa |
| By Technique | X-ray Fluorescence (XRF) |
| Optical Emission Spectroscopy (OES) | |
| Laser-Induced Breakdown Spectroscopy (LIBS) | |
| Raman Spectroscopy | |
| By Form Factor | Handheld |
| Portable / Benchtop | |
| Stationary / In-line | |
| By Offering | Equipment |
| Services (Testing and Calibration) | |
| Consumables and Accessories | |
| By End-user Industry | Oil and Gas |
| Aerospace and Defense | |
| Metals and Heavy Machinery | |
| Power Generation | |
| Scrap and Recycling | |
| Pharmaceutical and Life Sciences | |
| Petrochemical and Refining | |
| Other End-user Industries | |
| By Geography | North America |
| Europe | |
| Asia-Pacific | |
| South America | |
| Middle East and Africa |


Key Questions Answered in the Report
What is the current value of the Positive Material Identification market and its expected size by 2030
The market stood at USD 2.64 billion in 2025 and is projected to reach USD 3.66 billion by 2030 driven by a 6.75% CAGR
Which region is expanding fastest in PMI adoption
Asia-Pacific leads with a 7.21% CAGR supported by India’s steel expansion and China’s scrap-sorting demand
Why is LIBS gaining ground over XRF in PMI applications
LIBS offers rapid detection of light elements such as carbon and lithium without radiation constraints while device costs have fallen to near parity with XRF
How do regulatory mandates influence PMI spending in refineries
API RP 578 requires 100% alloy verification during turnarounds making PMI an essential compliance expense rather than discretionary quality control
Which end-user segment is expected to grow quickest through 2030
Scrap and recycling shows the strongest trajectory at 6.92% CAGR as AI-enabled LIBS sorting improves alloy purity for circular-economy goals
What factors limit PMI growth in emerging economies
A shortage of certified technicians and export controls on laser components slow adoption despite rising industrial activity
Page last updated on:


