POS Software Market Size and Share
Market Overview
| Study Period | 2020 - 2031 |
|---|---|
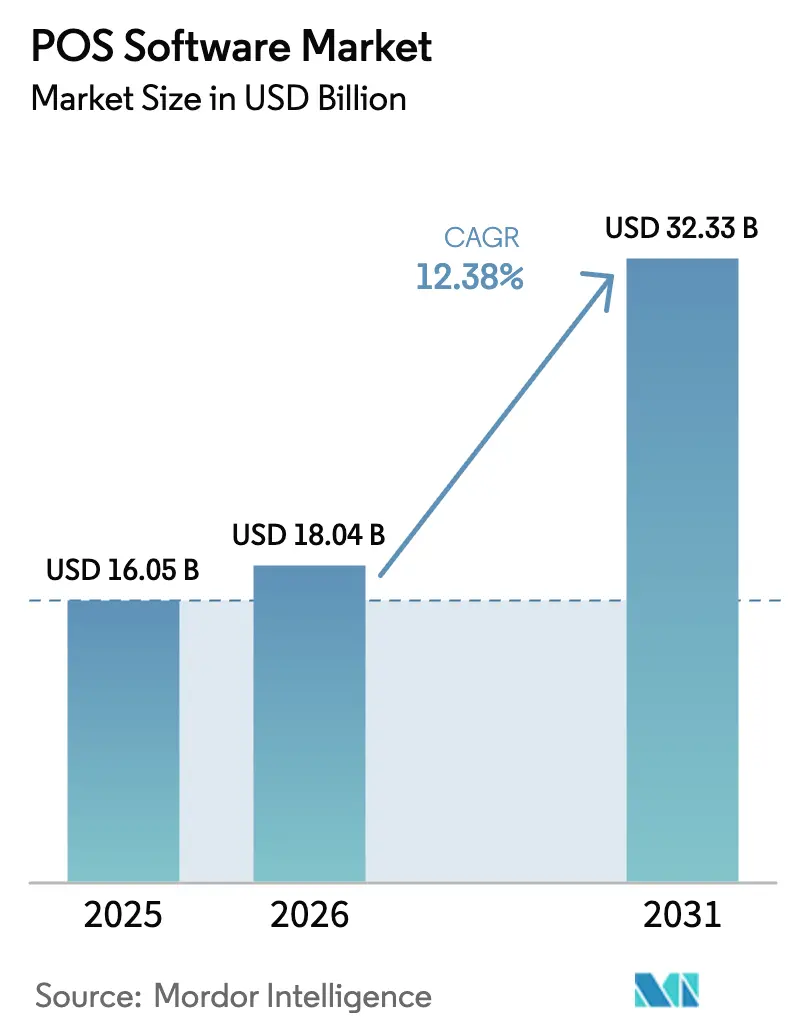
| Market Size (2026) | USD 18.04 Billion |
| Market Size (2031) | USD 32.33 Billion |
| Growth Rate (2026 - 2031) | 12.38% CAGR |
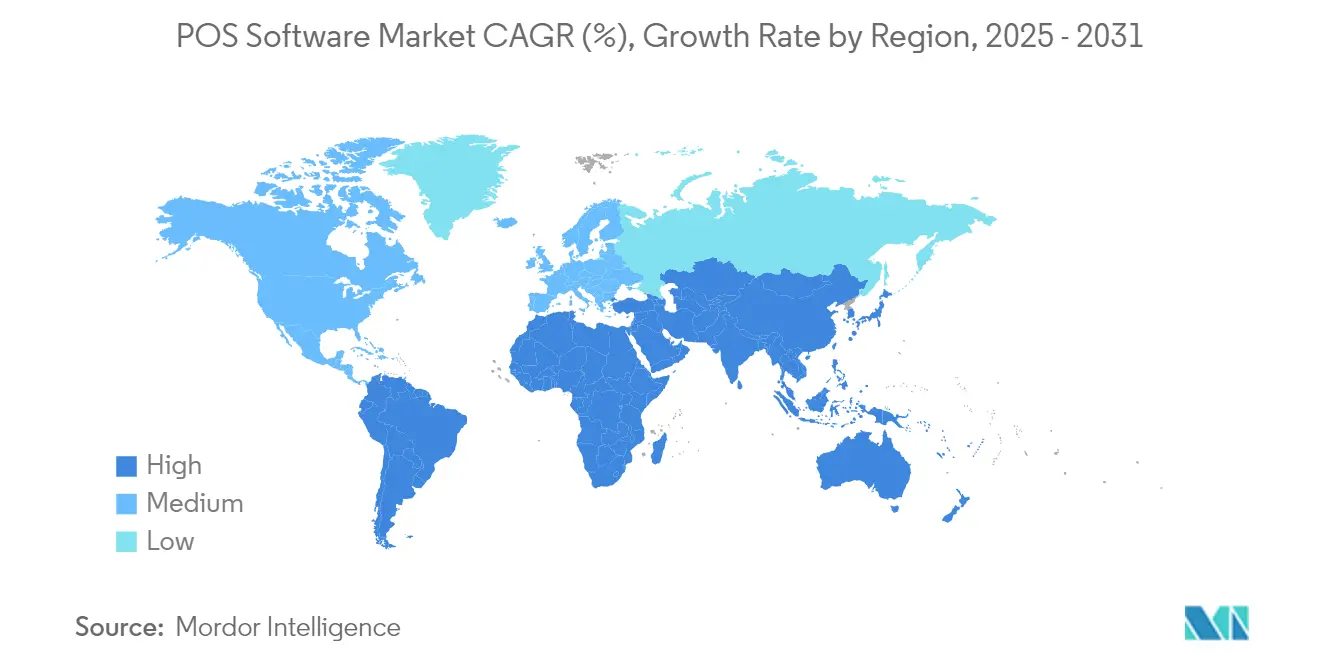
| Fastest Growing Market | Asia Pacific |
| Largest Market | North America |
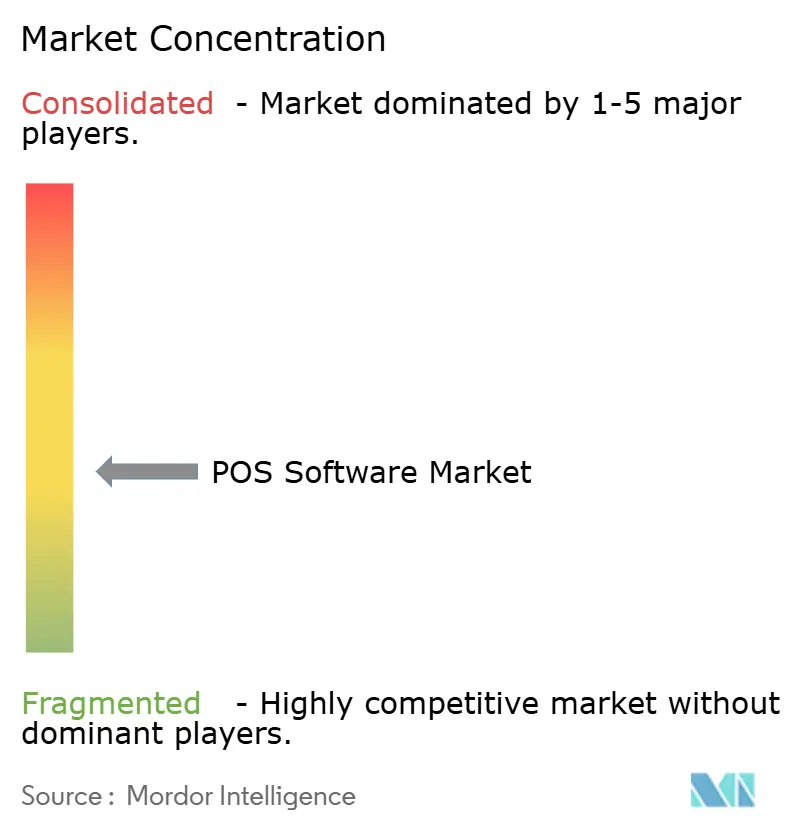
| Market Concentration | Medium |
Major Players *Disclaimer: Major Players sorted in no particular order Image © Mordor Intelligence. Reuse requires attribution under CC BY 4.0. | |
POS Software Market Analysis by Mordor Intelligence
The POS software market size is expected to grow from USD 16.05 billion in 2025 to USD 18.04 billion in 2026 and is forecast to reach USD 32.33 billion by 2031 at 12.38% CAGR over 2026-2031. Expansion stems from the growing preference for cloud systems, the rapid spread of embedded‐finance models that offset licensing costs, and regulatory mandates that make certified solutions compulsory in several countries. The rise of omnichannel retail, line-busting mobile solutions, and subscription pricing further encourage merchants to replace legacy cash-register software. Competitive advantage now revolves around vertical specialization, tight integration with payment acceptance, and AI-driven analytics that lift ticket size and loyalty engagement. Vendors able to bundle software, payments, and value-added services at predictable monthly fees continue to capture disproportionate share of new installations in both developed and emerging economies.
Key Report Takeaways
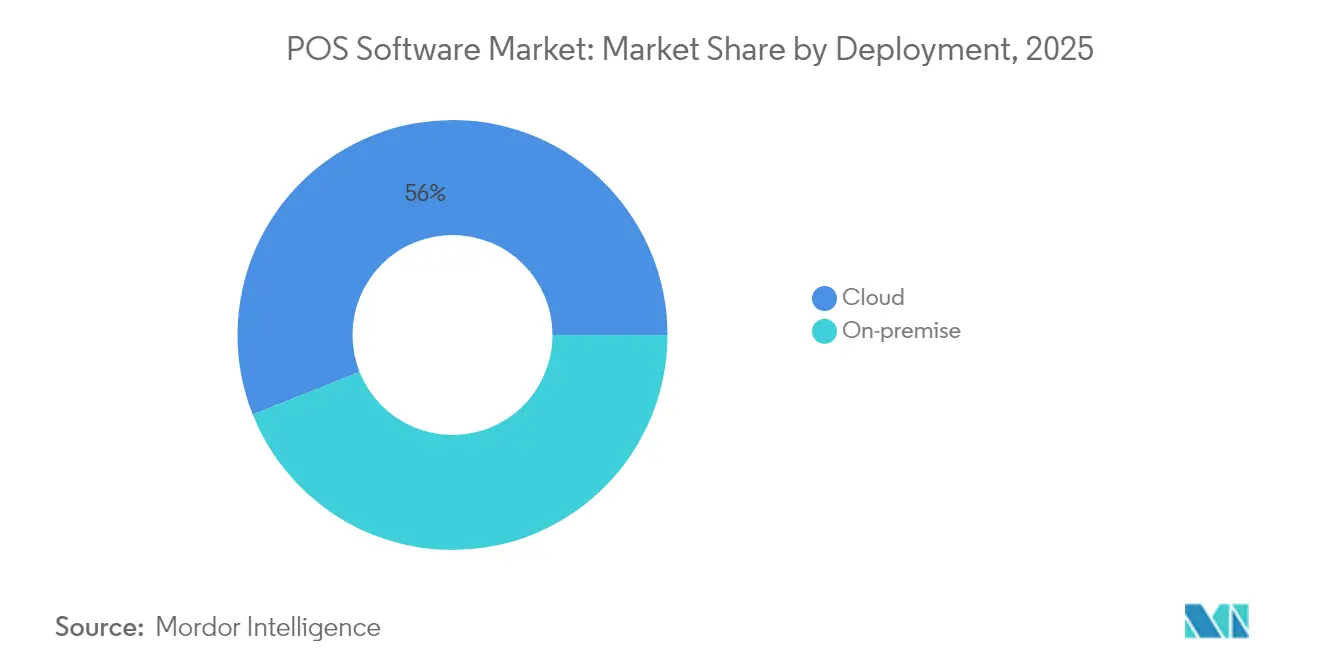
- By deployment, cloud-based systems led with 56.02% revenue share in 2025; the same segment is forecast to compound at a 15.05% CAGR through 2031.
- By End-user Enterprise Size, small and medium enterprises held 60.55% of the POS software market share in 2025 and are expanding at a 12.41% CAGR to 2031.
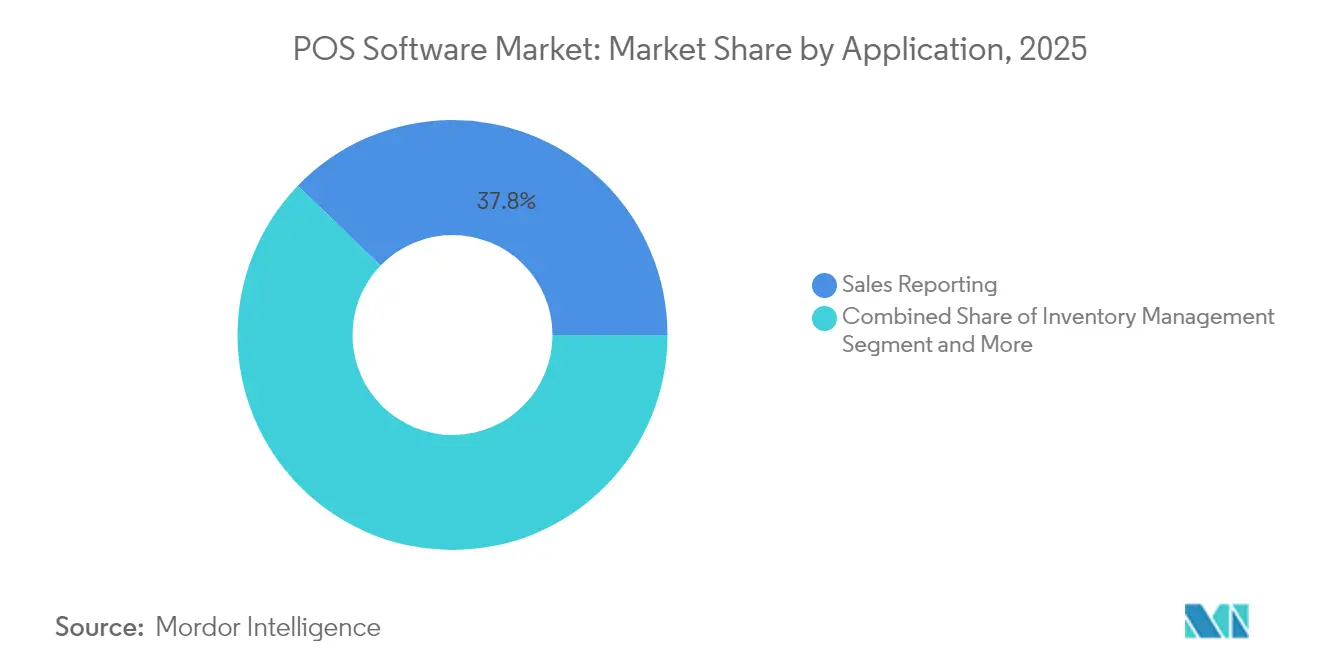
- By application, sales-reporting modules commanded 37.78% of the POS software market size in 2025, while customer-engagement tools are projected to grow at 13.08% CAGR.
- By end-use industry, retail remained first with 32.18% revenue share in 2025; healthcare is set to post the quickest 13.74% CAGR up to 2031.
- By region, North America accounted for 38.29% of global revenue in 2025, whereas Asia-Pacific is the top growth arena at 11.58% CAGR.
Note: Market size and forecast figures in this report are generated using Mordor Intelligence’s proprietary estimation framework, updated with the latest available data and insights as of 2026.
Global POS Software Market Trends and Insights
Drivers Impact Analysis*
| Driver | (~) % Impact on CAGR Forecast | Geographic Relevance | Impact Timeline |
|---|---|---|---|
| Cloud-based POS adoption by SMEs | +3.2% | Global – strongest in North America and Europe | Medium term (2-4 years) |
| Integration with e-commerce and omnichannel | +2.8% | Global – led by Asia-Pacific and North America | Medium term (2-4 years) |
| Mobile POS for line-busting and curb-side | +2.1% | North America; expanding toward Europe and Asia-Pacific | Short term (≤ 2 years) |
| SaaS pricing models lowering capex | +1.9% | Global – SME-focused economies | Long term (≥ 4 years) |
| Embedded-fintech subsidising software costs | +1.7% | North America and Europe; emerging in Asia-Pacific | Long term (≥ 4 years) |
| Mandatory e-invoice compliance upgrades | +1.0% | Europe, Asia-Pacific, Latin America | Medium term (2-4 years) |
| Cloud-based POS adoption by SMEs | +3.2% | Global – strongest in North America and Europe | Medium term (2-4 years) |
| Source: Mordor Intelligence | |||
Cloud-based POS adoption by SMEs
Subscription plans starting at USD 39 per month from Shopify POS make enterprise-grade functionality affordable for micro-merchants, and Square processed USD 228 billion for more than 4 million sellers in 2024, underscoring the elasticity of cloud delivery.[1]Block Inc., “Square Q4 2024 Shareholder Letter,” squareup.com Lightspeed derived 97% of its 2025 revenue from recurring fees, giving it stable cash flows to fund continuous product updates. The model shortens deployment from months to weeks, offers auto-patching against vulnerabilities, and lets owners oversee multiple sites via a single browser dashboard.
Integration with e-commerce and omnichannel retail
Retailers increasingly deploy one platform for store, web, and marketplace transactions so that inventory, loyalty, and shopper profiles remain consistent. The Vitamin Shoppe upgraded to an API-centric POS that now references loyalty history at every touchpoint, supporting personalized offers mid-aisle; PayPal meanwhile expanded in-store processing to complement its USD 1.7 trillion online volume, creating a unified commerce fabric for merchants.[2]Adyen NV, “SME Retail Report 2025,” adyen.com These integrations raise customer lifetime value and lower abandoned-cart rates, making omnichannel capability a default buying criterion.
Mobile POS for line-busting and curb-side models
Square’s 11-ounce Handheld unit with barcode scanner and 16 MP camera increases throughput during peak hours, while Toast Go 2 delivers 24-hour battery life suited to quick-service restaurants. Handheld acceptance reduces customer wait time, frees physical checkout square footage for merchandising, and captures email receipts that feed CRM campaigns. Adoption is expanding from dining to apparel stores, theme parks, and pop-up venues.
SaaS pricing models lowering capex
Full-featured cloud packages now launch for USD 0 – USD 2,000 versus USD 2,000 – USD 10,000 in legacy hardware plus license outlays, shifting budgeting from capital expense to monthly operating expense.[3]HP Inc., “Healthcare Edition POS Systems,” hp.com Usage-based billing aligns cost with revenue seasonality and scales without forklift upgrades. The ensuing flexibility is especially crucial as AI modules lift compute demand yet can be turned on or off per store in real time.
Restraints Impact Analysis*
| Restraint | (~) % Impact on CAGR Forecast | Geographic Relevance | Impact Timeline |
|---|---|---|---|
| Cyber-security and privacy concerns | −1.8% | Global – heightened in North America and Europe | Short term (≤ 2 years) |
| High switching costs / vendor lock-in | −1.5% | Global – enterprise users most affected | Medium term (2-4 years) |
| Country-specific fiscalisation complexity | −0.9% | Europe, Latin America, emerging Asia-Pacific | Long term (≥ 4 years) |
| Developed-market POS saturation | −0.7% | North America, Western Europe | Long term (≥ 4 years) |
| Source: Mordor Intelligence | |||
Cyber-security and privacy concerns
Target-style breaches revealed the susceptibility of in-store endpoints. Operators now layer point-to-point encryption, application whitelisting, and quarterly penetration tests, but compliance and insurance premiums add cost for smaller shops. The proliferating API connections between POS, cloud ERP, and third-party apps widen the attack surface, compelling continuous patching schedules.
High switching costs and vendor lock-in
Moving from one provider to another requires data migration, staff retraining, and coexistence periods that can last months. Hardware, kitchen printers, and handhelds may be proprietary; converting them raises procurement cost and downtime risk. Vendors attempt to ease the hurdle with automated import tools and interest-free hardware leasing, yet businesses remain cautious until ROI is certain.
*Our forecasts treat driver/restraint impacts as directional, not additive. The impact forecasts reflect baseline growth, mix effects, and variable interactions.
Segment Analysis
By Deployment: Cloud dominance accelerates digital transformation
Cloud platforms captured 56.02% revenue in 2025, while the same segment is forecast to post 15.05% CAGR through 2031. The POS software market size for cloud deployments is projected to cross USD 20.84 billion by 2031, reflecting merchants’ shift toward remote configuration, automatic security updates, and rapid scalability. Smaller outlets that once relied on standalone cash registers now activate full suites in hours, and multi-unit chains gain real-time analytics across regions. On-premise solutions remain relevant for military bases and cruise lines where connectivity is intermittent, yet their share continues to contract as cellular redundancy becomes ubiquitous.
During 2020-2024, pandemic lockdowns exposed the limitations of locally installed systems and accelerated migration. Par Tech repositioned from hardware to cloud subscriptions, growing annual recurring revenue 440% over four years, while Lightspeed and Shopify reported double-digit unit growth in cloud terminals. These successes lowered perceived risk, resulting in a self-reinforcing cycle of vendor R&D and customer adoption that should keep the POS software market on its current trajectory.


By End-User Enterprise Size: SME segment drives expansion
SMEs generated 60.55% of total revenue in 2025 and are expanding at 12.41% CAGR. Subscription bundles that include payments, inventory, and basic CRM at sub-USD 50 monthly levels remove the need for upfront hardware finance. The POS software market share figure highlights the democratization of technology once confined to big-box chains.
SaaS vendors emphasize verticalized feature sets: brewery-specific keg tracking, pet groomer appointment scheduling, and mobile car-wash tipping. Embedded-finance tie-ins encourage SMEs to keep core banking and working-capital products within the console, reinforcing platform stickiness. Surveys by Adyen show 64% of small merchants prefer receiving loans directly through the POS dashboard, indicating cross-sell ability.
By Application: Customer engagement emerges as growth driver
Sales reporting remains the largest module at 37.78% revenue share, anchoring data‐driven decision making. Yet customer-engagement applications are rising faster at 13.08% CAGR as AI tools deliver on-the-fly product recommendations and automated loyalty points redemption. In 2025 Lightspeed added an upsell engine that raised average ticket size 8% for pilot merchants, and Square rolled out automated email campaigns triggered by SKU-level behavior.
The wider application suite spans inventory, purchasing, workforce scheduling, gift cards, and financial statements, creating network effects that discourage vendor switching. Marketplace app stores let third parties bolt on local tax modules or kitchen display integrations, broadening functionality without core code rewrites. This ‘platform inside the platform’ dynamic keeps the POS software market growing even after first-time deployments plateau.
By End-Use Industry: Healthcare digitization accelerates adoption
Retail kept leadership with 32.18% revenue share in 2025, but healthcare leads in velocity at 13.74% CAGR. Clinics require devices sealed against disinfectants and software that integrates ICD billing codes, insurance copay logic, and installment plans for elective treatments. HP’s medical-grade POS displays ship with antimicrobial coatings and 10-year supply commitments, matching hospital procurement cycles.
Hospitals embrace kiosks for self-check-in and biometric authentication, improving throughput while reducing paperwork. Payments can be tokenized against a stored card, enabling frictionless discharge. These specialized demands justify premium pricing, expanding the overall POS software market even though healthcare’s outlet count is lower than retail or foodservice.
Geography Analysis
North America generated 38.29% of 2025 revenue on the back of high card penetration, mature SaaS acceptance, and an extensive payment-processor ecosystem. The POS software market size for the region will keep expanding, yet growth moderates relative to emerging territories as replacement cycles lengthen. Federal rules still influence upgrades: the United States PCI DSS v4.0 deadline in 2026 is expected to spark encryption refreshes.
Asia-Pacific delivers the highest 11.58% CAGR through 2031. China’s mobile-payment value passed USD 15 trillion equivalent in 2024, normalizing QR and NFC at corner shops while Southeast Asian governments mandate e-invoice adoption, pushing even micro-businesses toward compliant software endpoints. Malaysia’s Inland Revenue Board, for instance, will require e-invoice issuance by July 2025, accelerating deployments. Cloud providers bundle fiscal-module updates in the subscription, eliminating separate integration projects.
Europe maintains steady uptake with regulatory pressure acting as a tail-wind. Italy obliges certified cash-register connections to the tax agency from January 2026, Spain is introducing obligatory billing signatures, and France has already enforced NF525 fiscal laws. Latin America and Africa trail but exhibit upside as smartphone adoption crosses 60% and acquirer investments bring tap-to-phone capability that converts consumer handsets into acceptance devices without dedicated hardware.

Competitive Landscape
The environment shows moderate concentration. Toast services 140,000 restaurant sites and posted USD 1.34 billion quarterly revenue; Square processed USD 228 billion annual payment volume from 4 million merchants, generating almost one-third of gross profit from software and other services rather than interchange. Lightspeed, NCR Voyix, and Shopify round out the front tier.
Strategy centers on value-added cross-sell. Square’s deposit accounts, loans, and payroll services deepen merchant reliance, while Lightspeed bundles supplier-catalog integration for bike shops and golf courses. NCR Voyix drives multi-brand quick-service chains by embedding loyalty and order-ahead inside the POS, enabling drive-through personalization at scale. Traditional terminal manufacturers such as Ingenico pivot toward SoftPOS SDKs after hardware revenue deceleration, partnering with software firms rather than competing head-on.
Emerging specialists target white spaces. Posiflex focuses on antimicrobial medical devices; Adyen and Stripe Terminal pitch unified commerce APIs to large retailers expanding overseas. Regional challengers in Indonesia and Brazil customize tax modules that global vendors overlook. M&A remains active as incumbents buy niche providers to secure footholds in high-growth verticals.
POS Software Industry Leaders
NCR Voyix Corporation
Toast Inc.
Square Inc.
Shopify Inc.
Lightspeed Commerce Inc.
- *Disclaimer: Major Players sorted in no particular order

Recent Industry Developments
- May 2025: Square launched the Square Handheld, a portable 6.2-inch POS that weighs 11 ounces, includes a barcode scanner and 16 MP camera, and retails at USD 399.
- April 2025: Fiserv and Klarna integrated BNPL instalments into Clover devices, aiming for full roll-out across 3.5 million terminals in early 2026.
- March 2025: JPMorgan Chase introduced an embedded-finance module for Walmart Marketplace sellers, providing in-panel payout control.
- February 2025: Aevi and Paydock partnered to create an omnichannel payment-orchestration layer supporting Open Banking and BNPL.


Research Methodology Framework and Report Scope
Market Definitions and Key Coverage
Our study treats the point-of-sale software market as all licensed or subscription applications that record, process, and report in-store or mobile sales, bundle inventory, staff, and analytics features, and connect directly with payment rails. Value is captured in USD at the software layer only, across retail, hospitality, healthcare, and other physical-commerce outlets.
Scope exclusion: Hardware such as terminals, printers, scanners, and stand-alone e-commerce gateways lies outside this scope.
Segmentation Overview
- By Deployment
- On-premise
- Cloud
- By End-user Enterprise Size
- Large Enterprises
- Small and Medium Enterprises (SME)
- By Application
- Inventory Management
- Purchasing Management
- Sales Reporting
- Customer Engagement
- Other Applications
- By End-Use Industry
- Retail
- Hospitality
- Media and Entertainment
- Healthcare
- Other End-use Industries
- By Geography
- North America
- United States
- Canada
- Mexico
- South America
- Brazil
- Argentina
- Rest of South America
- Europe
- Germany
- United Kingdom
- France
- Italy
- Spain
- Russia
- Rest of Europe
- Asia-Pacific
- China
- Japan
- India
- South Korea
- Australia and New Zealand
- Rest of Asia-Pacific
- Middle East and Africa
- Middle East
- United Arab Emirates
- Saudi Arabia
- Turkey
- Rest of Middle East
- Africa
- South Africa
- Nigeria
- Rest of Africa
- Middle East
- North America
Detailed Research Methodology and Data Validation
Primary Research
Interviews with POS product heads, regional resellers, and finance managers of chain retailers in North America, Europe, and Asia confirmed typical subscription prices, renewal cycles, and mobile-POS penetration, while short online polls of café operators refined churn filters and feature priorities.
Desk Research
We began with retail-sales, card-present, and cashless-use series from the U.S. Census Bureau, Eurostat, the Reserve Bank of India, and the World Payments Council, then matched channel nuances using National Retail Federation briefs and Hospitality Technology surveys. Company 10-Ks, IPO decks, and press releases revealed licence volumes and contract values. Factiva news archives, D&B Hoovers financials, Questel patent analytics, and Volza shipment logs added trend depth. The sources named are illustrative; many others underpinned extra validation.
Market-Sizing & Forecasting
A top-down pool is built by multiplying active terminals by verified software ASPs, adjusted for cloud share and regional bands, and then reconciled with sampled vendor revenues and channel checks. Key variables include new-store openings, cashless penetration, on-premise-to-cloud migration pace, and mPOS share. A multivariate regression against GDP per capita and retail-sales growth produces 2025-2030 projections, with scenario analysis tackling inflation shocks. Missing disclosures are bridged with median interview inputs once outliers are removed.
Data Validation & Update Cycle
Outputs pass anomaly scans, peer review, and management sign-off. Models refresh every twelve months, with interim updates when sizable M&A, regulatory, or pricing events arise; a rapid re-pass is completed before client delivery.
Why Mordor's POS Software Baseline Commands Reliability
Published figures diverge because some publishers blend hardware, use dated base years, or assume steep cloud take-up. Mordor isolates pure software, refreshes data annually, and grounds price curves in live contract evidence, giving a steadier yardstick.
Benchmark comparison
| Market Size | Anonymized source | Primary gap driver |
|---|---|---|
| USD 16.05 B (2025) | Mordor Intelligence | - |
| USD 16.37 B (2025) | Global Consultancy A | Adds custom integration and gateway fees |
| USD 13.49 B (2023) | Industry Journal B | Older base year, omits mobile-only SaaS |
The comparison shows that, once scope and timing are aligned, Mordor's figure sits at the balanced midpoint, providing the most dependable baseline for strategic planning.


Key Questions Answered in the Report
What is the current value of the POS software market?
The POS software market generated USD 18.04 billion in 2026 and is projected to reach USD 32.33 billion by 2031.
Which segment is growing fastest?
Cloud deployments are advancing at a 15.05% CAGR, driven by subscription pricing and remote-management features.
Why is healthcare attracting attention in POS deployment?
Specialized devices, insurance validation, and long hardware life requirements push healthcare to a 13.74% CAGR, the quickest across end-use industries.
How important are embedded-finance features?
Embedded loans, banking, and pay-later options subsidize software fees and boost vendor revenue, adding an estimated 1.7 percentage points to market CAGR.
Page last updated on:


