
Market Overview
| Study Period | 2021 - 2031 |
|---|---|
| Forecast Data Period | 2026 - 2031 |
| Base Year Market Size (2025) | 6.81 gigawatt |
| Market Volume (2026) | 8.19 gigawatt |
| Market Volume (2031) | 20.65 gigawatt |
| Growth Rate (2026 - 2031) | 20.31 % |
| Market Concentration | Medium |
Major Players *Disclaimer: Major Players sorted in no particular order Image © Mordor Intelligence. Reuse requires attribution under CC BY 4.0. | |
Portugal Solar Energy Market Analysis by Mordor Intelligence
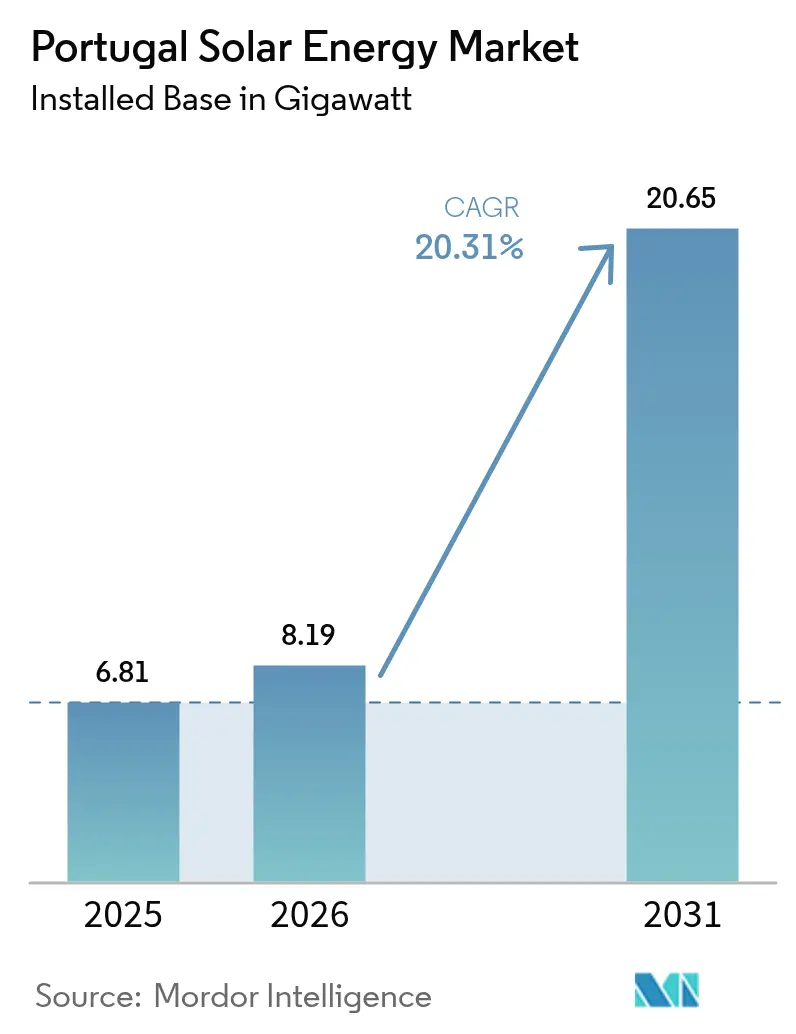
The Portugal Solar Energy Market size was valued at 6.81 gigawatt in 2025 and estimated to grow from 8.19 gigawatt in 2026 to reach 20.65 gigawatt by 2031, at a CAGR of 20.31% during the forecast period (2026-2031).
Recent gains stem from the 1.77 GW added in 2024, the auction-linked pipeline that aligns with the 2030 National Energy and Climate Plan, and the release of 1.2 GW of grid headroom following the retirement of the Sines coal plant. Module prices under USD 0.12 per W, streamlined licensing under Decree-Law 99/2024, and a surge in self-consumption systems have drawn both infrastructure funds and corporate offtakers into the Portugal solar energy market. Competitive activity sharpened after Brookfield and EQT completed acquisitions worth a combined USD 3.91 billion, concentrating utility-scale pipelines among the top five developers. Meanwhile, policy signals, such as the July 2025 VAT reversion for rooftops, introduce near-term uncertainty, yet upside persists in floating solar, agrivoltaics, and storage-hybrid projects that ease curtailment risk in the congested Alentejo grid.
Key Report Takeaways
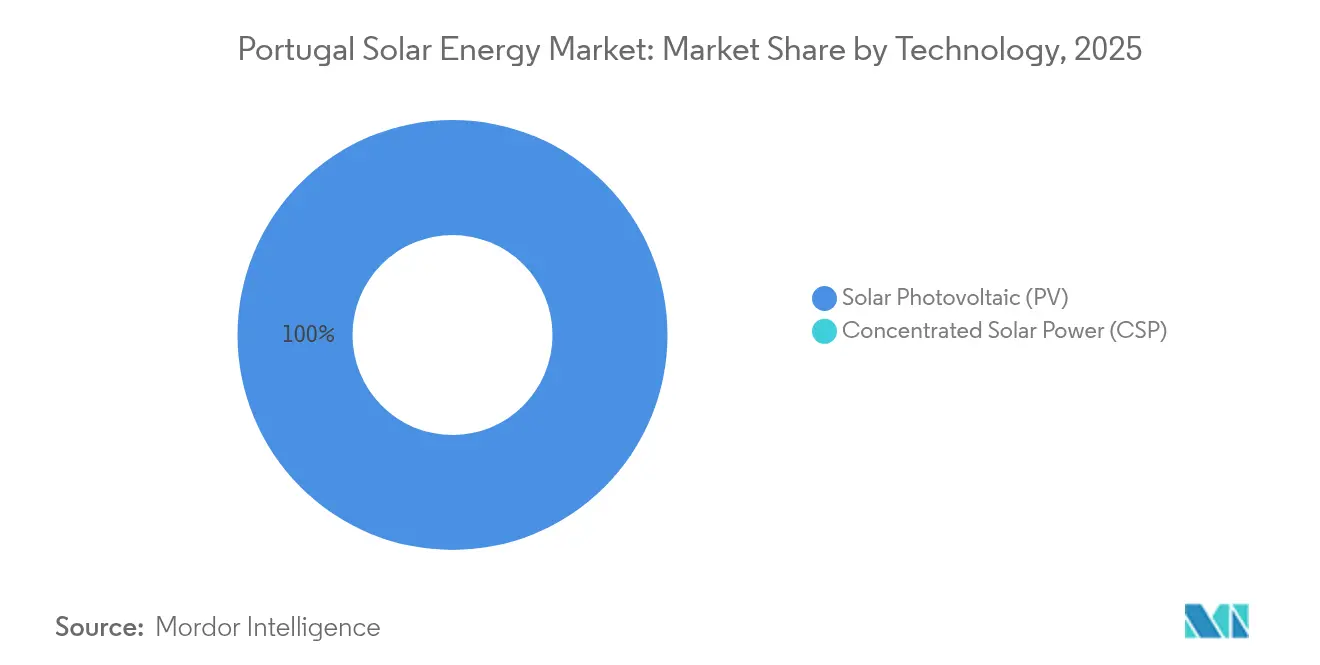
- By technology, solar PV secured 100.00% of the Portugal solar energy market share in 2025, while concentrated solar power remained absent.
- By grid type, on-grid installations accounted for 95.90% of the Portuguese solar energy market size in 2025; the off-grid niche is projected to expand at a 23.20% CAGR through 2031.
- By end-user, utility-scale assets controlled an 84.50% share of the Portugal solar energy market in 2025, whereas residential capacity is advancing at a 24.30% CAGR to 2031 thanks to the UPAC framework.
Note: Market size and forecast figures in this report are generated using Mordor Intelligence’s proprietary estimation framework, updated with the latest available data and insights as of 2026.
Market Trends and Insights
Drivers Impact Analysis of Portugal Solar Energy Market*
| Driver | (~) % Impact on CAGR Forecast | Geographic Relevance | Impact Timeline |
|---|---|---|---|
| Government auctions & 2030 NECP solar target | +6.2% | National (Alentejo, Ribatejo) | Long term (≥ 4 years) |
| Falling module prices & lower LCOE | +4.8% | National; Azores, Madeira | Medium term (2-4 years) |
| Corporate PPA momentum | +3.5% | Lisbon, Porto, nationwide | Medium term (2-4 years) |
| Freed Sines grid capacity post-coal exit | +2.9% | Alentejo, Setúbal | Short term (≤ 2 years) |
| UPAC self-consumption boom | +2.7% | Urban and industrial hubs | Medium term (2-4 years) |
| Floating-solar & agrivoltaics rollout | +1.1% | Alqueva, Cabril, pilot sites | Long term (≥ 4 years) |
| Source: Mordor Intelligence | |||
Government Auctions & 2030 NECP Solar Target
The 20.8 GW 2030 target requires average annual additions of 2.5 GW, which is well above 2024’s record. Auctions between 2020 and 2023 cleared 2.2 GW at some of Europe’s lowest bids, reinforcing long-term cost leadership. Yet the 2024 auction deferral revealed grid-connection bottlenecks, prompting developers to pivot toward bilateral PPAs that trade auction certainty for counterparty risk. Substation upgrades in the Alentejo lag commissioning by up to 18 months, underlining the mismatch between policy ambition and infrastructure readiness. The Portugal solar energy market, therefore, hinges on timely grid reinforcement to keep its growth curve intact.
Falling Module Prices & Lower LCOE
Polysilicon oversupply pushed module prices to USD 0.10–0.12 per W in 2024, compressing LCOEs to EUR 20–30 per MWh in high-irradiance zones and rendering solar cheaper than onshore wind for the first time in Portugal.(1) Developers now specify bifacial modules and single-axis trackers that lift yields by up to 20%, yet ultra-thin manufacturer margins could reverse price declines if trade actions or capacity closures emerge. Projects locked through 2025 are insulated, but 2026 deliveries may face renewed cost pressure, underscoring procurement-timing risk for the Portugal solar energy market.
Corporate PPA Momentum
More than 800 MW of offtake closed through ten deals in 2024, with contract prices between EUR 40–50 per MWh, roughly half the 2024 wholesale average. Offtakers range from ceramics to public-sector aggregations, diversifying credit exposure. The landmark 166 MW public-sector PPA with eSPap offers proof of concept for pooled demand structures, although replicating them in the private sphere remains complex. This PPA wave anchors revenue for merchant projects and buffers the Portugal solar energy market against auction delays.
UPAC Self-Consumption Boom
Net-metering privileges drove UPAC installations to 192,000 by the end of 2024, given retail tariffs of EUR 0.18 per kWh and the exemption from grid-access queues. The July 2025 VAT shift from 6% to 23% will increase the cost of a 5 kW rooftop system by EUR 600 and extend its payback period beyond seven years, likely reducing residential demand. Commercial rooftops sidestep the VAT hit but face structural constraints, as only 35% of industrial roofs in Lisbon and Porto meet PV suitability criteria. Nonetheless, self-consumption remains a crucial safety valve that keeps the Portugal solar energy market diversified.
Restraints Impact Analysis of Portugal Solar Energy Market*
| Restraint | (~) % Impact on CAGR Forecast | Geographic Relevance | Impact Timeline |
|---|---|---|---|
| Grid congestion & slow permitting | -3.4% | Alentejo, Algarve, Beiras | Medium term (2-4 years) |
| High interest-rate financing environment | -2.1% | Nationwide, merchant projects | Short term (≤ 2 years) |
| VAT on residential PV returning to 23% | -1.6% | Urban residential zones | Short term (≤ 2 years) |
| Local land-use & heritage opposition | -0.9% | Lisbon periphery, Algarve, rural sites | Long term (≥ 4 years) |
| Source: Mordor Intelligence | |||
Grid Congestion & Slow Permitting
Connection queues in the Alentejo region have stretched beyond 18 months, and REN’s EUR 1.5–1.7 billion investment plan will not fully alleviate backlogs until 2027. Administrative reforms reduce paperwork, yet physical bottlenecks persist, forcing developers to accept curtailment risk or invest in substation upgrades. Environmental reviews can add six to nine months near protected areas, and the Portugal solar energy market could face a mid-decade plateau if reinforcement is delayed.
High Interest-Rate Financing Environment
ECB rate cuts have begun, but debt costs for Portuguese solar remain at 4–6%, double the 2021 levels, trimming merchant IRRs by 200–300 bps.(2) Banks now require 1.4x DSCR, squeezing smaller sponsors that lack balance-sheet strength. Unless rates ease further, financing headwinds will continue to shadow the Portuguese solar energy market through mid-2025.
*Our forecasts treat driver/restraint impacts as directional, not additive. The impact forecasts reflect baseline growth, mix effects, and variable interactions.
Portugal Solar Energy Market Segment Analysis
By Technology:
PV Dominance Leaves CSP UnviableSolar PV captured 100.00% of the installed capacity in 2025 and is set to retain that position, growing at a 20.31% CAGR within the Portuguese solar energy market. Converging module and polysilicon costs have widened PV’s edge over CSP, whose direct-normal irradiance requirements exceed Portugal’s diffuse profile. Bifacial modules already account for 60% of shipments and, when paired with single-axis trackers, deliver 15–20% yield boosts that offset the mild curtailment risk in the saturated Alentejo grid. TOPCon and heterojunction cells are pushing conversion efficiencies past 24%, and when paired with central inverters that offer ancillary-service functions, they underpin the next efficiency wave. Storage hybrids, such as EDP’s 17 MW battery at Alqueva, illustrate emerging value-stacking paths that mitigate grid-constraint risk and anchor long-term competitiveness for the Portugal solar energy industry.
PV’s absolute grip shapes procurement dynamics: developers aim to keep all-in capital costs below EUR 500,000 per MW and lock module supply at negative-margin pricing before potential trade actions reset costs. CSP remains sidelined, and no pilot projects are slated through 2030, indicating that the Portuguese solar energy market will likely remain PV-exclusive absent a significant step-change in CSP economics.

By Grid Type:
Off-Grid Niche ExpandsOn-grid systems held 95.90% of the Portuguese solar energy market in 2025, leveraging generous net metering and grid banking. Off-grid capacity, though small, is tracking a 23.20% CAGR as island territories and remote farms adopt solar-plus-battery microgrids when grid extension costs exceed USD 50,000 per km. Decree-Law 15/2022 simplified licensing for sub-100 kW systems, catalyzing uptake among vineyards and olive groves that use solar to power irrigation pumps. Hybrid diesel-PV solutions in the Azores displace up to 70% of imported fuel, validating the off-grid economics, where avoided diesel costs amount to USD 0.22 per kWh.
Grid-tied self-consumers bank surplus generation for 12 months, effectively using the grid as free storage, but ERSE’s 2025 tariff review may introduce capacity charges that shave 10–15% off savings. Off-grid adopters face higher battery CAPEX yet avoid policy risk. As a result, the Portuguese solar energy market is likely to see incremental off-grid diversification that cushions policy swings in net metering.
By End-User:
Residential Surge Reshapes DemandUtility-scale assets controlled 84.50% of the installed capacity in 2025; however, the residential segment is expanding at a 24.30% CAGR and is set to add a disproportionate share of incremental megawatts to the Portuguese solar energy market by 2031. Homeowners monetize retail tariffs nearly twice as much as wholesale prices, and the ability to sidestep grid queues sharpens the value proposition. Rooftop suitability studies show that Lisbon and Porto are leading the adoption, aided by municipal subsidies that cover roughly 30% of the upfront cost. The looming VAT hike will stretch payback timelines past seven years, tempering some demand but leaving commercial roofs and C&I ground-mounts largely unscathed.
Corporate and industrial systems benefit from daytime load alignment and PPA structures that mitigate project revenue risk. By 2024, C&I installs rose 26.6% with typical self-consumption ratios of 70–90%, and Vidrala’s and Sakthi’s PPAs illustrate how industrial offtake underwrites growth. Utility-scale builds remain the capacity anchor, with 1.2 GW commissioned in 2024; yet, distributed generation is capturing a growing share of investment, solidifying a dual-engine model that underpins the Portuguese solar energy market.

Geography Analysis
The Alentejo region hosts 54.20% of utility-scale additions due to its high irradiance, near 1,800 kWh/m², and low land costs, ranging from EUR 5,000 to EUR 10,000 per hectare. However, the Ferreira do Alentejo substation reached 95% utilization in 2024, compelling developers to fund upgrades costing up to EUR 10 million each. The Algarve added 280 MW but faces land-use conflicts with tourism and protected zones that cover 40% of its area. Lisbon and Porto dominate self-consumption, together hosting 120,000 UPAC systems. Municipal rebates seeded momentum in 2024 and are expected to continue into 2025.
Beiras is emerging as a growth frontier, driven by floating solar, notably Voltalia’s 47.77 MW Cabril project, which sidesteps agricultural displacement. In the Azores and Madeira, hybrid diesel-solar arrays reduce annual fuel imports worth EUR 150 million, justifying higher storage costs. Northern regions with lower irradiance attract agrivoltaic pilots that merge grazing and generation, creating dual revenue streams for farmers while contributing incremental megawatts to the Portuguese solar energy market.
Regulatory Landscape
Portugal continues to regulate solar deployment through DGEG-led licensing and ERSE market oversight, with the policy agenda linked to the updated National Energy and Climate Plan (PNEC 2030). In 2026, Lei n.o 29/2026 (June 23, 2026) updated the legal framework for renewable energy use contracts and introduced a tacit approval approach for self-consumption (UPAC) licensing, including a maximum 90-day window for renewables-based self-consumption licensing to reduce administrative friction for distributed PV.
Permitting reform also advanced for larger-scale projects. Decreto-Lei n.o 130/2026 (June 29, 2026) transposed EU provisions on Renewable Energy Acceleration Zones (ZAER), enabling designated areas, including in sea or inland waters, where licensing is streamlined. For floating PV already moving through government-backed processes, Despacho n.o 126/MAEN/2026 (June 2026) granted a 14-month extension for deadlines under the floating-solar auction program, while Portaria n.o 233/2026/1 (May 26, 2026) set a market-based remuneration tariff for PV plants after initial subsidy periods end, explicitly excluding additional premiums.
Competitive Landscape
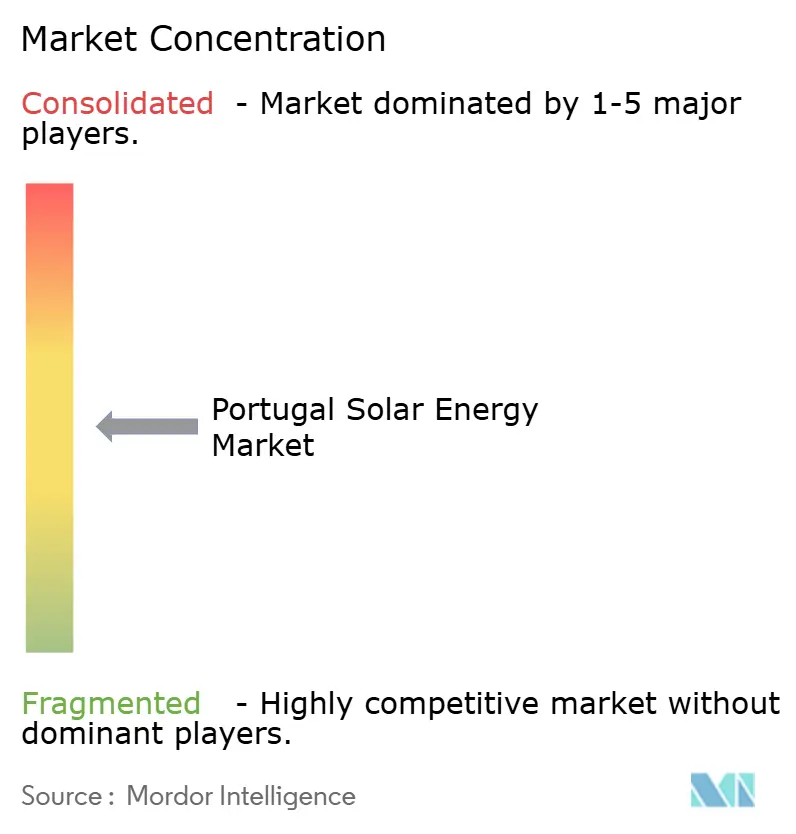
The top five developers, EDP Renováveis, Iberdrola, Voltalia, Greenvolt, and Acciona, control 62% of utility-scale pipelines, placing the Portugal solar energy market in a moderately concentrated tier. Residential and C&I installs remain fractured across more than 300 regionally focused EPCs. Large players pursue vertical integration: EDP earmarked EUR 2.5 billion for distributed projects, while mid-tier firms, such as R.Power, differentiate themselves via PPA structuring. The 2024 buyouts of Greenvolt and Sonnedix demonstrate the appetite of infrastructure funds for contracted assets, driving EBITDA multiples to 12–14x and nudging smaller developers toward build-and-flip strategies.
Technology serves as a battlefield. Developers specify bifacial modules paired with trackers to shave EUR 2–3 per MWh off LCOE. Inverter vendors fight for grid-support features that unlock ancillary-service revenues of up to EUR 10,000 per MW annually. Module oversupply pressures margins, but suppliers offering 25–30-year warranties and 90% output guarantees win residential share. ERSE’s ISO 9001 installer rules raise market-entry thresholds, sparking consolidation among rooftop installers and professionalizing after-sales support within the Portugal solar energy market.(4)
Portugal Solar Energy Industry Leaders
-
SGS SA
-
Voltalia SA
-
Acciona SA
-
Gesto Energia SA
-
Iberdrola SA
- *Disclaimer: Major Players sorted in no particular order
Portugal Solar Energy Market Companies Covered in this Report
- Voltalia SA
- Iberdrola SA
- EDP Renováveis SA
- Galp Energia SGPS SA
- Acciona Energía SA
- Greenvolt Energias Renováveis SA
- Endesa SA (Enel Group)
- R.Power SA
- Eurowind Energy A/S
- Sonnedix Power Holdings Ltd
- Q cells GmbH
- First Solar Inc.
- Trina Solar Co. Ltd
- JinkoSolar Holding Co. Ltd
- SunPower Corporation
- Canadian Solar Inc.
- LONGi Green Energy Technology Co. Ltd
- Akuo Energy SAS
- Exus Management Partners
- Nomad Electric Sp. z o.o.
Market Opportunities and Future Outlook
Fast-track siting and permitting are creating near-term whitespace for utility-scale projects that can secure grid access without multi-year administrative lead times. The June 2026 implementation of Decreto-Lei n.o 130/2026 on Renewable Energy Acceleration Zones (ZAER), along with the June 2026 competitive process to identify more than 1,000 wind and solar areas near existing grid infrastructure, strengthens developers' ability to align land selection with connection feasibility, a recurring bottleneck in Alentejo.
Hybridization and new build models are also broadening the investable set beyond conventional ground-mount PV. Announced initiatives such as Chint Solar's proposed Alqueva-Portel Cluster in Alentejo (1.25 GW solar with 895 MW of battery storage) and large behind-the-meter systems like the 49 MWp Neves-Corvo mine project being developed by Boliden Somincor, EDP, and Greenvolt (targeted for completion in the second half of 2026) point to a shift toward storage-backed utility projects and larger distributed systems. On the distributed and regional build-out side, BNZ inaugurated the 28.37 MWp Muro plant in Trofa in June 2026 and has communicated a broader plan to deploy nine solar plants under a EUR 600 million investment program, indicating continued room for multi-site portfolios beyond the most congested southern nodes.
Recent Industry Developments in Portugal Solar Energy Market
- June 2026: BNZ inaugurated the 28.37 MWp Muro solar plant in Trofa, expanding its operating footprint in Portugal to two plants (including Famalicao). The commissioning supports a multi-asset strategy under a stated EUR 600 million plan to deploy nine solar plants, adding a credible route for incremental capacity in northern Portugal where land and grid constraints differ from Alentejo.
- June 2025: Iberdrola signed a 10-year PPA with Gres Panaria Portugal to supply 92 GWh of photovoltaic electricity. The agreement reinforces corporate offtake as a bankability tool for projects outside auction schedules and broadens industrial demand participation in Portugal's solar build-out.
- October 2024: Acciona Energia signed a EUR 800 million, 166 MW PPA with public-sector agency eSPap, described as Portugal's largest public renewable contract. The deal strengthened pooled-demand procurement as a template for long-tenor offtake and provided developers with an additional contracting channel beyond merchant exposure.
Portugal Solar Energy Market Report Scope and Research Methodology
Market Definition and Coverage
For this study, the Portugal solar energy market is defined as the installed solar power capacity operating within Portugal, tracked in gigawatts and supported by project additions and retirements over time.
Scope exclusions: We do not count unrelated renewable sources (such as wind or hydro) and we do not treat overall electricity retail spending as a proxy for solar market size.
Segments Covered in This Report
- By Technology
- Solar Photovoltaic (PV)
- Concentrated Solar Power (CSP)
- By Grid Type
- On-Grid
- Off-Grid
- By End-User
- Utility-Scale
- Commercial and Industrial (C&I)
- Residential
- By Component (Qualitative Analysis)
- Solar Modules/Panels
- Inverters (String, Central, Micro)
- Mounting and Tracking Systems
- Balance-of-System and Electricals
- Energy Storage and Hybrid Integration
Data Sources, Market Sizing, and Validation
Desk Research
Desk research was used to build the factual base for our model, especially for capacity history, policy context, and grid connection progress. We leaned on public sources such as IEA PVPS country updates, Eurostat energy statistics, the Portuguese regulator and grid-operator publications, and the International Renewable Energy Agency datasets, then cross-checked against press releases and project award announcements.
To avoid over-counting, sources were screened for timing and definitions. Some updates describe pipeline announcements, while others report commissioned capacity. Company filings, investor presentations, association websites, and reputable press were used to validate commissioning dates and ownership changes. In a few spots, we also used paid subscriptions for company financials and intelligence, plus patent databases and shipment-level trade views, to sanity-check equipment flows when public data was thin. The desk sources listed here are illustrative only, and other public documents were also used during data collection, validation, and clarification.
Primary Interviews and Surveys
Primary work focused on confirming what is actually getting built and energized, and how quickly projects move from award to grid connection. We spoke with developers, EPC groups, equipment suppliers, financiers, utilities, and large power buyers across Portugal, then used follow-up checks to pressure-test key assumptions such as commissioning slippage and typical capacity factors by plant type.
Distribution of primary research fieldwork respondents
| Company type | Respondent position |
|---|---|
| Top tier: 31% | CXOs: 12% |
| Mid tier: 51% | Functional/Unit leaders: 43% |
| Smaller Players: 18% | Managers: 45% |
Market-Sizing & Forecasting
The core sizing logic is built using a top-down approach where national installed-capacity time series and annual additions are reconstructed from official energy statistics and grid-connection signals, then aligned to the study years. Once that backbone is in place, the totals are corroborated through selective bottom-up approximations, such as rolling up a sample of commissioned plants, checking auction awards that reached COD, and validating typical MW blocks and schedules through channel conversations.
Several market inputs (illustrative, not exhaustive) were used, including the solar PV commissioning pipeline, auction award volumes versus realized COD, grid connection queue progress, typical plant size ranges for utility and distributed systems, and expected performance assumptions such as capacity factor ranges that vary with tracking and irradiation. When public reporting had gaps, we applied conservative timing rules explicitly, then re-tested the totals with interview feedback so the final series remains reproducible.
For forecasting, scenario analysis was used, since policy and grid constraints can shift the build-out quickly. Under each scenario, annual additions are paced using variables like auction calendars, permitting throughput, transmission readiness, and financing appetite, then cross-checked against what interviewees consider executable in the next few years.
Data Validation & Update Cycle
Outputs are validated through a set of cross-checks before sign-off, so the narrative matches the numbers and the numbers match observable signals. Capacity trajectories are compared against independent indicators such as commissioning announcements, grid updates, and policy milestones, then unusual jumps or drops are reviewed and corrected if they come from definition changes or one-off projects.
A second analyst review is completed to test the arithmetic, the year mapping, and the reasonableness of assumptions, and follow-up calls are triggered when a key input has high uncertainty or when the model conflicts with a reliable public datapoint. Reports are refreshed annually, with interim updates when a material event occurs, such as a major auction result, a rule change impacting self-consumption, or a visible shift in grid connection timelines. Right before delivery, a final pass is done so clients receive the most current view available.
Mordor Intelligence's Portugal Solar Energy Market Size Measured Against Other Published Estimates
Published market sizes for Portugal solar energy do not always align, even when the same years are quoted, because the measurement unit and the counted activity can differ. Some sources size solar in revenue terms, others track installed capacity, and some include pipeline expectations in what looks like a current market figure.
The gaps usually come from scope choices that sound small but change totals quickly, such as counting only operating capacity versus adding planned projects, treating distributed systems as part of the total versus isolating them, and applying different commissioning timing rules. Currency year and inflation treatment can also move revenue-based numbers, and update cadence matters because this market can shift right after auctions and grid decisions. Some external estimates also fold in broader solar spending such as modules and services across applications. In Mordor Intelligence, the number is tied to installed solar capacity operating in Portugal and is updated using commissioning and grid-connection checks rather than planned spend.
Benchmark comparison
| Source | Market Size | Gaps in Research Methodology |
|---|---|---|
| Mordor Intelligence | USD 0.01 B (2025) | |
| Industry Publisher A | USD 1.16 B (2025) | Uses a revenue-based solar power definition that can include broader end-use applications and spending categories, so it is not directly comparable to a capacity-based (GW) market size. |
| Trade Research Group B | USD 0.01 B (2024) | Mentions revenue and volume tracking but does not clearly disclose the numeric 2024 market size in the accessible summary, and it also uses different type splits that can shift what is counted as solar energy. |
The comparison shows that most of the spread is explained by unit choice and what each publisher decides to count as market activity. By keeping the model anchored to installed capacity and validating timing through practical checks, the estimate stays traceable to clear inputs and can be repeated each year without relying on opaque revenue assumptions.
Key Questions Answered in the Report
How large is the Portugal solar energy market in 2026?
Installed capacity stood at 8.19 GW in 2026 and is on track to reach 20.65 GW by 2031.
What is the forecast CAGR for Portuguese solar between 2026 and 2031?
Capacity is projected to expand at a 20.31% CAGR during the 2026–2031 period.
Which technology dominates new Portuguese solar projects?
Photovoltaic systems hold 100.00% share, with bifacial modules and single-axis trackers becoming standard in utility-scale builds.
Why are corporate PPAs important in Portugal?
They provide revenue certainty for developers and lock in electricity costs below wholesale rates for offtakers, supporting more than 800 MW of deals in 2024.
What risks could slow down future solar growth?
Grid congestion, elevated financing costs, and the July 2025 VAT increase on residential systems are the primary headwinds.
Where are the best opportunities outside ground-mounted projects?
Floating solar on reservoirs and agrivoltaic installations that combine farming and generation are emerging high-growth niches.