
Global Phytopathological Disease Diagnostics Market Size and Share
Market Overview
| Study Period | 2020 - 2031 |
|---|---|
| Forecast Data Period | 2026 - 2031 |
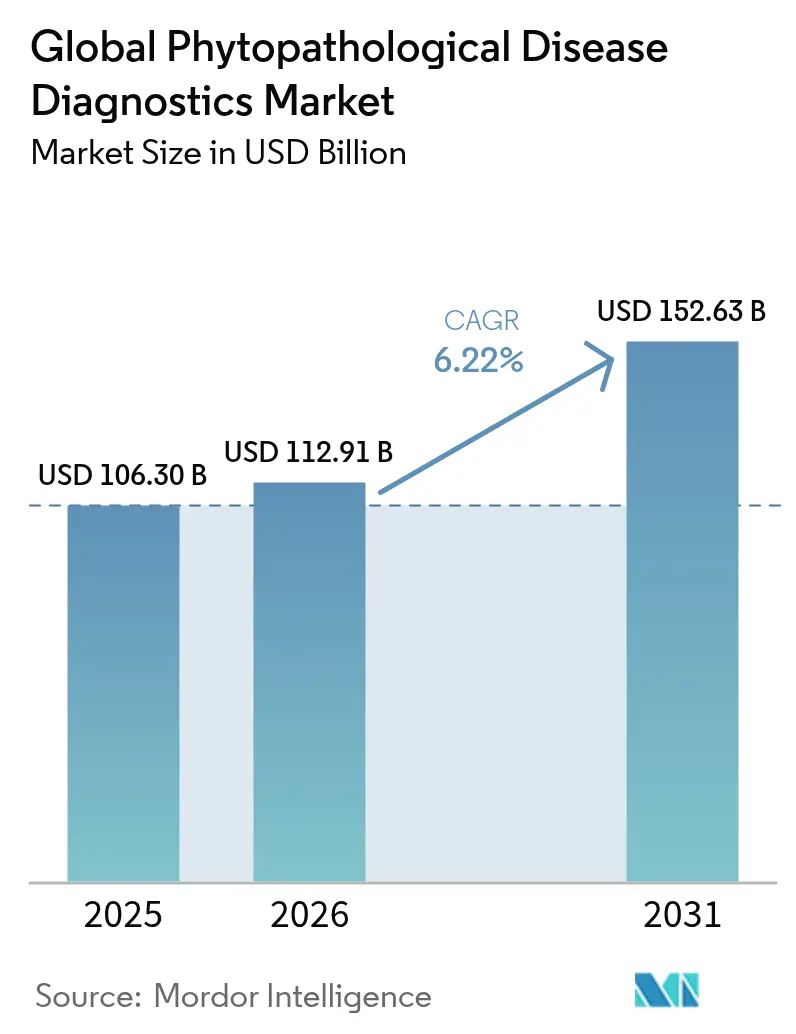
| Market Size (2026) | USD 112.91 Billion |
| Market Size (2031) | USD 152.63 Billion |
| Growth Rate (2026 - 2031) | 6.22 % |
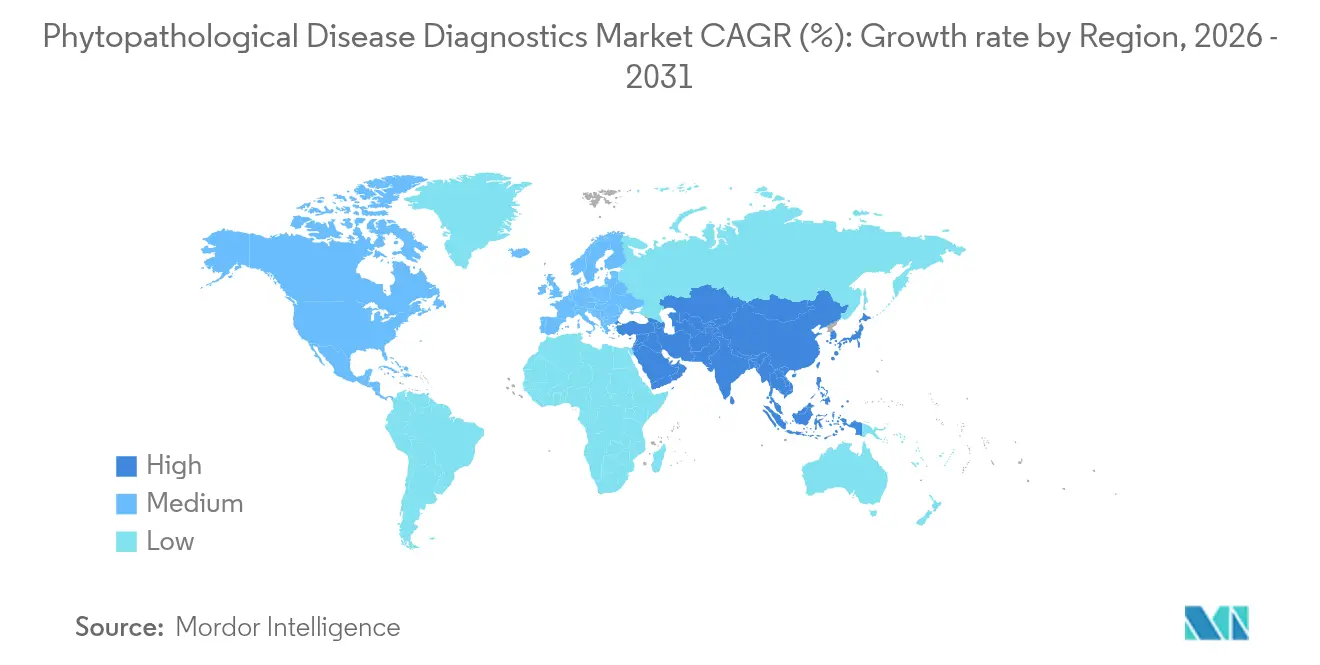
| Fastest Growing Market | Asia Pacific |
| Largest Market | North America |
Major Players *Disclaimer: Major Players sorted in no particular order Image © Mordor Intelligence. Reuse requires attribution under CC BY 4.0. | |
Global Phytopathological Disease Diagnostics Market Analysis by Mordor Intelligence
The phytopathological disease diagnostics market size is expected to grow from USD 106.3 billion in 2025 to USD 112.91 billion in 2026 and is forecast to reach USD 152.63 billion by 2031 at 6.22% CAGR over 2026-2031. Surging global demand for food, coupled with climate-driven spikes in pathogen pressure, is nudging growers toward diagnostic platforms that detect threats at the molecular level before foliage shows damage. Adoption accelerates as liquid-handling microfluidics and portable sequencers collapse turnaround times from days to minutes, allowing in-field decisions that cut yield losses. Investment flows from governments and venture funds are filling capability gaps in real-time analytics, while CRISPR-enabled assays open a path to single-virus sensitivity at farm-gate prices plantmethods. Despite high device costs and patchy regulatory clarity, new subscription models, pay-per-test cartridges and AI-driven risk alerts are widening access, creating an inflection point for the phytopathological disease diagnostics market.
Key Report Takeaways
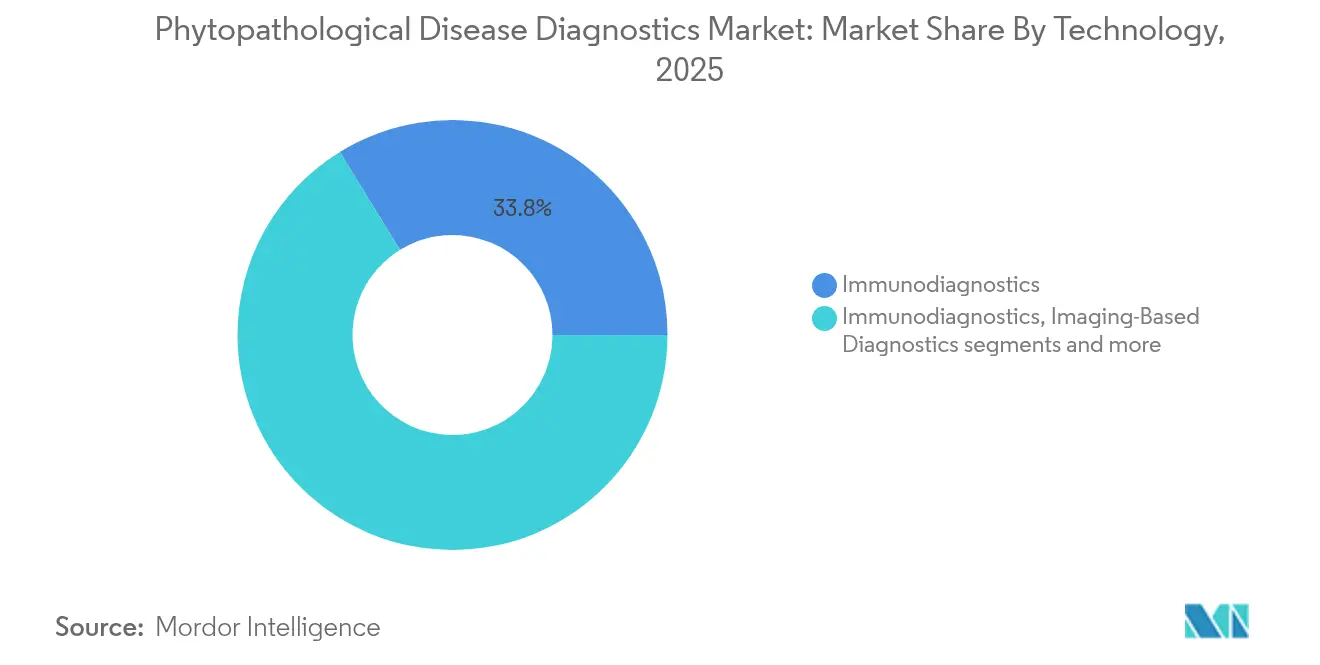
- By technology, immunodiagnostics led with 33.78% of phytopathological disease diagnostics market share in 2025; liquid biopsy is projected to expand at a 7.18% CAGR through 2031.
- By disease area, oncology-equivalent disorders accounted for 39.54% share of the phytopathological disease diagnostics market size in 2025, while neurological disorder diagnostics are advancing at a 7.32% CAGR to 2031.
- By end-user setting, hospitals and specialized laboratories held 45.88% revenue share in 2025; point-of-care deployments are the fastest-growing at 7.51% CAGR through 2031.
- By geography, North America dominated with 37.95% share in 2025, whereas Asia-Pacific is forecast to record the highest regional CAGR at 7.74% to 2031.
Note: Market size and forecast figures in this report are generated using Mordor Intelligence’s proprietary estimation framework, updated with the latest available data and insights as of 2026.
Market Trends and Insights
Drivers Impact Analysis of Global Phytopathological Disease Diagnostics Market*
| Driver | (~) % Impact on CAGR Forecast | Geographic Relevance | Impact Timeline |
|---|---|---|---|
| Climate-linked surge in chronic and complex plant diseases | +1.2% | Global, pronounced in Asia-Pacific and Europe | Medium term (2-4 years) |
| Advances in molecular diagnostics and next-generation sequencing | +1.8% | North America & Europe, expanding to Asia-Pacific | Long term (≥ 4 years) |
| Shift toward precision agriculture and crop-specific treatment | +1.1% | Global, led by North America | Long term (≥ 4 years) |
| Demand for early, non-invasive field detection | +1.4% | Global, with emphasis on developing regions | Short term (≤ 2 years) |
| Integration of multi-omics data streams | +0.9% | North America & Europe | Long term (≥ 4 years) |
| AI-driven biomarker discovery | +1.0% | Global, concentrated in tech-advanced regions | Medium term (2-4 years) |
| Source: Mordor Intelligence | |||
Rising prevalence of chronic & complex diseases
Changing temperature and rainfall patterns extend pathogen lifecycles, allowing fungal and bacterial agents to infect crops across multiple growth stages. Global losses tied to plant diseases now top USD 220 billion annually, intensifying demand for sophisticated surveillance networks. Fungi alone dominate 79% of economically important pathosystems, thriving in warmer, humid zones where stressed plants mount weaker immune responses. As a result, integrated monitoring platforms that test for several pathogens in one run are becoming standard on large plantations. Governments in tropical belts are incentivizing adoption through tax credits on diagnostic equipment, accelerating growth momentum for the phytopathological disease diagnostics market.
Advances in molecular diagnostics & NGS
Portable sequencers deliver quarantine-grade reads in under 15 minutes, enabling border inspectors to screen bulk seed cargo on-site mdpi.com. CRISPR-Cas13a assays raise sensitivity tenfold over conventional RT-PCR, while multiplex nanopore cartridges can process pooled leaf, soil and water samples simultaneously, cutting per-test costs. Cloud-linked analytics turn raw genetic data into actionable dashboards, allowing extension agents to publish region-wide alerts that outpace disease spread.
Shift Toward Personalized /Precision Medicine
Field variability demands diagnostics that map cultivar genetics, micro-climate and soil chemistry in concert. Metabolomic fingerprints now correlate ion flux changes with looming stress episodes, letting agronomists tailor fungicide timing to the hour. Machine-learning models trained on spectral and phenotypic images classify disease states with 95%+ accuracy, nudging the phytopathological disease diagnostics industry toward subscription-based prediction services.
Growing Demand for Early, Non-invasive Detection
Smartphone-mounted optics identify volatile organic compound signatures of late blight in tomatoes with 95% accuracy in under one minute. Wearable plant patches log transpiration and surface temperature, streaming data to cloud dashboards that flag anomalies hours before visual wilting appears. Early action curves pesticide use downward by up to 50%, bolstering sustainability goals and driving wider uptake in smallholder systems.
Restraints Impact Analysis of Global Phytopathological Disease Diagnostics Market*
| Restraint | (~) % Impact on CAGR Forecast | Geographic Relevance | Impact Timeline |
|---|---|---|---|
| High cost and limited reimbursement models | -1.8% | Global, acute in developing regions | Short term (≤ 2 years) |
| Fragmented and stringent regulatory requirements | -1.1% | North America & Europe, expanding globally | Medium term (2-4 years) |
| Data interoperability gaps | -0.7% | Global, more pronounced in fragmented markets | Medium term (2-4 years) |
| Shortage of computational-pathology talent | -0.9% | Global, acute in developing regions | Long term (≥ 4 years) |
| Source: Mordor Intelligence | |||
High Cost & Reimbursement Hurdles
Full-service molecular benches range from USD 25,000 to USD 150,000, limiting ownership to corporate farms and research hubs. Pay-per-test devices priced at USD 10–20 remain sizable for growers without crop-loss insurance or concessional credit lines. Local cooperatives and input suppliers trial pooled-testing models to dilute per-acre costs, yet pervasive subsidy frameworks seen in human healthcare are still absent.
Stringent Regulatory Requirements
Cross-agency oversight stretches product clearance to two or three growing seasons. In the United States, developers must satisfy FDA analytical rigor, USDA phytosanitary mandates and, for pesticide-linked kits, Environmental Protection Agency sign-off [1]Source: U.S. Food and Drug Administration, “Overview of IVD Regulation,” fda.gov. Divergent data-storage mandates across jurisdictions further slow AI-enabled tools, prompting calls for harmonized digital standards.
*Our forecasts treat driver/restraint impacts as directional, not additive. The impact forecasts reflect baseline growth, mix effects, and variable interactions.
Global Phytopathological Disease Diagnostics Market Segment Analysis
By Technology:
Liquid biopsy accelerates field-ready testingImmunodiagnostics retained 33.78% phytopathological disease diagnostics market share in 2025, a position earned over decades through robust ELISA kits that remain the first line of defense for many extension labs. Liquid biopsy, though currently smaller, posts the quickest advance at a 7.18% CAGR as nanopore flow cells and microfluidics enable in-situ sap analysis without destructive sampling. Farmers using handheld biopsy readers capture real-time viral load curves, letting them confine rogue batches before pathogens seed adjoining rows.
Second-generation CRISPR-Cas13a cartridges widen coverage to 250+ RNA viruses per run, while AI-enhanced imaging augments them with canopy-level surveillance. Portable PCR devices under 500 g merge sample prep, amplification and fluorescence detection, generating Ct values onsite in under 20 minutes. Multi-omics dashboards fuse proteomic and metabolomic data with genetic results, rendering health scores that benchmark fields against regional disease norms. Integration with smart sprayers that auto-dose fungicide when viral titers cross risk thresholds demonstrates the path from diagnosis to intervention.



By Disease Area:
Diagnostics for stress-linked disorders gain tractionPlant oncology analogues—crown gall, tumorigenic viral infections and proliferation of abnormal growth tissues—held 39.54% revenue in 2025, underscoring the economic peril of unchecked cell division in perennial crops. Diagnostics targeting systemic stress responses, grouped under neurological disorder analogues, pace the field with a 7.32% CAGR. Machine-learning classifiers now separate benign metabolic fluctuations from early vascular blockages, helping viticulture businesses avert phloem-restricting infections.
Demand also rises for multiplex kits that screen for bacterial wilt, sudden death syndrome and xylem-clogging phytoplasmas in one assay, coinciding with expansion in soybean and tomato acreage. Diagnostics for autoimmune-like hypersensitive responses, often misread as nutrient imbalances, benefit from spectral algorithms that isolate subtle pigment shifts. As plant scientists uncover hormonal crosstalk in stress signaling, assay developers add endocrine markers—auxin, salicylic acid, ethylene—to test panels, securing a full-circle view of plant health.
By End User:
Point-of-care drives democratizationCentral laboratories within research universities and corporate R&D hubs commanded 45.88% of 2025 revenues, underpinned by high-throughput workflows and skilled personnel. Yet the fastest growth occurs at point-of-care sites—cooperatives, mobile agronomist units and on-farm sheds—tracking a 7.51% CAGR as cartridge-based readers shrink in both price and complexity. Early adopters deploy solar-powered PCR pods in remote paddocks, transmitting results to agronomists who script treatment plans within the hour. For smallholders, shared diagnostic kiosks lower entry barriers, offering pay-as-you-go testing bundled with extension advice.
Home-based kits also appear, resembling lateral-flow pregnancy tests but tuned for pathogen antigens. Coupled with QR-coded instruction videos, these kits empower growers with minimal formal training. Academic institutes, meanwhile, anchor innovation cycles, validating field protocols, archiving open-access biomarker libraries and upskilling technicians through regional workshops. Their collaboration with start-ups quickens the commercialization loop, keeping the phytopathological disease diagnostics market agile.

Geography Analysis
North America Phytopathological Disease Diagnostics Market
North America accounted for 37.95% of 2025 revenues, propelled by mature supply chains, USDA grant programs and partnerships that move lab breakthroughs into commercial channels. Ongoing public–private investments—Thermo Fisher alone is earmarking USD 2 billion for U.S. manufacturing and R&D between 2024 and 2027—cement domestic capacity across reagents, sensors and AI analytics. The region also leads in field trials for CRISPR-based diagnostics after regulators published clear gene-edited crop guidelines.
APAC Phytopathological Disease Diagnostics Market
Asia-Pacific registers the fastest uptick at an 7.74% CAGR through 2031 as mega-farm operators in China, India and Australia embrace sensor-dense, data-led agronomy. Government-subsidized digital villages and low-interest loans for precision hardware spur penetration across rice, cotton and horticultural belts. Disease outbreaks such as maize lethal necrosis and bacterial fruit blotch have pushed ministries to mandate pre-harvest pathogen testing, anchoring long-term demand for the phytopathological disease diagnostics market.
Europe, LATAM and Africa Phytopathological Disease Diagnostics Market
Europe retains strong share by virtue of stringent farm-to-fork traceability rules that penalize consignments lacking pathogen clearance. The European Green Deal’s pesticide-reduction targets catalyze diagnostic adoption, as growers must document non-chemical interventions. Laboratories in the Netherlands and Denmark pilot blockchain tagging of diagnostic results, tightening provenance audit trails for high-value exports. Beyond the big three regions, Latin America accelerates uptake in soy and coffee supply chains, while pilot programs in Kenya and Ghana distribute solar-powered PCR kits under multilateral food-security grants.

Regulatory Landscape
Phytopathological disease diagnostics are governed by a mix of phytosanitary requirements and laboratory analytical expectations, with medical-device-style criteria appearing in some jurisdictions. International harmonization is anchored by the International Plant Protection Convention (IPPC). The IPPC Technical Panel on Diagnostic Protocols develops Diagnostic Protocols, which are adopted as annexes to ISPM 27 and recognized as international standards under the WTO SPS Agreement, so aligning with ISPM 27 is a practical prerequisite for tests used in official controls and cross-border trade clearance.
In Europe, the European and Mediterranean Plant Protection Organization (EPPO) PM 7 diagnostic standards guide methods and laboratory quality practices for regulated pests, while national frameworks increasingly set out expectations for official laboratories. For example, the UK Official Controls (Amendment) Regulations 2025 (No. 102) require diagnostic methods used during official controls to comply with legislation in force or meet defined performance criteria for official laboratories, and the Windsor Framework (Retail Movement Scheme: Plant Health) (Amendment) Regulations 2026 add specific requirements around official statements and molecular testing in defined plant-health movements. In the United States, oversight varies by use case, and USDA APHIS maintains a Plant Pathogen Confirmatory Diagnostics Laboratory that develops and validates detection methods used in plant-protection decisioning.
Value Chain Analysis
The value chain begins with assay design and reagent inputs (primers/probes, antibodies, enzymes, buffers, lateral-flow materials), supported by instrument and reader OEMs (portable fluorometers, PCR/LAMP devices, imaging hardware) and sample-collection consumables. Upstream development also depends on standard methods for regulated pests, including EPPO PM 7 diagnostic protocols, and on validation work in reference and confirmatory laboratories. Those outputs then support commercialization into kits, cartridges, and services used for official controls, seed and nursery certification, and on-farm decision support.
Midstream, manufacturing and packaging are followed by distribution through ag-input channels, regional distributors, and testing-service providers that bundle diagnostics with advisory services. The chain is tightening between R&D and last-mile deployment through partnerships such as Trust Seeds, which partnered with Letgen Biotech in May 2025 to operate as an exclusive regional distributor and certified testing center for molecular diagnostic kits in MENA, and CSP Labs and SensTek Diagnostics, which signed a partnership and licensing agreement in April 2026 to deploy a portable LAMP-based diagnostics platform for agriculture. Downstream, adoption is carried out by research institutes, specialized laboratories, cooperatives, and mobile agronomy units, with data workflows increasingly connecting field results to cloud dashboards for surveillance, reporting, and treatment decisions. Bottlenecks remain around laboratory accreditation, method harmonization for newer modalities such as high-throughput sequencing, and procurement affordability for point-of-care deployments.
Competitive Landscape
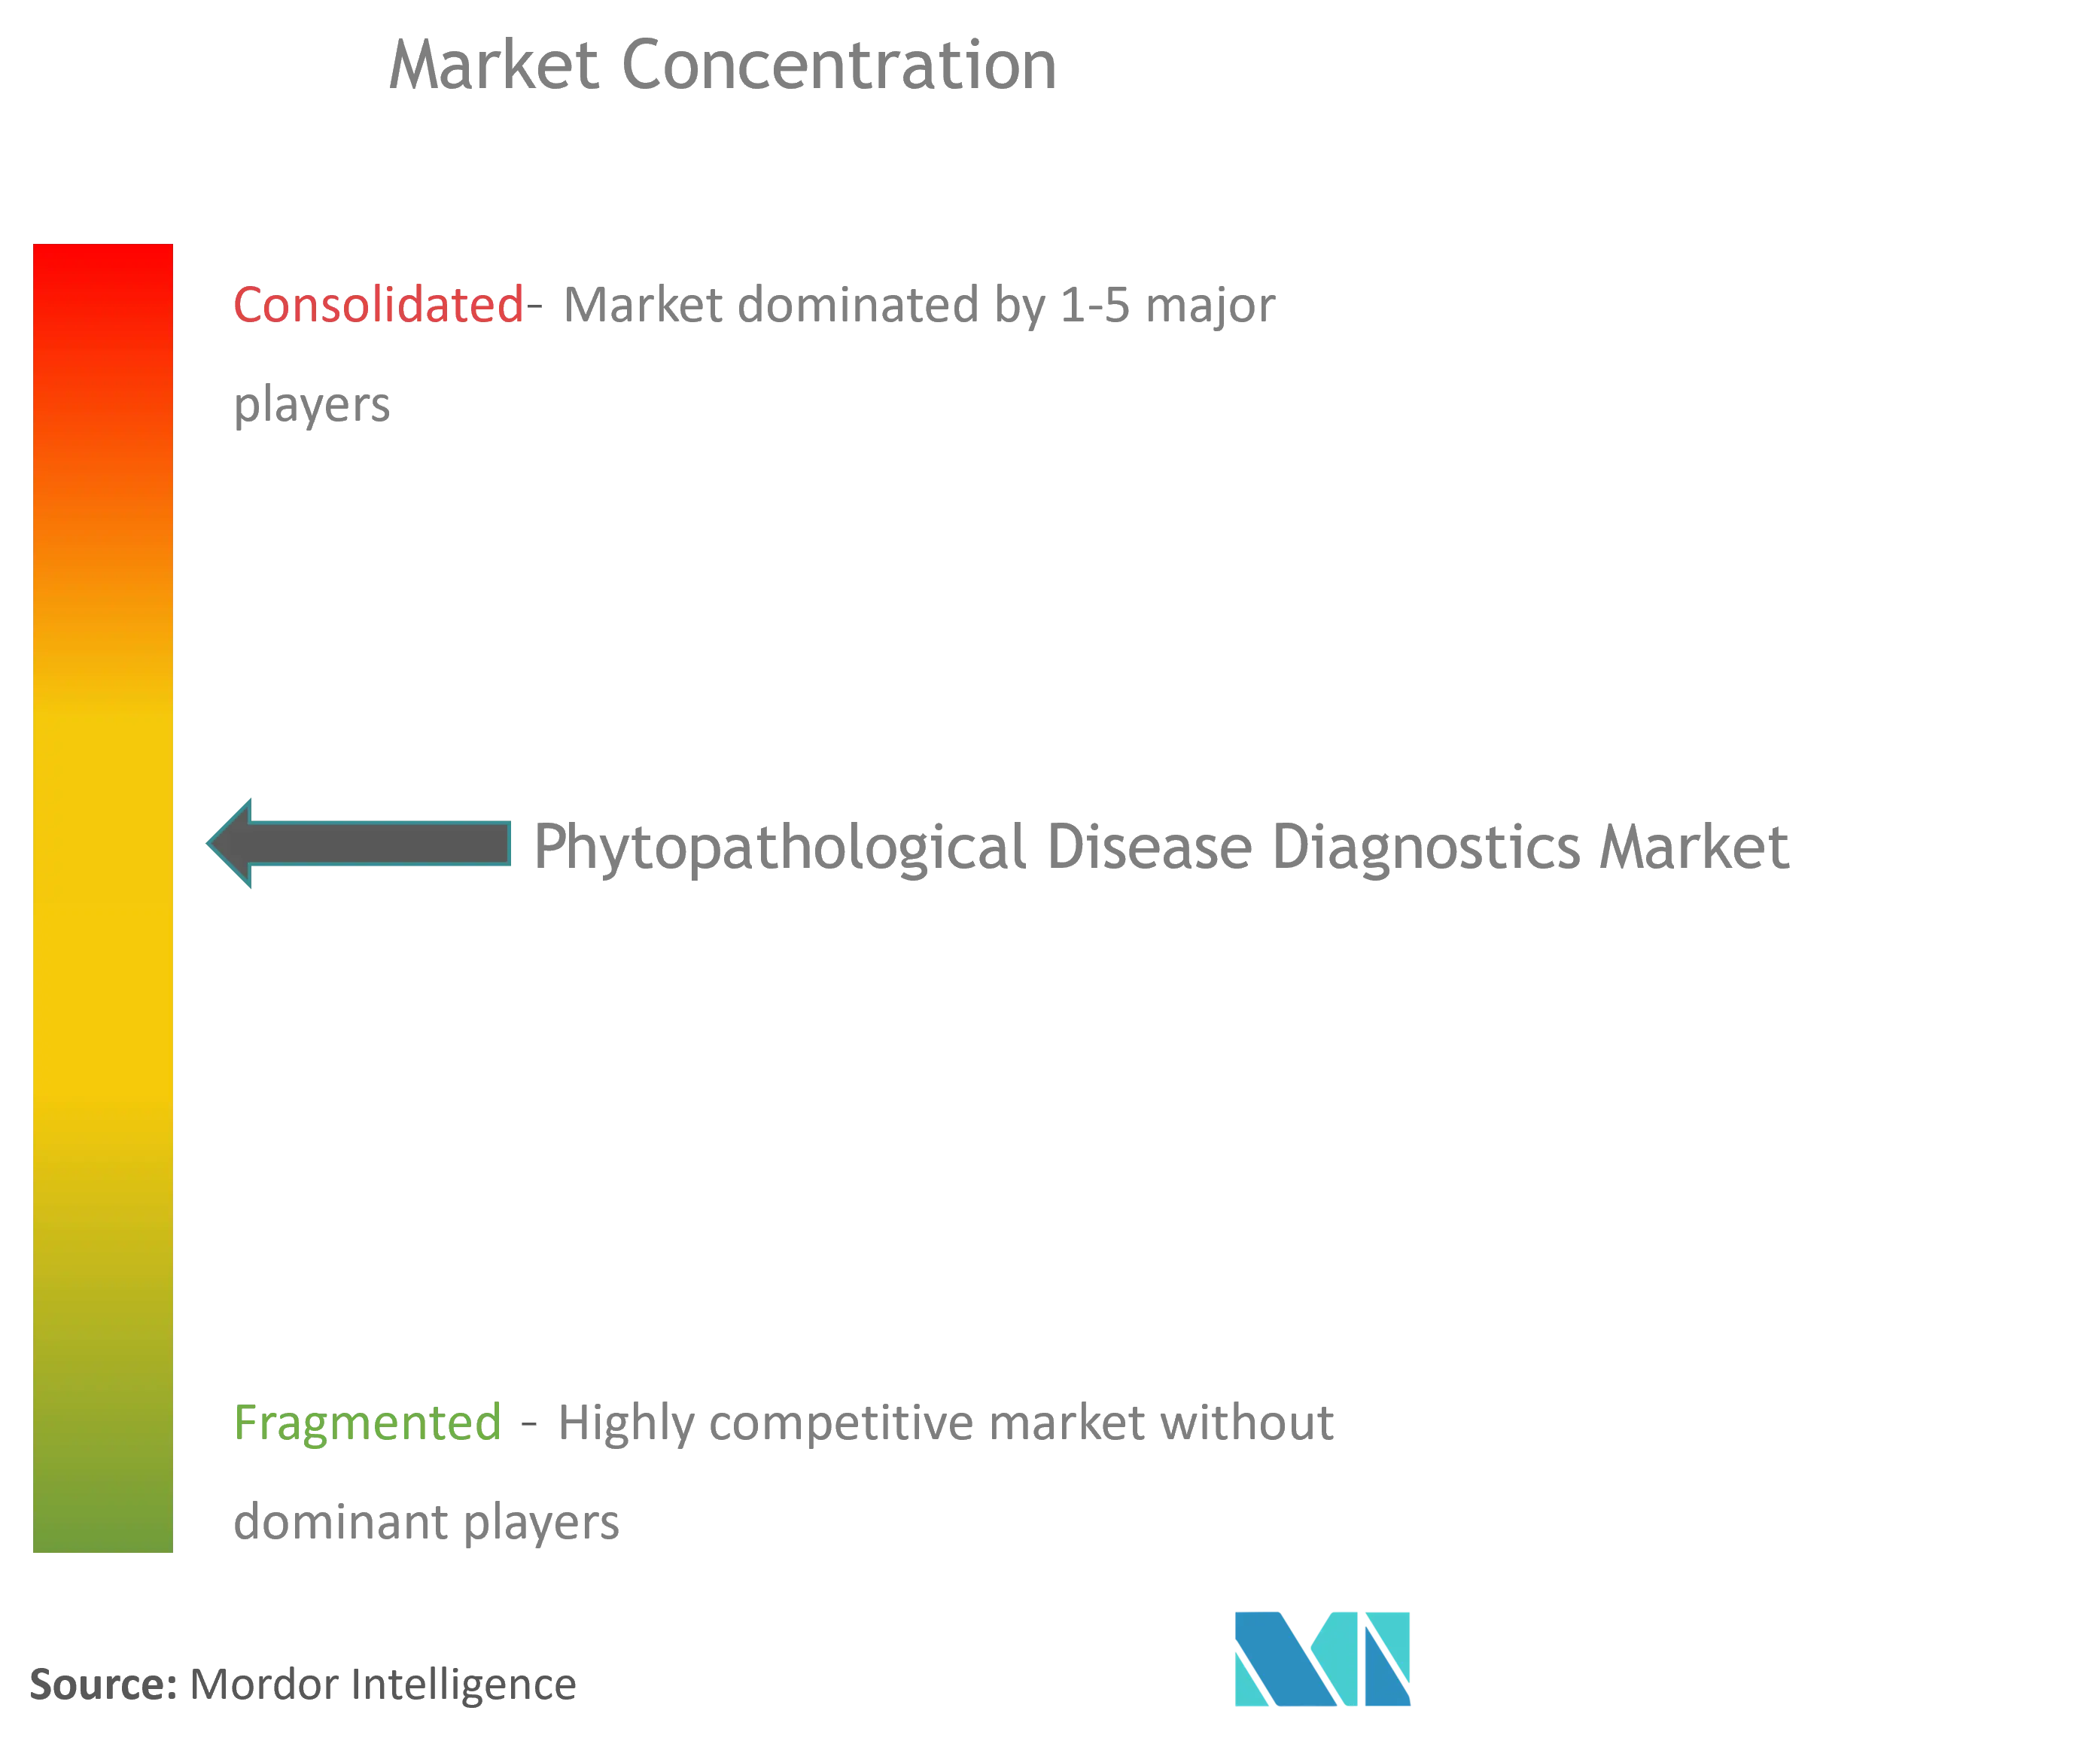
The market remains moderately fragmented, split between diversified diagnostics giants and focused agricultural specialists. Thermo Fisher, Abbott and Roche repurpose proven human IVD platforms—PCR cyclers, immunoassay analyzers—adapting chemistry sets to plant matrices. Crop-centric companies such as Agdia, Neogen and Eurofins Agroscience push niche innovations, including antibody lines bred in transgenic maize to lower reagent costs. Competition converges on point-of-care performance, where accuracy, cartridge price and cloud-connectivity define buying decisions.
Strategic acquisitions shape capability stacks. bioMérieux paid EUR 111 million for Norway-based SpinChip Diagnostics in January 2025 to add a centrifugal microfluidics platform that delivers whole-blood immunoassays—or plant sap equivalents—in 10 minutes [2]Source: bioMérieux SA, “Completion of SpinChip Diagnostics Acquisition,” biomerieux.com . The deal follows Eurofins’ 2024 purchase of Verdelab, which deepened its fungal genetics know-how. Venture-funded entrants such as PlantDiag overlay convolutional neural networks on spectral imagery, while sensor start-ups stitch spore-trap data into AI forecasts, targeting spray-budget optimization for row-crop farms.
Barriers to entry revolve around regulatory dossiers, cross-disciplinary talent and reagent supply security. Companies able to integrate hardware, chemistry and software under a single service-level contract enjoy pricing power. Conversely, firms relying on third-party cloud engines face data-sovereignty pushback in Europe and parts of Asia, tilting advantage toward vertically integrated incumbents. Over 200 start-ups operate in the broader phytopathological disease diagnostics market, yet exits remain concentrated; observers expect further consolidation as owners seek scale economies ahead of next-gen sensor roll-outs.
Global Phytopathological Disease Diagnostics Industry Leaders
Creative Diagnostics
Agdia, Inc.
Norgen Biotek Corp.
Abingdon Health
TwistDx Limited
- *Disclaimer: Major Players sorted in no particular order
Global Phytopathological Disease Diagnostics Market Companies Covered in this Report
- Roche
- Abbott Laboratories
- Siemens Healthineers
- Danaher (Cepheid / Beckman Coulter)
- Thermo Fisher Scientific
- QIAGEN
- Illumina
- bioMérieux
- Hologic
- Beckton Dickinson
- Sysmex
- GE Healthcare
- Koninklijke Philips
- Agilent Technologies
- PerkinElmer
- Quest Diagnostics
- LabCorp
- Guardant Health
- PathAI
- Canon
- Bio-Rad Laboratories
- Beckman Coulter Life Sciences
- Danaher – Radiometer
Read Analysis of Global Phytopathological Disease Diagnostics Companies

Market Opportunities and Future Outlook
A key opportunity sits at the intersection of public plant-health programs and scalable diagnostic capacity. In Fiscal Year 2026, mandatory funding increased to USD 90 million for the US National Clean Plant Network (under 7 U.S. Code Section 7721) to support pathogen elimination and diagnostic services, which directly underpins demand for validated assays, lab workflows, and service throughput across high-value planting material. At the same time, the UK International Action Plan for Plant Health 2026 to 2030 explicitly supports the IPPC objective of establishing a global network of diagnostic laboratory services, creating whitespace for standardized test menus, proficiency testing, and interoperable reporting across borders.
Technology whitespace continues to open in pre-symptomatic and in-field detection as imaging, AI, and molecular methods converge into deployable workflows. 2026 academic deployments and prototypes such as PlantVillage-enabled banana disease diagnostics (LAMP plus AI in an Android app) and portable spectral imaging with optimized deep learning for latent-stage maize rust show a practical path from lab models to extension and farm-gate use, while also pointing to unmet needs in validation, ruggedization, and harmonized performance criteria for official use. Commercial players that pair field-ready molecular kits with clear operating protocols, data pipelines, and service models can capture spend from cooperatives, seed and nursery certification, and government-supported surveillance programs that require traceable, repeatable diagnostic outputs.
Recent Industry Developments in Global Phytopathological Disease Diagnostics Market
- April 2026: CSP Labs and SensTek Diagnostics signed a partnership and licensing agreement to deploy a portable LAMP-based diagnostics platform for agriculture. The collaboration aims to accelerate field-ready testing and data integration for surveillance and decision support. It signals a shift toward portable, interoperable diagnostics across regional supply chains and testing networks.
- June 2025: Phytoform and Corteva formed a partnership to enhance corn disease resistance using AI-guided gene edits that remove foreign DNA. The collaboration links upstream crop-trait development with downstream diagnostic demand by increasing the need for verification, monitoring, and stewardship testing across breeding and deployment programs. It also raises the value of rapid assays that can track pathogen pressure and trait performance in-field.
- September 2024: Eurofins Agroscience Services acquired Verdelab Bioscience to expand phytopathology service capabilities. The deal strengthens Eurofins' capacity in fungal genetics and related testing services, supporting higher-throughput diagnostics for growers, seed companies, and regulators. It also increases competitive pressure on independent laboratories through broader test menus and integrated laboratory networks.


Global Phytopathological Disease Diagnostics Market Report Scope and Research Methodology
Market Definition and Coverage
This market covers revenue generated from tools used to detect and confirm plant diseases, starting from sample collection through test completion. It includes lab and field diagnostics that identify pathogens in crops and related plant systems so that treatment, quarantine, or seed choices can be made.
Scope exclusions: We exclude crop protection chemicals, general farm management software that does not perform diagnostics, and animal health testing.
Segments Covered in This Report
- By Technology
- Molecular Diagnostics
- Immunodiagnostics
- Digital Pathology
- Imaging-Based Diagnostics
- Point-of-Care Molecular
- Liquid Biopsy
- Proteomics & Multi-omics Tests
- By Disease Area
- Oncology
- Cardiology
- Infectious Diseases
- Neurological Disorders
- Autoimmune Diseases
- Metabolic & Endocrine Disorders
- By End User
- By Geography
- North America
- United States
- Canada
- Mexico
- Europe
- Germany
- United Kingdom
- France
- Italy
- Spain
- Rest of Europe
- Asia-Pacific
- China
- India
- Japan
- South Korea
- Australia
- Rest of Asia-Pacific
- South America
- Brazil
- Argentina
- Rest of South America
- Middle East and Africa
- GCC
- South Africa
- Rest of Middle East and Africa
- North America
Data Sources, Market Sizing, and Validation
Desk Research
Desk work starts with mapping what is being tested, how often testing is carried out per crop cycle, and which technologies are most used in routine plant health screening. We rely on public sources such as FAOSTAT, USDA and APHIS releases, Eurostat, and advisories from national plant protection organizations, which help track harvested area exposure, outbreak notices, and quarantine pressure.
Next, we connect those demand signals to market activity using peer reviewed phytopathology journals, patent databases for assay and kit innovation, customs and trade statistics for relevant diagnostic inputs, and company annual reports and investor presentations for revenue cues and product mix indicators. Where available, paid company financials and intelligence help cross-check scale and regional flow patterns, and an import and export shipment level database is used to validate directional trade movements for diagnostic inputs. These desk sources are illustrative and not exhaustive, and we also reviewed other public documents for data collection, validation, and clarification.
Primary Interviews and Surveys
Primary discussions are used to pressure test what desk data cannot fully show, such as typical testing frequency per crop season, the share of field kit adoption versus lab workflows, and pricing shifts by technology type. Interviews cover kit and reagent suppliers, testing service labs, agronomy advisors, and research users, with coverage across APAC, EMEA, and the Americas so the model assumptions can be adjusted before finalizing the approach.
Distribution of primary research fieldwork respondents
| Company type | Respondent position | Region |
|---|---|---|
| Top tier: 28% | CXOs: 16% | APAC: 48% |
| Mid tier: 50% | Functional/Unit leaders: 24% | EMEA: 31% |
| Smaller Players: 22% | Managers: 60% | Americas: 21% |
Market-Sizing & Forecasting
Market sizing is built using a top-down and bottom-up mix, where the main structure comes from a demand pool reconstructed from crop exposure and testing behavior, and then checked with supply-side reality. We start with crop and plantation footprints, disease and outbreak intensity signals, and typical testing rates by crop cycle, and then translate those into test volumes by technology type.
To convert activity into value, we apply average selling price ranges for key diagnostic routes, such as PCR and isothermal molecular tests, immunoassays like ELISA, lateral flow field kits, and supporting reagents and consumables. Other inputs that stabilize the model include seasonality of testing around planting and harvest, the share of regulated pathogens that trigger mandatory screening, and the split between in-house lab testing versus outsourced service labs. When data is patchy in smaller countries, we use proxy crop baskets and similar regulatory profiles, and then re-check the implied per-hectare testing intensity with interview feedback.
For forecasting, we use scenario analysis supported by trend lines on crop area, biosecurity enforcement, and technology uptake, and then the final trajectory is reviewed against expected ASP progression and product mix changes described by practitioners. The result is a repeatable set of steps that can be refreshed each year without relying on hard-to-access internal data.
Data Validation & Update Cycle
Outputs are validated by comparing modeled revenues against independent signals, such as changes in regulated pest lists, reported outbreak waves, and trade flow direction for key diagnostic inputs. If a region shows an unusual jump, the assumptions are re-opened, and follow-up calls are triggered to confirm whether it reflects genuine demand change or a one-time procurement pattern.
Before sign-off, the full model goes through multi-step analyst reviews that include variance checks across regions, cross-checks against historical growth rates, and consistency checks between volume and price movement. Reports are refreshed annually, and interim updates are made when material events occur, such as major biosecurity policy changes or sharp shifts in crop planting patterns. Right before delivery, a fresh final review is completed so clients receive the latest updated view.
Mordor Intelligence's Phytopathological Disease Diagnostics Market Size Versus Other Published Estimates
Published market values for phytopathological disease diagnostics can look far apart because the scope is not always treated the same way, and the base year, currency timing, and included revenue lines differ. Differences also come from how firms estimate test volume versus pricing, and how often their assumptions are refreshed.
Some sources appear to focus mainly on kit and consumable sales tied to crop testing workflows, which keeps totals in the millions range. In Mordor Intelligence, the figure is built as a broader plant disease diagnostics revenue pool that also counts instruments and related diagnostic hardware used in labs and in-field settings, which expands the total into a much larger value band.
Benchmark comparison
| Source | Market Size | Gaps in Research Methodology |
|---|---|---|
| Mordor Intelligence | USD 112.91 B (2026) | |
| Trade Publisher A | USD 107.80 M (2024) | Uses a narrower product view centered on kits and probes, with a 2024 base year and longer-dated forecast window, so instruments and broader diagnostic hardware revenue are not consistently captured. |
| Regional Consultancy B | USD 99.88 M (2024) | Anchors estimates to 2024 kit-level demand and typical test categories, and the methodology appears to emphasize consumables and software add-ons more than installed hardware and laboratory instrument value. |
The spread in the table is mainly explained by what is counted as diagnostics revenue and how the value is constructed from volumes and prices. By keeping assumptions tied to observable testing activity, regulated disease pressure, and realistic ASP ranges, our approach aims to stay transparent and easier to replicate across regions and years.


Key Questions Answered in the Report
What is the current value of the phytopathological disease diagnostics market?
– The market is valued at USD 112.91 billion in 2026 and is projected to rise to USD 152.63 billion by 2031.
Which technology segment is expanding the fastest?
– Liquid biopsy platforms are growing at a 7.18% CAGR owing to real-time, non-destructive sap analysis.
Why is Asia-Pacific the fastest-growing regional market?
– Large-scale digitization of farms, supportive government financing and frequent pathogen outbreaks drive an 7.74% regional CAGR.
How do CRISPR-based assays improve diagnostics?
– CRISPR-Cas13a systems boost sensitivity and speed, enabling detection of low-viral-load infections directly in the field.
What limits widespread adoption of advanced diagnostics?
– High capital costs, fragmented regulation and a shortage of data-science talent remain primary barriers.
Page last updated on:


 Your data is secure and never sold or shared.


