Cancer Diagnostics Market Size and Share
Market Overview
| Study Period | 2020 - 2031 |
|---|---|
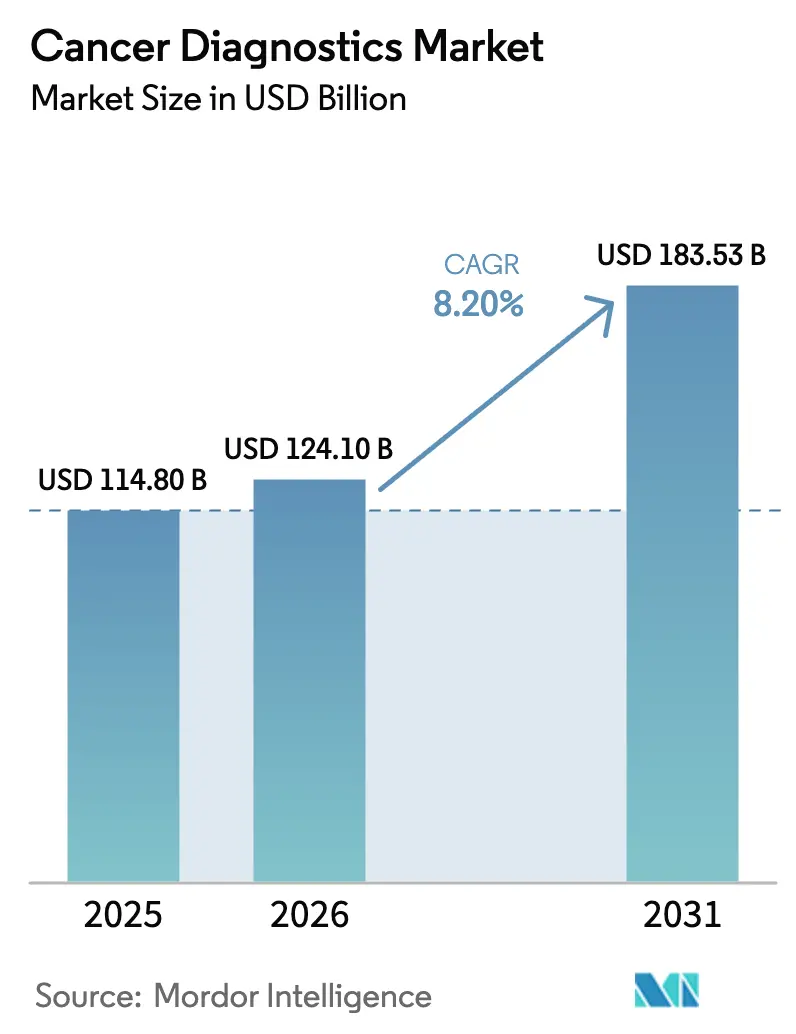
| Market Size (2026) | USD 124.10 Billion |
| Market Size (2031) | USD 183.53 Billion |
| Growth Rate (2026 - 2031) | 8.20% CAGR |
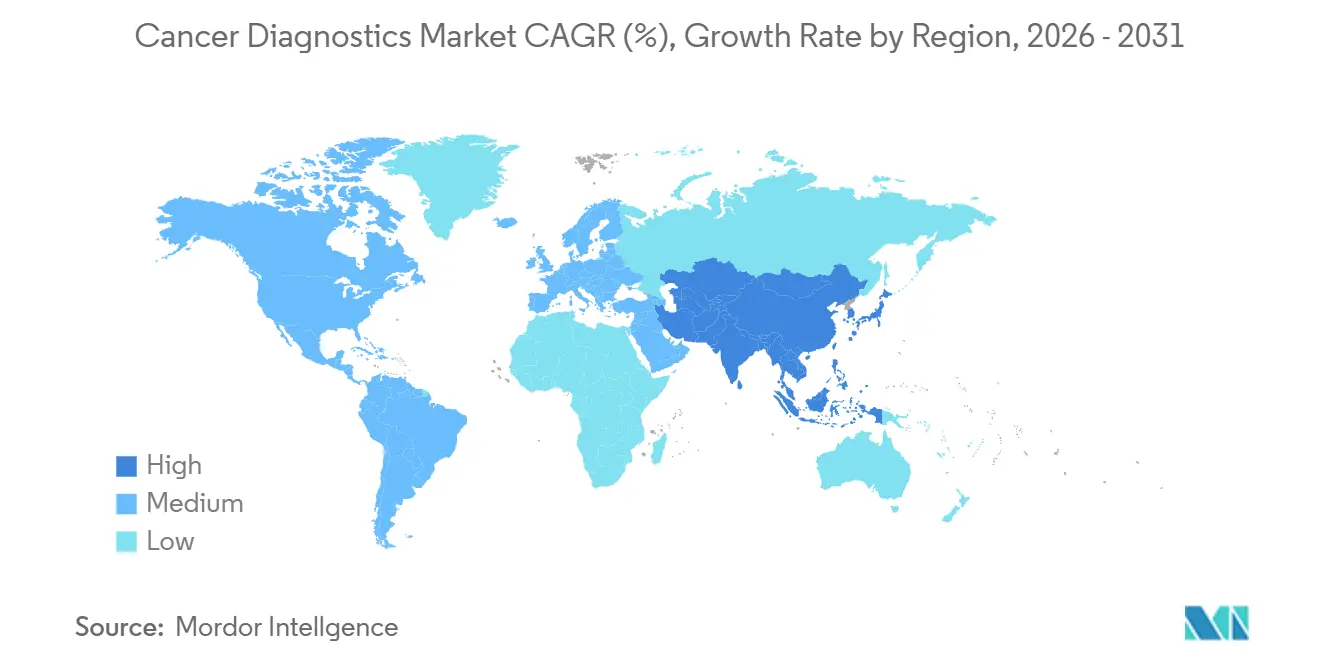
| Fastest Growing Market | Asia Pacific |
| Largest Market | North America |
| Market Concentration | Medium |
Major Players *Disclaimer: Major Players sorted in no particular order Image © Mordor Intelligence. Reuse requires attribution under CC BY 4.0. | |
Cancer Diagnostics Market Analysis by Mordor Intelligence
The Cancer Diagnostics Market size is projected to expand from USD 114.80 billion in 2025 and USD 124.10 billion in 2026 to USD 183.53 billion by 2031, registering a CAGR of 8.20% between 2026 to 2031.
Growing public funding for population-level screening, rapid commercialization of liquid-biopsy platforms that deliver molecular insights within 48 hours, and AI-driven image analytics that standardize interpretation are the primary engines of expansion. North America retained the largest share in 2025 as hospital networks continued to invest in central-laboratory automation, yet policy reforms across China and India are redirecting future momentum to Asia-Pacific. Hospitals still anchor procurement, but portable imaging systems and microfluidic cartridges are moving tests into community clinics, trimming the interval between suspicion and diagnosis from weeks to hours. Intensifying competition among integrated platform players and emerging liquid-biopsy firms is accelerating product cycles, while reimbursement wins for multi-cancer early-detection assays are widening the addressable patient pool.
Key Report Takeaways
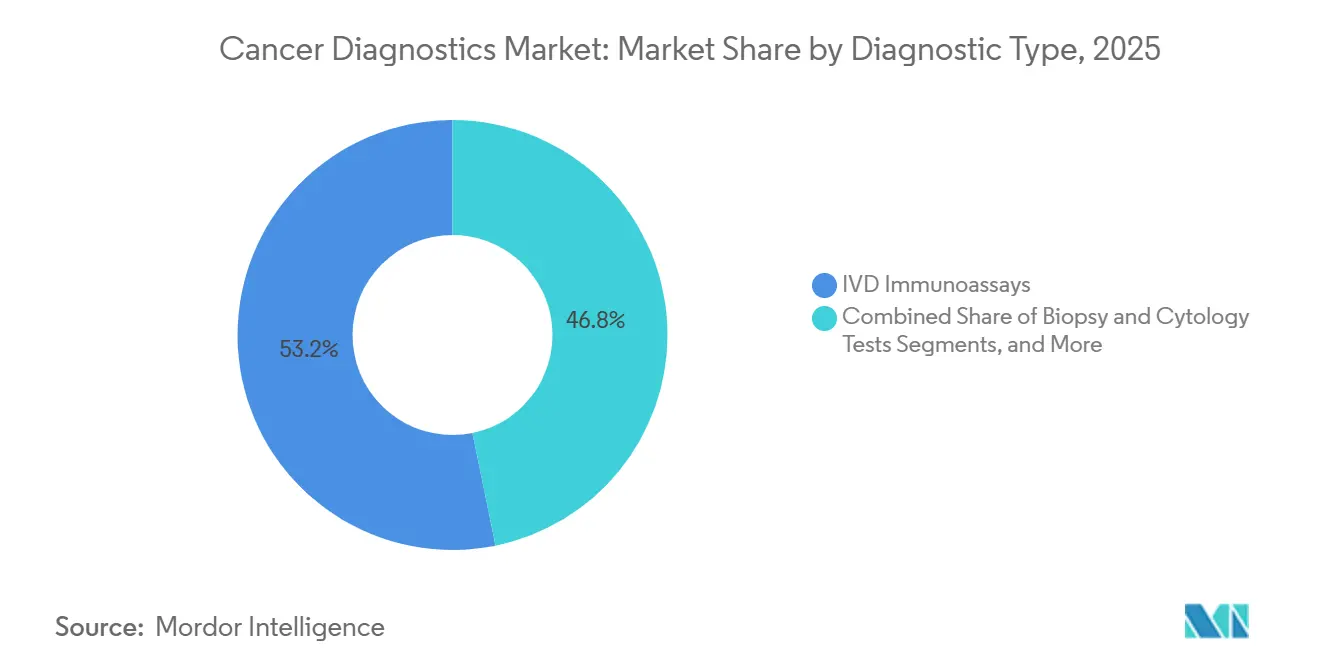
- By diagnostic type, IVD immunoassays led with 53.22% revenue share in 2025, whereas genomic and liquid-biopsy tests are forecast to advance at a 9.29% CAGR through 2031.
- By cancer type, breast cancer generated 26.58% of demand in 2025, while lung cancer diagnostics are positioned to grow most quickly at a 9.97% CAGR to 2031.
- By end user, hospitals accounted for 53.14% of outlays in 2025, yet point-of-care and ambulatory centers are projected to expand at a 10.11% CAGR over the same horizon.
- By geography, North America captured 39.26% in 2025, whereas Asia-Pacific is set to rise at an 8.92% CAGR, the fastest regional pace.
Note: Market size and forecast figures in this report are generated using Mordor Intelligence’s proprietary estimation framework, updated with the latest available data and insights as of January 2026.
Global Cancer Diagnostics Market Trends and Insights
Drivers Impact Analysis*
| Driver | (~) % Impact on CAGR Forecast | Geographic Relevance | Impact Timeline |
|---|---|---|---|
| Increasing Government-Funded Screening Programs | +1.8% | Global, strongest in China, India, United States, European Union | Medium term (2–4 years) |
| Rising Global Cancer Incidence & Aging Population | +1.5% | Global, pronounced in Asia-Pacific and Europe | Long term (≥ 4 years) |
| Rapid Adoption of Liquid-Biopsy & ctDNA Tests | +1.4% | North America and Europe, extending to urban Asia-Pacific | Short term (≤ 2 years) |
| Expansion of Point-of-Care Imaging & Diagnostics | +1.2% | North America, Western Europe, major APAC cities | Medium term (2–4 years) |
| AI-Driven Multi-Omics Early Detection Platforms | +1.0% | North America, EU, Japan, South Korea | Medium term (2–4 years) |
| Decentralized Microfluidic Sample-to-Answer Systems | +0.9% | Global, early traction in rural United States, India, Sub-Saharan Africa | Long term (≥ 4 years) |
| Source: Mordor Intelligence | |||
Increasing Government-Funded Screening Programs
Governments now treat cancer screening as essential infrastructure because early detection reduces treatment spending by as much as 60–80% compared with late-stage therapy. China’s Healthy China 2030 plan also seeks to alleviate the financial burden on citizens by recommending reducing individual out-of-pocket health costs to 25% by 2030. To support these goals, China is heavily investing in biotech innovation and digital health, specifically targeting 3 registered doctors and 4.7 registered nurses per 1,000 residents by 2030. In 2024, the Health Resources and Services Administration (HRSA) awarded nearly USD 9 million to 18 health centers through the Accelerating Cancer Screening (AxCS) program to improve access to screening services, such as colorectal cancer screening. In India, a nationwide screening campaign for non-communicable diseases (NCDs), including oral, breast, and cervical cancers, was launched from February 20, 2025, to March 31, 2025, targeting individuals aged 30 and above across the country. Furthermore, the Union Budget 2025-26 announced plans to establish 200 Day Care Cancer Centres in district hospitals across India to decentralize cancer care and improve accessibility. Collectively, these programs elevate baseline testing volumes, enhance vendor visibility, and make long-term contracts contingent on interoperability with national health information. exchanges.
Rising Global Cancer Incidence & Aging Population
In 2025, around 2 million new cancer cases and 0.6 million cancer deaths were projected to occur in the United States. The share of the global population aged 65 and older will move from 10% in 2025 to 16% by 2050, pushing demand in regions where oncologist density remains below OECD norms.[1]United Nations Population Division, “World Population Prospects,” UN.ORG Japan and South Korea, with median ages above 48, now reimburse liquid-biopsy panels alongside biennial imaging for citizens over 40, aiming to offset specialist shortages through automation. China’s oncologist-to-population ratio is half the OECD average, prompting rapid adoption of AI-assisted pathology platforms that maintain throughput despite workforce gaps. The demographic trajectory ensures sustained test volume growth, but it also underscores the urgency of decision-support software to prevent bottlenecks.
Rapid Adoption of Liquid-Biopsy & ctDNA Tests
Between 2024 and 2026, liquid biopsies progressed from research tools to reimbursed clinical assays after evidence showed they detect recurrence an average of 8.7 months earlier than imaging.[2]New England Journal of Medicine, “Circulating Tumor DNA Detection,” NEJM.ORG The U.S. FDA granted breakthrough status to four multi-cancer early-detection tests in 2025, and Medicare finalized nationwide coverage in January 2026 for 41 million beneficiaries. Germany and France followed with national reimbursement in 2025, confirming a pan-Atlantic consensus on clinical utility. Guardant Health’s Guardant360 CDx volumes climbed 67% year-on-year in H1 2025, reflecting oncologists’ preference for non-invasive profiling. Turnaround times fell to five days by 2026 after laboratories automated DNA extraction and library prep, making blood-based testing viable for same-week treatment planning.
Expansion of Point-of-Care Imaging & Diagnostics
Point-of-care devices move testing from hospital core labs to clinics, pharmacies, and even mobile vans, shortening clinical decision loops to under one hour. GE HealthCare introduced a handheld ultrasound in 2025 with AI lesion-detection that delivered 91% sensitivity for breast masses in rural U.S. trials. Siemens Healthineers followed with a benchtop immunoassay system in 2026 that processes 40 samples per hour, appealing to urgent-care centers facing space limits. Although U.S. fee-for-service payments remain lower for point-of-care tests, accountable-care organizations favor them because faster results cut referral losses and improve adherence.
Restraints Impact Analysis*
| Restraint | (~) % Impact on CAGR Forecast | Geographic Relevance | Impact Timeline |
|---|---|---|---|
| High Cost of Advanced Molecular Diagnostics | -0.9% | Global, acute in low- and middle-income nations | Medium term (2–4 years) |
| Limited Reimbursement in Low-Income Nations | -0.7% | Sub-Saharan Africa, South Asia, parts of Latin America | Long term (≥ 4 years) |
| Shortage of Trained Molecular Pathologists | -0.5% | Global, severe in Asia-Pacific and Africa | Long term (≥ 4 years) |
| Data-Privacy Concerns in AI Cloud Workflows | -0.3% | Europe, United States, China | Short term (≤ 2 years) |
| Source: Mordor Intelligence | |||
High Cost of Advanced Molecular Diagnostics
Next-generation sequencing and liquid-biopsy assays list between USD 2,800 and USD 5,000, a level unaffordable in regions where annual health spending per capita is below USD 500. In India, a USD 3,500 genomic panel equals 1.4 times the median monthly household income, restricting uptake to metropolitan centers. Kenya’s public insurance pays only USD 12 for a complete blood count and offers no coverage for genomic tests, leaving private patients to spend three months’ wages on a single BRCA assay. Even in the United States, high-deductible plans shift USD 1,000 or more to patients, leading 23% of eligible individuals to forego testing in 2025. Manufacturers are rolling out slimmed-down 50-gene panels priced near USD 1,000, but these miss actionable mutations in almost one in five cases.
Limited Reimbursement in Low-Income Nations
Health ministries in low- and middle-income countries still prioritize infectious disease and maternal health, delaying reimbursement for cancer diagnostics. Nigeria’s national scheme covers only 4% of the population and finances basic pathology while excluding molecular tests, contributing to 68% of cancers being discovered at stage III or IV. Bangladesh added mammography to its essential benefits in 2024 but had no budget for equipment in 58 of 64 districts. Indonesia reimburses liquid-biopsy assays at USD 150, just 5% of commercial pricing, so laboratories opt out, and patients must self-pay. The World Bank disbursed USD 340 million in 2025 for screening pilots across a dozen nations, but most programs remain grant-funded rather than embedded in domestic insurance systems.
*Our forecasts treat driver/restraint impacts as directional, not additive. The impact forecasts reflect baseline growth, mix effects, and variable interactions.
Segment Analysis
By Diagnostic Type: Liquid Biopsies Gain While Immunoassays Anchor Revenue
IVD immunoassays contributed 53.22% to 2025 revenue, supported by high-throughput analyzers that process up to 400 samples an hour at unit costs below USD 5.[3]U.S. Food and Drug Administration, “Breakthrough Devices Program,” FDA.GOV Genomic and liquid-biopsy platforms are projected to expand at 9.29% yearly through 2031 as coverage decisions proliferate and standard turnaround time drops to under 48 hours. Diagnostic imaging retains a mid-teens share and benefits from AI algorithms that reduce false positives by 22%, encouraging radiologist adoption. Biopsy and cytology test volumes are plateauing because oncologists now use blood-based assays for therapy selection, eliminating repeat tissue procedures. Tumor biomarker tests remain indispensable for ongoing monitoring, but grow more slowly than the overall cancer diagnostics market.
Margin profiles vary widely. Immunoassay vendors earn stable reagent revenue from broad installed bases, while genomic firms rely on intellectual-property-protected data analytics. Illumina’s NovaSeq X lowered sequencing cost per genome to USD 200, enabling laboratories to price comprehensive panels at USD 1,500 with 40% gross margins. Thermo Fisher Scientific’s sample-to-answer PCR unit delivers 28-gene detection in four hours without manual extraction, opening molecular testing to community hospitals lacking specialist staff. Regulators reinforce momentum; the FDA cleared 17 breakthrough oncology platforms in 2025, and the European Medicines Agency cut nine months off average review timelines for assays with strong clinical evidence. Consequently, immunoassays will continue to anchor revenue, but liquid biopsies will capture most incremental growth, reshaping the cancer diagnostics market by 2031.


By Cancer Type: Lung Cancer Diagnostics Accelerate on Screening Expansion
Breast cancer accounted for 26.58% of 2025 revenue, as long-standing screening guidelines ensure steady volumes for mammography, ultrasound, and genomic panels. Lung cancer diagnostics are poised to grow fastest at 9.97% through 2031, driven by expanded low-dose CT eligibility and emerging blood-based early-detection assays. The U.S. Preventive Services Task Force broadened its criteria in 2024, adding 6.4 million eligible adults, while China mandated annual CT scans for 87 million smokers in 2025. Colorectal diagnostics gain from stool-DNA tests that deliver 92% sensitivity for advanced adenomas, pushing adherence among Medicare beneficiaries to 78%.
Prostate screening is under review, yet MRI-guided biopsies launched in 2024 have significantly reduced overdiagnosis, improving payer acceptance. Low-resource settings shift cervical screening to HPV DNA tests, as Roche processed 14 million samples across India and Sub-Saharan Africa in 2025. Liver and pancreatic diagnostics remain small but promising, following a 2025 trial that reported 83% sensitivity for liquid biopsy methylation assays in early-stage pancreatic tumors. Ovarian screening still lacks high-specificity tools, and the USPSTF issued a grade D recommendation against population testing. Kidney and bladder detection hinges on incidental imaging and cystoscopy, keeping growth subdued. Segment momentum therefore pivots on technology readiness and policy alignment rather than incidence alone, propelling lung testing ahead within the cancer diagnostics market.
By End User: Ambulatory Centers Gain as Testing Decentralizes
Hospitals accounted for 53.14% of spending in 2025, thanks to capital budgets for imaging suites and sequencing labs. Yet ambulatory and point-of-care sites are forecast to rise at 10.11% annually, fueled by compact immunoassay analyzers and handheld imaging devices. Large commercial laboratories leverage scale; Quest Diagnostics processed 178 million oncology tests in 2025 at costs 40% below hospital peers, preserving mid-twenties market share. Academic centers such as Memorial Sloan Kettering convert proprietary assays into national standards, exemplified by the MSK-IMPACT panel’s ascent in U.S. oncology workflows.
Payment policy accelerates decentralization. CMS trimmed 2026 outpatient rates for imaging and lab services by 3.8% while raising ambulatory-surgery-center rates, creating a USD 150 to USD 300 per-test advantage outside hospital walls. U.S. retail chains respond; Walgreens will install diagnostic kiosks in 1,500 stores by 2027, while CVS Health co-locates blood-draw stations in 800 MinuteClinics. In India, chains such as Dr. Lal PathLabs opened 340 collection centers in tier-2 and tier-3 cities during 2025, lifting volumes 28%. Rural U.S. facilities face consolidation pressure as 19 hospitals closed in 2025, outsourcing complex testing to regional hubs. Decentralization thus re-balances procurement, but hospitals remain indispensable for multidisciplinary cases that integrate imaging, pathology, and oncology boards.

Geography Analysis
North America accounted for 39.26% of sales in 2025, underpinned by USD 12,500 per capita health spending and broad coverage for advanced diagnostics, whereas Asia-Pacific is set to rise at an 8.92% CAGR, the fastest regional pace. The regional cancer diagnostics market will sustain mid-single-digit growth as Medicare coverage for multi-cancer early detection took effect in 2026, adding 41 million reimbursed lives. The United Kingdom delayed the national liquid biopsy rollout due to a GBP 2.1 billion funding gap, signaling divergent adoption rates across Europe.
India’s Ayushman Bharat scheme covers 550 million citizens aged 50 and older. China’s domestic diagnostic chains now run 1,800 labs, driving local procurement and shortening installation cycles from 16 to six weeks. Japan’s shrinking population masks rising per-capita spending, which climbed 6.2% in 2025 after the government prioritized early detection to control late-stage therapy costs. South Korea’s screening program reached 76% participation in 2025, the highest globally, and newly reimbursed liquid-biopsy monitoring for colorectal survivors will support future test volumes. Australia expanded companion-diagnostic coverage in 2025, reinforcing a regional trend toward precision oncology reimbursement.
The Middle East and Africa remain a low-single-digit share but show targeted investment. Saudi Arabia allocated USD 1.2 billion under Vision 2030 to install 45 PET-CT scanners and set up genomic labs in three major cities. The United Arab Emirates is establishing oncology centers that integrate AI pathology, aiming to serve medical tourists. South America presents mixed signals; Brazil’s national system added mammography and colonoscopy to coverage in 2024, yet equipment shortages persist in northern states. Overall, while North America and Europe still drive absolute revenue, Asia-Pacific will contribute most net new spending, reshaping competitive focus within the cancer diagnostics market.

Regulatory Landscape
The U.S. FDA's Oncology Center of Excellence continues to shape oncology in vitro diagnostics through ongoing PMA activity and companion diagnostic oversight, with regulatory moves around high-impact assays shaping commercialization. FDA PMA approvals such as ColoSense (May 2025) and Alinity m HR HPV test (September 2025) anchor the integration of diagnostic and therapeutic decision-making in oncology.
Europe's IVDR transition continues to reset compliance timelines and Notified Body dependencies; a mid-2026 milestone arrived on May 26, 2026, when manufacturers of legacy Class C devices needed to submit formal applications to IVDR-designated Notified Bodies to access extended transition provisions. In China, the NMPA has updated oncology IVD expectations through cancer-screening clinical evaluation guidance (August 2025) and more recent NGS-oriented review modernization, including draft registration review key points released in March 2026 and Technical Review Points for Tumor Gene Variation Detection Reagents (Trial) issued in June 2026, reinforcing local-evidence and method standardization requirements for tumor mutation detection reagents.
Competitive Landscape
The five largest vendors, Roche, Abbott, Siemens Healthineers, Thermo Fisher Scientific, and Danaher, held about the majority of revenue share in 2025, indicating moderate concentration. Vertical integration defines strategy as platform makers acquire CLIA-certified laboratories to capture recurring per-test income alongside instrument sales. Illumina paved the way by absorbing GRAIL, followed by Exact Sciences’ USD 1.2 billion purchase of Genomic Health in 2025. Electronic-health-record integrations deepen moats; Exact Sciences embedded Cologuard ordering into 280 Epic-based systems, lifting volumes 19% within six months.
Emerging players use artificial intelligence to attack workflow pain points. PathAI processed 2.3 million slides in 2025 with 94% concordance to human pathologists, allowing labs to expand throughput 40% without new hires. Freenome combined ctDNA, protein biomarkers, and machine-learning classifiers in a multi-cancer assay launched in 2025, differentiating itself from single-analyte competitors. Regulatory traction is a vital filter; only 8% of Breakthrough-Device applicants won FDA designation in 2025, steering advantage toward firms with robust trial management. Patent portfolios continue to matter; Myriad Genetics’ BRACAnalysis generated USD 312 million in 2025 under method claims valid until 2029.
Regional challengers are advancing. Chinese and Indian manufacturers offer immunoassay analyzers priced up to 60% below Western equivalents, attracting cost-sensitive hospitals. Siemens Healthineers doubled Asia-Pacific manufacturing capacity with a new Shanghai plant that cut delivery lead times from 16 to six weeks. Guardant Health partnered with the U.K. National Health Service in 2025 to supply 50,000 liquid-biopsy tests annually, validating blood-based monitoring in publicly funded systems. The competitive field therefore balances scale economics against innovation speed, with data analytics and decentralized platforms opening fresh entry points across the cancer diagnostics market.
Cancer Diagnostics Industry Leaders
F. Hoffmann-La Roche Ltd
Thermo Fisher Scientific Inc.
Abbott Laboratories Inc.
Siemens Healthineers
Danaher Corporation
- *Disclaimer: Major Players sorted in no particular order

Market Opportunities and Future Outlook
Consolidation and workflow integration create whitespace in end-to-end oncology testing as vendors bundle screening, genomic profiling, MRD monitoring, and pathology interpretation into fewer platforms and contracts. Quest Diagnostics is extending access through the OncoEMR platform with MRD ctDNA and comprehensive genomic profiling services (July 2026), reducing friction from test selection through results in oncology workflows. Regulatory and reimbursement catalysts add to commercial headroom, with Medicare nationwide coverage finalized in January 2026 for multi-cancer early-detection testing broadening reimbursed access, and legislative activity like H.R. 842 proposing Medicare coverage for MCED starting January 1, 2028 signaling continued emphasis on earlier detection.
Manufacturers and laboratories that can meet EU IVDR transition demands and China NMPA local-evidence expectations, while delivering faster turnaround and interoperable reporting, have clearer pathways to expand menus and placements across hospitals, independent labs, and decentralized care sites.
Recent Industry Developments
- June 2026: Roche announced FDA approval for the VENTANA PTEN (SP218) RxDx Assay, an immunohistochemistry companion diagnostic to identify PTEN protein loss in prostate adenocarcinoma patients eligible for AstraZeneca's TRUQAP therapy. The approval strengthens therapy-linked diagnostic pull-through and reinforces co-development dynamics between diagnostic vendors and biopharma labels.
- March 2026: Abbott completed its acquisition of Exact Sciences, adding major cancer screening and precision oncology assets including Cologuard and Oncotype DX. The combination increases scale for integrated screening-to-treatment diagnostic pathways and intensifies competition for long-term payer contracts.
- June 2025: FDA clearance for Clairity Breast expands AI based risk stratification within standard mammography workflows, enabling earlier risk-based prioritization in screening programs. The move underscores growing integration of software into routine imaging workflows and supports risk-informed screening pathways.


Research Methodology Framework and Report Scope
Market Definition and Coverage
This market covers revenues tied to diagnosing cancer in humans, including lab-based tests and pathology workups, imaging used for detection and staging, and related diagnostic services delivered in hospitals and independent labs.
Scope exclusions: cancer treatment revenues, including oncology drugs, radiation therapy equipment, and therapeutic procedures, are not counted in this market size.
Segmentation Overview
- By Diagnostic Type
- Diagnostic Imaging Tests
- Biopsy & Cytology Tests
- Tumor Biomarkers
- Genomic / Liquid-Biopsy Tests
- IVD Immunoassays
- Other Diagnostic Types
- By Cancer Type
- Breast Cancer
- Lung Cancer
- Colorectal Cancer
- Cervical Cancer
- Prostate Cancer
- Kidney Cancer
- Liver Cancer
- Pancreatic Cancer
- Ovarian Cancer
- Other Cancer Types
- By End User
- Hospitals
- Diagnostic Laboratories
- Academic & Research Institutes
- POC / Ambulatory Centres
- By Geography
- North America
- United States
- Canada
- Mexico
- Europe
- Germany
- United Kingdom
- France
- Italy
- Spain
- Rest of Europe
- Asia-Pacific
- China
- Japan
- India
- South Korea
- Australia
- Rest of Asia-Pacific
- Middle East & Africa
- GCC
- South Africa
- Rest of Middle East & Africa
- South America
- Brazil
- Argentina
- Rest of South America
- North America
Data Sources, Market Sizing, and Validation
Desk Research
Desk research started with public health and utilization signals that can be checked year over year, such as cancer incidence and screening uptake. We used World Health Organization materials, International Agency for Research on Cancer outputs, US CDC and US National Cancer Institute publications, and OECD health statistics to anchor the demand pool and to confirm the direction of test volumes.
We then reviewed manufacturer and service-provider disclosures to understand product mix, regional exposure, and any pricing comments, drawing on annual reports, investor presentations, and regulator and reimbursement publications. In parallel, patent databases and peer reviewed clinical journals helped us sense which modalities were expanding in real practice, including liquid biopsy and advanced imaging workflows. For cross-checks, we also used paid subscriptions focused on company financials and intelligence, news and financials, and patent coverage. These sources are illustrative only, and many other public references were used to collect data, validate assumptions, and clarify unclear points.
Primary Interviews and Surveys
Primary work focused on interviews and short surveys with diagnostic laboratory leaders, hospital pathology and radiology decision-makers, test developers, distributors, and domain experts across major regions, so any gaps from desk findings could be closed. We used respondent input to validate test utilization trends, the typical pricing movement by modality, and the practical split between product revenues and service fees. Those checks then helped triangulate the final market totals.
Distribution of primary research fieldwork respondents
| Company type | Respondent position | Region |
|---|---|---|
| Top tier: 33% | CXOs: 12% | APAC: 50% |
| Mid tier: 51% | Functional/Unit leaders: 28% | EMEA: 31% |
| Smaller Players: 16% | Managers: 60% | Americas: 19% |
Market-Sizing & Forecasting
Sizing uses a top-down approach where the diagnosed and screened population, modality mix, and procedure and test utilization are reconstructed by region, then converted into revenue using reasonable average selling prices and service fee ranges. To keep totals realistic, we corroborate the model with selective bottom-up approximations such as sampled supplier revenue splits, channel checks for reagent and instrument placements, and volume times ASP for high-usage test categories. When a mismatch persists, the model is adjusted rather than left as-is.
Key inputs include cancer incidence and prevalence direction, screening participation by age cohort, imaging procedure volumes in high-burden cancers, pathology and biopsy workflow intensity, and the adoption curve for molecular testing, including liquid biopsy where reimbursed. Pricing is handled carefully because it varies by region and setting, so we used a mix of list price signals, reimbursement cues, and expert-validated discounting patterns. We then converted currencies using consistent annual averages. For forecasting, we relied on scenario analysis supported by measurable drivers, such as expected cancer burden growth, screening program expansion, and the pace of technology adoption, and we stress-tested those paths with expert views to avoid overly aggressive growth assumptions. Where bottom-up data is thin, we used conservative penetration ranges and rechecked implied per-patient diagnostic spending against healthcare utilization patterns.
Data Validation & Update Cycle
Validation runs in layers so no single weak input drives the final number. We cross-check the modeled totals against independent signals such as diagnostic imaging utilization trends, reported diagnostics revenue trajectories, and shifts in testing mix. We also review outliers by region and modality before sign-off. When variance is large, the team re-contacts relevant experts and revisits the input that drives the gap, which commonly sits in pricing, procedure volume, or mix assumptions.
Each report is refreshed on an annual cycle, and interim updates are made when material events occur, such as major reimbursement changes or step-ups in screening programs. Before delivery, an analyst performs a fresh pass on key inputs and conversions so clients receive an updated view that reflects the latest available public and primary signals.
Mordor Intelligence's Cancer Diagnostic Market Size Versus Other Published Estimates
Published market sizes for cancer diagnostics can look far apart even when they appear to cover the same topic, because included revenue streams and the base year do not always align. Differences typically come from what is counted as a diagnostic service versus a product sale, how imaging and pathology are treated, and whether pricing is normalized to reimbursement or left closer to list prices.
Therapy-related oncology revenues sit outside Mordor Intelligence's scope, which is one reason the 2025 figure below does not move in line with estimates that blend diagnosis with adjacent treatment spending or broader oncology care budgets. Another recurring gap driver is refresh cadence and currency timing, since a 2024 base built with earlier FX rates and slower updates can understate or overstate the current run-rate, particularly when imaging and molecular testing mix shifts quickly.
Benchmark comparison
| Source | Market Size | Gaps in Research Methodology |
|---|---|---|
| Mordor Intelligence | USD 114.87 B (2025) | |
| Global Research Publisher A | USD 109.61 B (2024) | Uses a 2024 base year and a different growth window, and service revenues can be treated more narrowly, which reduces the captured run-rate when procedure volumes rise faster than product shipments. |
| Industry Research Publisher B | USD 110.11 B (2024) | Broad category coverage is shown, but methodology visibility on pricing normalization and currency handling is limited, which can shift the total when reimbursement-linked ASPs diverge from list prices across regions. |
Overall, the spread is explained less by math and more by what gets counted and how fast the underlying inputs are refreshed. By tying totals back to patient and procedure indicators, and then checking them against revenue signals from products and diagnostic services, we end up with a market size that can be traced back to clear variables and repeated year to year with the same steps.


Key Questions Answered in the Report
How large will be the cancer diagnostics market in 2026?
The cancer diagnostics market size is USD 124.10 billion in 2026.
Which diagnostic type is expanding the fastest?
Genomic and liquid-biopsy platforms are projected to record the highest growth, advancing 9.29% annually through 2031.
Why is Asia-Pacific the fastest-growing region?
National screening mandates in China and India, combined with rising private insurance coverage, drive an 8.92% regional CAGR.
What restraints could slow future growth?
High per-test costs and limited reimbursement in low-income nations remain the main barriers to broader adoption.
Which companies dominate global revenue?
Roche, Abbott, Siemens Healthineers, Thermo Fisher Scientific, and Danaher collectively hold a significant share of revenue.
How are liquid biopsies changing the testing landscape?
Blood-based assays detect recurrence months earlier than imaging, secure expanding reimbursement, and cut reliance on invasive tissue biopsies.
Page last updated on:


