Physical Therapy Software Market Size and Share
Market Overview
| Study Period | 2019 - 2030 |
|---|---|
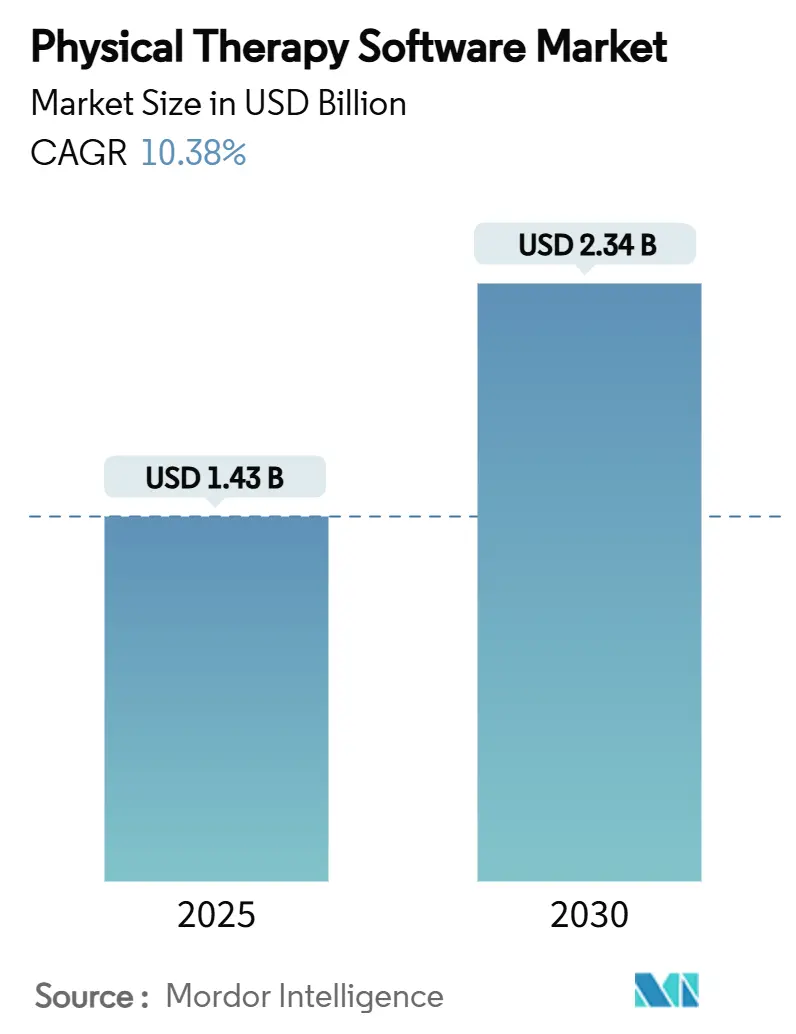
| Market Size (2025) | USD 1.43 Billion |
| Market Size (2030) | USD 2.34 Billion |
| Growth Rate (2025 - 2030) | 10.38% CAGR |
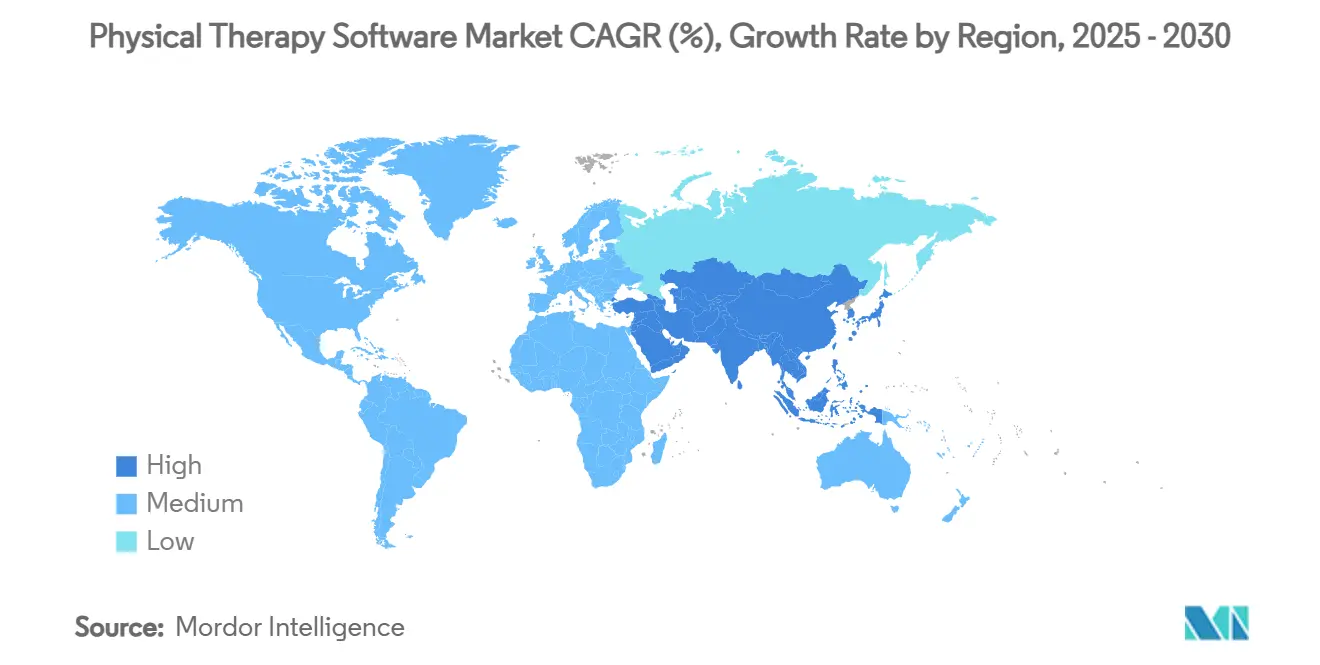
| Fastest Growing Market | Asia Pacific |
| Largest Market | North America |
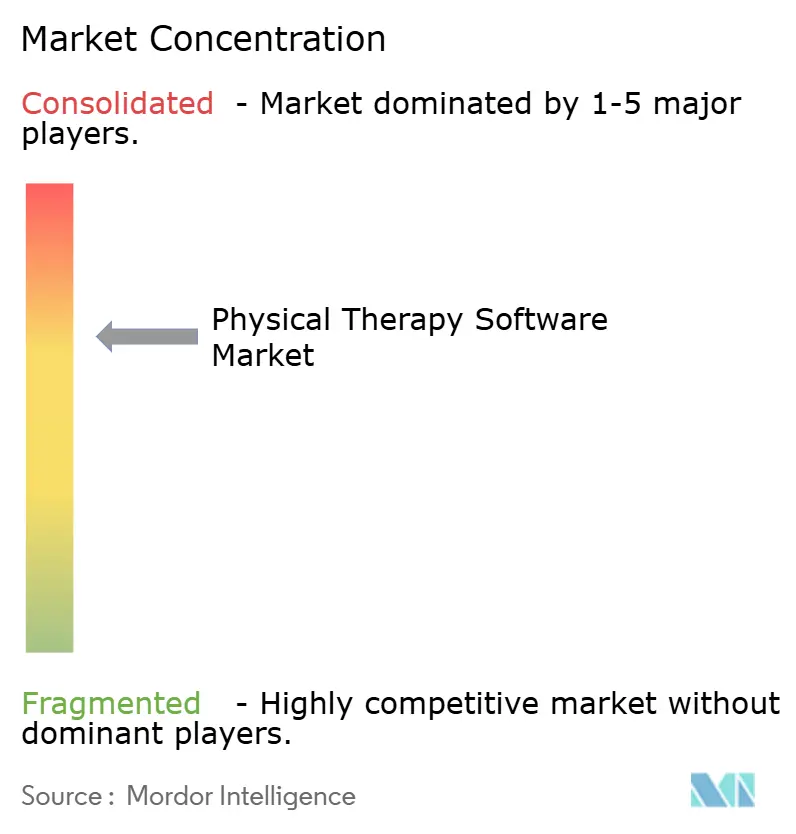
| Market Concentration | Medium |
Major Players *Disclaimer: Major Players sorted in no particular order Image © Mordor Intelligence. Reuse requires attribution under CC BY 4.0. | |
Physical Therapy Software Market Analysis by Mordor Intelligence
The physical therapy software market size stands at USD 1.43 billion in 2025 and is forecast to reach USD 2.34 billion by 2030, translating into a 10.38% CAGR. Robust demand stems from demographic aging, value-based reimbursement rules, and rapid cloud migration that collectively push clinics to modernize their technology stacks. Enterprise buyers seek end-to-end platforms that knit together EMR, billing, tele-rehab, and analytics to control costs and comply with tightening interoperability mandates. Consolidation by private-equity funds is further amplifying platform standardization, while vendors race to embed AI for documentation, triage, and patient-engagement workflows. The February 2024 Change Healthcare cyberattack also heightened attention on data-security features, making HIPAA-level encryption and multifactor authentication critical differentiators.
Key Report Takeaways
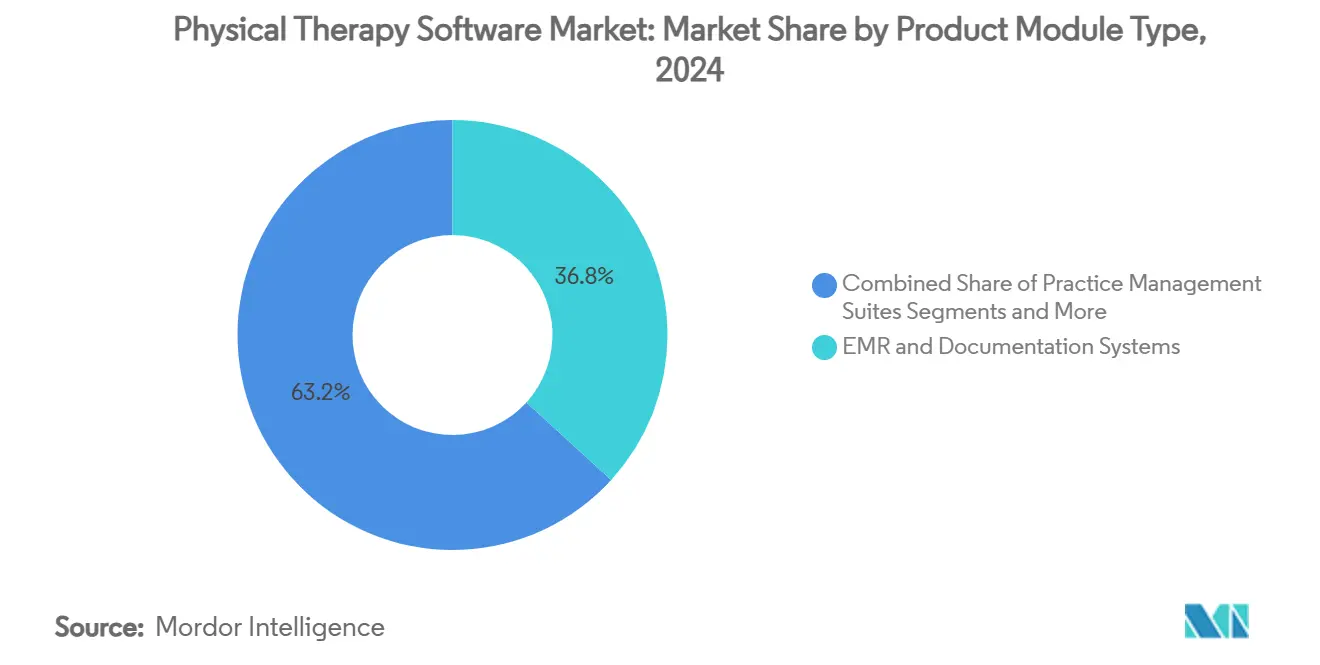
- By product/module, EMR & documentation systems controlled 36.77% of physical therapy software market share in 2024, whereas telehealth & home-exercise platforms are projected to expand at a 14.33% CAGR to 2030.
- By deployment, cloud-based models accounted for 62.48% of the physical therapy software market size in 2024 and will advance at a 14.89% CAGR through 2030.
- By practice size, small clinics held 39.81% revenue share in 2024, while large multi-location networks are set to grow at 13.63% CAGR during the outlook period.
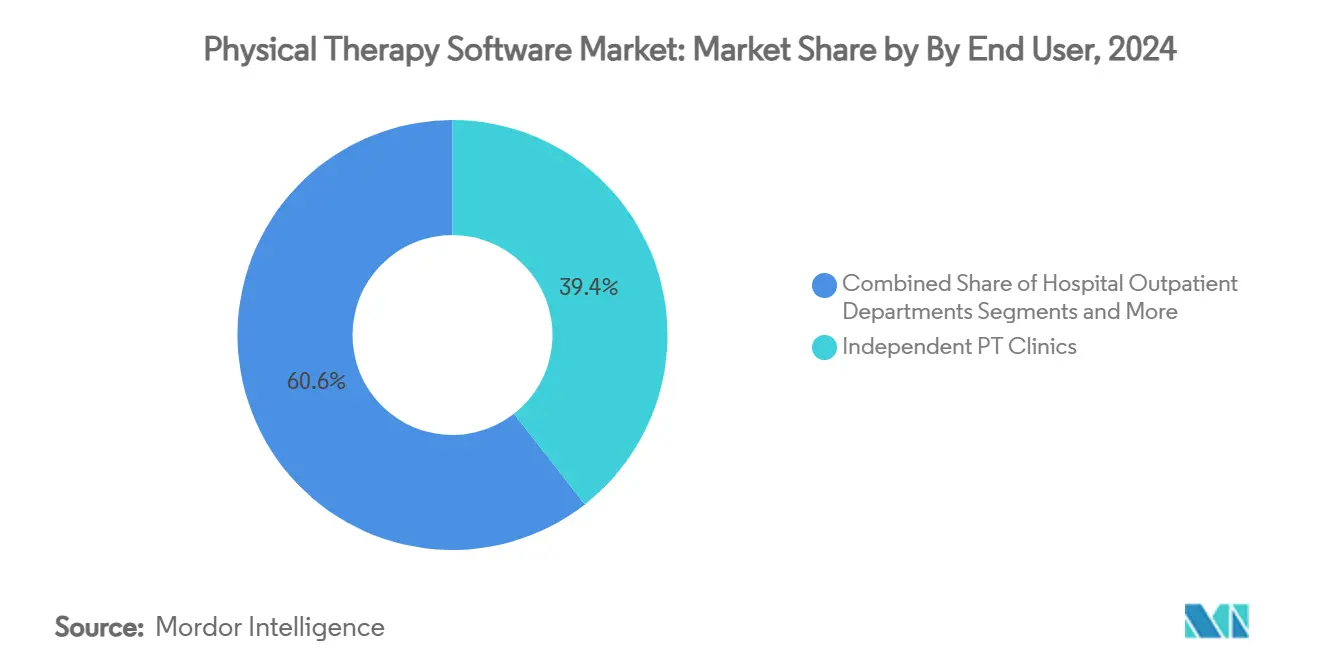
- By end user, independent PT clinics captured 39.44% of demand in 2024, whereas home health agencies will accelerate at a 12.64% CAGR to 2030.
- By application, musculoskeletal rehabilitation represented 44.38% of the physical therapy software market size in 2024 and neurological rehabilitation is rising at a 13.07% CAGR through 2030.
- By geography, North America led with 36.43% revenue in 2024; Asia-Pacific is forecast to post the fastest 12.78% CAGR out to 2030.
Global Physical Therapy Software Market Trends and Insights
Drivers Impact Analysis*
| Driver | (~) % Impact on CAGR Forecast | Geographic Relevance | Impact Timeline |
|---|---|---|---|
| Rising adoption of EMR/EHR platforms | +2.1% | Global; North America & EU lead | Medium term (2-4 years) |
| Aging-related surge in musculoskeletal disorders | +2.8% | Global; strongest in developed markets | Long term (≥ 4 years) |
| Post-pandemic shift toward tele-rehab & virtual MSK care | +1.9% | Global; regulatory differences apply | Short term (≤ 2 years) |
| Value-based reimbursement boosting outcomes-tracking tools | +1.7% | Primarily North America & EU | Medium term (2-4 years) |
| Private-equity roll-ups driving enterprise software roll-outs | +1.4% | Core in North America; expanding worldwide | Medium term (2-4 years) |
| AI-powered clinical decision tools enhance therapist productivity | +1.6% | Global; tech hubs at the forefront | Long term (≥ 4 years) |
| Source: Mordor Intelligence | |||
Rising Adoption of EMR/EHR Platforms
Mandates under the 2024 ONC Health IT Certification Program moved EMR adoption from a paperwork exercise to a strategic necessity by insisting on USCDI v3 data sets and algorithm transparency.[1]Office of the National Coordinator for Health IT, “Health Data, Technology, and Interoperability: Certification Program Updates,” FEDERALREGISTER.GOV Netsmart’s TheraOffice secured certification in mid-2024, enabling MIPS reporting and protecting Medicare revenues. From July 2024, providers blocking information face stiff penalties, so clinics now actively seek interoperable, cloud-based systems that trim paperwork, unlock analytics, and match remote-staff workflows.[2]Joe Reyes, “EHRs, Information Blocking, and MIPS: New Enforcement Mechanism Takes Effect in 2024,” AAO.ORG
Aging-Related Surge in Musculoskeletal Disorders
Nearly half of postmenopausal women could suffer osteoarthritis by 2045, a 40% rise over current levels, sharply lifting demand for rehabilitation visits. Simultaneously, PT employment should climb 14% from 2023-2033, or roughly 13,600 new roles each year, yet 72% of therapists already report capacity constraints.[3]Ben Coburn, “PTJ: New Workforce Forecast Projects PT Shortages Through 2037,” American Physical Therapy Association, apta.org AI-enabled scheduling in platforms such as SPRY trims admin hours by 30-40%, helping clinics manage higher caseloads.
Post-Pandemic Shift Toward Tele-Rehab & Virtual MSK Care
CMS now allows PT assistants to operate under remote supervision, making virtual sessions permanently reimbursable and fueling widespread tele-rehab roll-outs. A 2024 review of eight virtual MSK tools showed pain-relief outcomes that rival in-person visits while lowering costs. Telehealth platforms therefore top growth at a 14.33% CAGR as patients embrace remote exercise guidance.
Value-Based Reimbursement Boosting Outcomes-Tracking Tools
The 2025 Medicare Physician Fee Schedule eases plan-of-care certifications yet keeps quality metrics that swing payment rates. PT clinics increasingly rely on Qualified Clinical Data Registries to capture patient-reported outcomes and secure favorable adjustments. Vendors that bake PRO dashboards into EMRs gain an edge with payer-savvy customers.
Restraints Impact Analysis*
| Restraint | (~) % Impact on CAGR Forecast | Geographic Relevance | Impact Timeline |
|---|---|---|---|
| High switching costs & workflow disruption | –1.8% | Global; steepest for small practices | Short term (≤ 2 years) |
| Cyber-security & data-privacy concerns | –1.2% | Global; compliance varies by region | Medium term (2-4 years) |
| Fragmented cross-border documentation standards | –0.9% | Mainly international markets | Long term (≥ 4 years) |
| Low digital literacy among older practitioners | –0.7% | Global; higher in rural locations | Medium term (2-4 years) |
| Source: Mordor Intelligence | |||
High Switching Costs & Workflow Disruption
Implementing a new EMR can cost USD 150,000–400,000 and may cut visit volumes up to 30% during a three-to-six-month ramp-up, which deters independent clinics from upgrading. The fragmented vendor ecosystem forces practices to juggle multiple bolt-on tools, further complicating migrations.
Cyber-Security & Data-Privacy Concerns
The Change Healthcare ransomware incident compromised 100 million records, revealing sector-wide gaps in multifactor authentication and lifting cyber-insurance premiums 25-40%. Small clinics lack dedicated IT teams, so fear of breaches can slow purchasing decisions despite clear efficiency gains.
*Our forecasts treat driver/restraint impacts as directional, not additive. The impact forecasts reflect baseline growth, mix effects, and variable interactions.
Segment Analysis
By Product/Module Type: EMR Platforms Anchor the Ecosystem
EMR & documentation systems account for 36.77% of 2024 revenue, making them the backbone of most clinics. Telehealth & home-exercise platforms enjoy the swiftest 14.33% CAGR as convenience and reimbursement converge. Practice-management, billing, and patient-engagement modules round out integrated suites, while interoperability tools ensure data liquidity across vendors. WebPT’s deal with Intel RealSense in 2024 illustrates how computer-vision add-ons can lift clinic income 25% through automated exercise tracking.
A surge in outcomes-analytics demand ties directly to MIPS scoring, nudging clinics toward bundled offerings that simplify reporting. As specialty needs widen, niche add-ons remain, yet buyers increasingly gravitate to single-contract platforms for cost and security control.


By Deployment Mode: Cloud Ascendance Continues
Cloud deployment captured 62.48% revenue in 2024 and is accelerating at 14.89% CAGR. Lower up-front costs and automatic updates appeal to small practices, while private-equity roll-ups need unified databases to consolidate multi-state networks quickly. On-premise systems linger in large hospitals citing data-sovereignty policies, and hybrid setups bridge legacy transitions. After the Change Healthcare breach, vendors hardened encryption and MFA, helping convince risk-averse buyers that modern cloud stacks can satisfy HIPAA safeguards.
Economies of scale also shift total cost of ownership. Larger user bases see declining per-seat fees and faster feature roll-outs, reinforcing a virtuous adoption cycle that favors SaaS models.
By Practice Size: Fragmented Volume Meets Enterprise Growth
Small clinics (4-9 therapists) provide 39.81% of 2024 revenue, reflecting the sector’s historic fragmentation. Yet large multi-location networks (> 50 clinics) post the highest 13.63% CAGR as roll-ups pursue regional saturation. Mid-sized groups (10-49 therapists) occupy a sweet spot, wielding enough scale for premium analytics without surrendering flexibility.
Market consolidation reshapes software priorities: centralized scheduling, shared payer contracts, and standardized templates become must-have features for enterprise buyers. SPRY’s USD 15 million raise in October 2024 demonstrates investor appetite for scale-ready platforms deployed across 105 clinics in 30 states.
By End User: Independent Clinics Retain Scale, Home Health Gains Momentum
Independent PT clinics still comprise 39.44% of demand and value tailored outpatient functionality. Home health agencies, however, advance at a 12.64% CAGR on the back of CMS remote-supervision rules and aging-in-place trends, demanding mobile-first documentation and e-visit billing. Hospital outpatient departments and rehabilitation centers seek enterprise EMR links, while sports-medicine facilities prioritize performance analytics and injury-prevention modules.
Regulatory flexibility enacted in 2025 lets assistants remotely treat patients, widening the patient funnel for home-based rehab and making virtual-care modules integral to platform roadmaps.
By Application Area: MSK Dominates, Neurological Rehab Accelerates
Musculoskeletal cases lead with 44.38% revenue thanks to high orthopedic and sports-injury volumes. Neurological rehab grows fastest at 13.07% CAGR as stroke and Parkinson’s prevalence rises. Pediatric, geriatric, and cardiopulmonary rehab remain specialized niches but benefit from AI-enabled personalization.
Real-time motion-capture, wearable sensors, and chat-based coaching allow therapists to tailor protocols more precisely. Early trials pairing wearables with ChatGPT-4 showed promising adherence rates, hinting at broader uptake for AI-advised therapy plans.
Geography Analysis
North America generated 36.43% of global revenue in 2024, powered by MIPS incentives and private-equity roll-ups that standardize technology across networks. U.S. clinics rely on outcomes dashboards to secure bonus payments, while Canadian providers implement unified provincial records, driving steady platform contracts. Mexico’s private hospitals adopt niche PT suites to attract medical tourists, adding incremental demand.
Europe trails slightly behind but benefits from cross-border interoperability rules under the European Health Data Space, nudging clinics toward certified cloud platforms. Germany and the Nordics lead adoption, whereas Southern Europe moves slower due to budget constraints and fragmented outpatient reimbursement.
Asia-Pacific is on track for a 12.78% CAGR through 2030, spurred by Chinese and Indian digitization mandates, rising middle-class spending, and growing musculoskeletal disease burden. Local vendors often partner with global suppliers to align with domestic language and regulatory needs, while Singapore and Australia emerge as test beds for AI-driven tele-rehab pilots.
Middle East & Africa and South America remain early-stage yet promising. Gulf states invest in smart hospitals, requiring bilingual interfaces and HL7/FHIR connectivity, whereas Brazil’s SUS modernization aims to cover rehab for an aging population but faces infrastructure gaps.

Competitive Landscape
Roughly two dozen vendors vie for share, leaving the physical therapy software market moderately fragmented. No player exceeds 15% revenue, although WebPT expanded reach by absorbing Clinicient and Keet in 2024. Francisco Partners’ AdvancedMD purchase and Council Capital’s stake in StrataPT reveal sustained private-equity appetite for roll-up platforms that promise cross-selling synergies.
Strategic positioning hinges on AI depth versus breadth of features. SPRY’s AI-integrated EMR, launched in May 2024, targets documentation speed and coding accuracy. Sword Health’s USD 3 billion valuation underscores investor belief in virtual-first MSK care that bypasses traditional brick-and-mortar clinics. Vendors also partner with EHR giants to unlock referral flows, as seen in Keragon’s 300+ HIPAA-compliant integrations for athenahealth clients.
With clinics channeling more spend to cybersecurity, suppliers tout SOC 2 certifications, zero-trust architectures, and breach-response services. Further M&A is expected as investors hunt for AI talent and cross-regional footprints.
Physical Therapy Software Industry Leaders
WebPT
Net Health
Clinicient Insight EMR
Raintree Systems
NextGen Healthcare
- *Disclaimer: Major Players sorted in no particular order

Recent Industry Developments
- May 2025: Ensora Health unveiled a Partner Program at NatCon to broaden its ecosystem of rehab and behavioral-health solutions.
- February 2025: Tufts University School of Medicine and ATI Physical Therapy launched a collaboration to make PT education more affordable and digitally enriched.
- January 2025: APTA and VALD initiated a year-long data-sharing pact aimed at advancing digital musculoskeletal health technologies.


Global Physical Therapy Software Market Report Scope
| EMR & Documentation Systems |
| Practice Management Suites |
| Billing & Revenue-Cycle Management |
| Patient Engagement & Portals |
| Outcome Measurement & Analytics |
| Telehealth & Home-Exercise Platforms |
| Integration & Interoperability Tools |
| Cloud-based |
| On-premise |
| Hybrid |
| Solo Practices (1-3 therapists) |
| Small Clinics (4-9) |
| Mid-sized Clinics (10-49) |
| Large Multi-location Networks (50+) |
| Independent PT Clinics |
| Hospital Outpatient Departments |
| Home Health Agencies |
| Rehabilitation Centers |
| Sports Medicine & Athletic Training Facilities |
| Musculoskeletal Rehabilitation |
| Neurological Rehabilitation |
| Pediatric Rehabilitation |
| Geriatric Rehabilitation |
| Sports Injury Rehabilitation |
| Cardiopulmonary Rehabilitation |
| North America | United States |
| Canada | |
| Mexico | |
| Europe | Germany |
| United Kingdom | |
| France | |
| Italy | |
| Spain | |
| Rest of Europe | |
| Asia-Pacific | China |
| Japan | |
| India | |
| Australia | |
| South Korea | |
| Rest of Asia-Pacific | |
| Middle East and Africa | GCC |
| South Africa | |
| Rest of Middle East and Africa | |
| South America | Brazil |
| Argentina | |
| Rest of South America |
| By Product / Module Type | EMR & Documentation Systems | |
| Practice Management Suites | ||
| Billing & Revenue-Cycle Management | ||
| Patient Engagement & Portals | ||
| Outcome Measurement & Analytics | ||
| Telehealth & Home-Exercise Platforms | ||
| Integration & Interoperability Tools | ||
| By Deployment Mode | Cloud-based | |
| On-premise | ||
| Hybrid | ||
| By Practice Size | Solo Practices (1-3 therapists) | |
| Small Clinics (4-9) | ||
| Mid-sized Clinics (10-49) | ||
| Large Multi-location Networks (50+) | ||
| By End-user | Independent PT Clinics | |
| Hospital Outpatient Departments | ||
| Home Health Agencies | ||
| Rehabilitation Centers | ||
| Sports Medicine & Athletic Training Facilities | ||
| By Application Area | Musculoskeletal Rehabilitation | |
| Neurological Rehabilitation | ||
| Pediatric Rehabilitation | ||
| Geriatric Rehabilitation | ||
| Sports Injury Rehabilitation | ||
| Cardiopulmonary Rehabilitation | ||
| By Geography | North America | United States |
| Canada | ||
| Mexico | ||
| Europe | Germany | |
| United Kingdom | ||
| France | ||
| Italy | ||
| Spain | ||
| Rest of Europe | ||
| Asia-Pacific | China | |
| Japan | ||
| India | ||
| Australia | ||
| South Korea | ||
| Rest of Asia-Pacific | ||
| Middle East and Africa | GCC | |
| South Africa | ||
| Rest of Middle East and Africa | ||
| South America | Brazil | |
| Argentina | ||
| Rest of South America | ||


Key Questions Answered in the Report
How large is the physical therapy software market in 2025?
It is valued at USD 1.43 billion, with a projected 10.38% CAGR to 2030.
Which deployment model grows fastest for PT software?
Cloud-based platforms, expanding at a 14.89% CAGR as clinics favor scalability and lower IT overhead.
Which product module leads growth through 2030?
Telehealth & home-exercise platforms, rising at a 14.33% CAGR on sustained virtual-care demand.
What region offers the highest future growth?
Asia-Pacific, forecast to post a 12.78% CAGR on healthcare digitization initiatives and demographic shifts.
Why are outcomes-tracking tools gaining traction?
Value-based reimbursement schemes such as MIPS reward clinics that document measurable patient improvements.
Page last updated on:


