
Antimicrobial Resistance Surveillance Market Size and Share
Market Overview
| Study Period | 2021 - 2032 |
|---|---|
| Market Size (2027) | USD 6.59 Billion |
| Market Size (2032) | USD 8.66 Billion |
| Growth Rate (2027 - 2032) | 5.62 % |
| Fastest Growing Market | Asia Pacific |
| Largest Market | North America |
| Market Concentration | Medium |
Major Players *Disclaimer: Major Players sorted in no particular order Image © Mordor Intelligence. Reuse requires attribution under CC BY 4.0. | |
Antimicrobial Resistance Surveillance Market Analysis by Mordor Intelligence
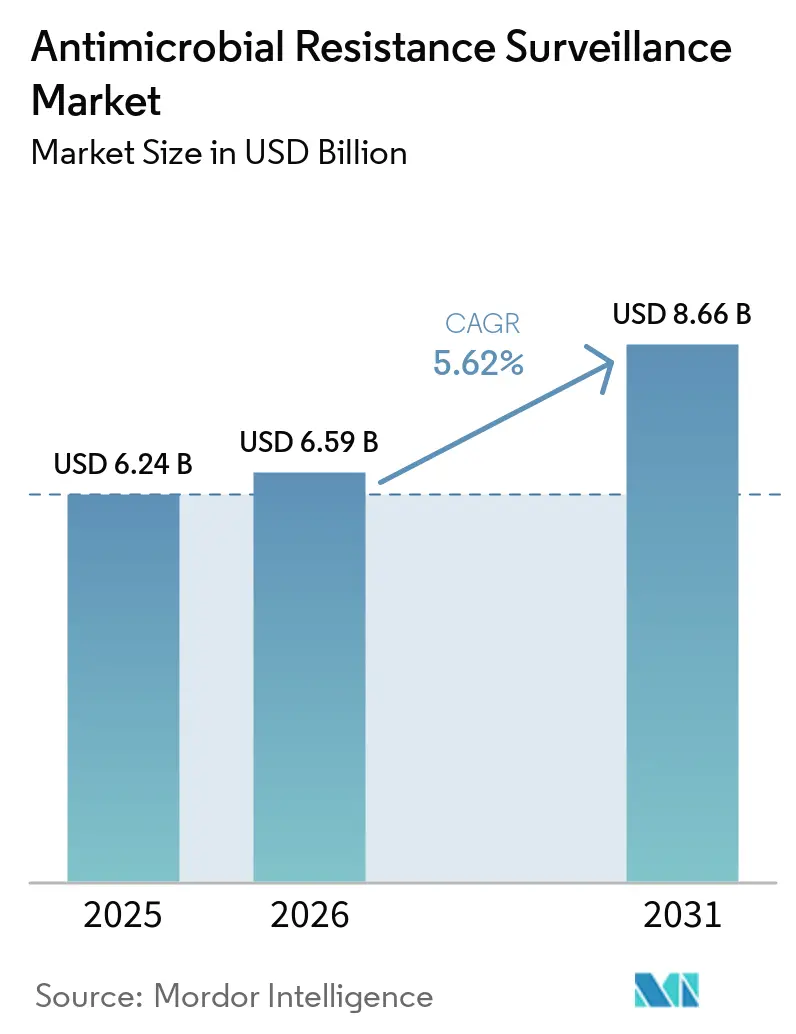
The Antimicrobial Resistance Surveillance Market size is estimated to grow from USD 6.24 billion in 2026 to USD 6.59 billion in 2027 and reach USD 8.66 billion by 2032, at a CAGR of 5.62% during the forecast period (2027-2032).
Its growth reflects mounting global urgency to curb drug-resistant infections that claimed 4.95 million lives in 2019 and could kill 10 million annually by 2050 if left unchecked [1]. Investments in AI-powered diagnostics, portable genomic sequencing, and real-time data platforms now shorten resistance detection from days to mere hours, improving treatment precision and outbreak control.
Key Report Takeaways
- By solution, surveillance software held 41.63% of antimicrobial resistance surveillance market share in 2026, while surveillance services are poised for a 6.08% CAGR to 2032.
- By technology, molecular diagnostics contributed 38.55% revenue in 2026; AI and data-analytics platforms are set to grow at a 6.15% CAGR through 2032.
- By application, clinical diagnostics captured 53.62% share of the antimicrobial resistance surveillance market size in 2026, whereas pharma and biotech R&D will expand at a 6.2% CAGR by 2032.
- By end-user, hospitals and clinics accounted for 56.02% revenue in 2026; diagnostic laboratories are forecast to advance at a 6.25% CAGR over the same horizon.
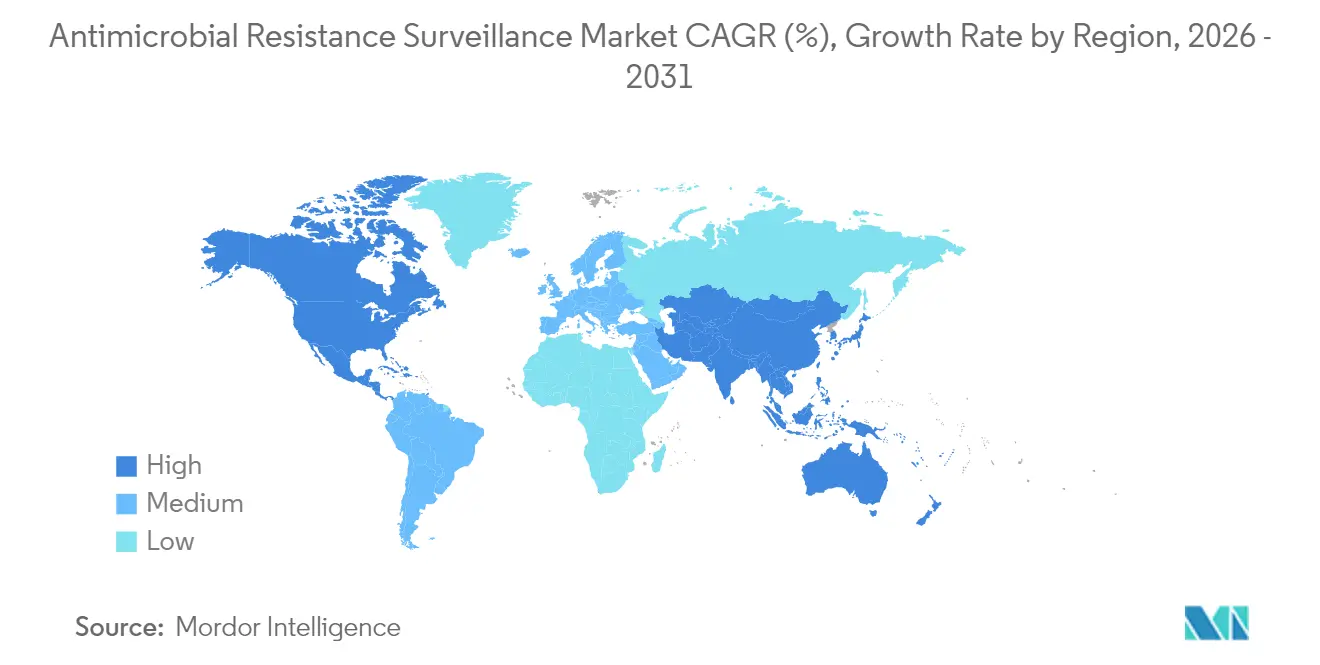
- By geography, North America commanded 42.15% revenue in 2026; Asia-Pacific records the fastest 6.41% CAGR to 2032.
Note: Market numbers in this report are based on Mordor Intelligence's proprietary estimation framework, which combines nine months of actuals with Q4 projections for base year 2026.
Market Trends and Insights
Drivers Impact Analysis of Antimicrobial Resistance Surveillance Market*
| Driver | (~)% Impact on CAGR Forecast | Geographic Relevance | Impact Timeline |
|---|---|---|---|
| Rising prevalence of drug-resistant infections | +1.2% | Global; highest in Asia-Pacific and Sub-Saharan Africa | Short term (≤ 2 years) |
| Government initiatives & funding | +0.9% | North America and EU, expanding to Asia-Pacific | Medium term (2-4 years) |
| Multi-drug resistance from antibiotic misuse | +0.8% | Global, especially in LMICs | Long term (≥ 4 years) |
| Accreditation-driven uptake of tracking tools | +0.6% | North America and EU with spillover to Asia-Pacific | Medium term (2-4 years) |
| AI-driven predictive analytics | +0.7% | Global, led by developed markets | Short term (≤ 2 years) |
| Portable genomic sequencers in the field | +0.5% | Asia-Pacific, Middle East & Africa, Latin America | Long term (≥ 4 years) |
| Source: Mordor Intelligence | |||
Rising Prevalence of Drug-Resistant Infections
Alarmingly high resistance rates reported across all WHO regions in 2024 continue to fuel the antimicrobial resistance surveillance market. Hypervirulent carbapenem-resistant Klebsiella pneumoniae sequence type 23 is now documented in 16 countries and infects both healthy and immunocompromised individuals, prompting urgent surveillance upgrades. Southeast Asian studies show carbapenem-resistant E. coli and Klebsiella in 8 and 9 of 11 nations respectively, with the heaviest burden in Indonesia, Philippines, Thailand, and Vietnam. The WHO forecasts 5.2 million deaths in the Western Pacific from AMR by 2030, with USD148 billion in economic losses, compelling health systems to invest in advanced monitoring.
Government Initiatives & Funding for AMR Programmes
The International Pathogen Surveillance Network introduced a USD4 million catalytic fund in 2024 to strengthen genomic monitoring in LMICs. The UK extended its real-time sequencing program with Oxford Nanopore from 10 to 30 NHS sites, redefining proactive outbreak response [3]. In the United States, the draft PASTEUR Act allocates USD6 billion to antimicrobial innovation and CDC surveillance upgrades, while BARDA partners with Pattern Bioscience and BugSeq on AI-based diagnostics. FAO’s AMR multi-partner trust fund, active to 2030, underscores global coordination by supporting integrated surveillance across ten nations.
Emergence of Multi-Drug Resistance from Antibiotic Misuse
Systemic antibiotic misuse in humans, agriculture, and veterinary medicine accelerates multi-drug resistance beyond traditional detection capacity, pressing the antimicrobial resistance surveillance market to innovate. China’s per-capita antibiotic consumption still surpasses U.S. levels, reflecting widespread broad-spectrum overuse. WHO data highlight a tenfold gap between highest and lowest consuming nations, with many failing to meet the 70% ‘Access’ antibiotic target. Southeast Asian hospitals report aminopenicillins covering only 26% of neonatal sepsis cases, exposing urgent diagnostic gaps. AI-enabled platforms now predict resistance emergence from usage patterns, letting stewardship teams intervene before pathogens spread.
AI-Driven Predictive Analytics Adoption in AMR Platforms
Machine-learning models deliver >90% accuracy in resistance prediction directly from genomic data, slashing detection time to hours and reinforcing the antimicrobial resistance surveillance market. The FDA classified multiplexed cellular analysis systems as Class II devices in 2024, endorsing AI-enhanced diagnostics. T2 Biosystems now blends direct-from-blood PCR with AI decision support for real-time clinical guidance. Portable MinION sequencers tracked drug-resistant E. coli in Indonesian wastewater, illustrating field-ready surveillance.
Restraints Impact Analysis of Antimicrobial Resistance Surveillance Market*
| Restraint | (~)% Impact on CAGR Forecast | Geographic Relevance | Impact Timeline |
|---|---|---|---|
| High capital & operating cost | -0.8% | Global, especially in LMICs | Medium term (2-4 years) |
| Shortage of skilled microbiologists | -0.6% | Global; most severe in Sub-Saharan Africa and rural areas | Long term (≥ 4 years) |
| Cross-border genomic-data ethics | -0.4% | Global; highest impact in EU and Asia-Pacific | Medium term (2-4 years) |
| Lower awareness in developing regions | -0.3% | Asia-Pacific, Middle East & Africa, Latin America | Short term (≤ 2 years) |
| Source: Mordor Intelligence | |||
High Capital & Operating Cost of AMR Surveillance Systems
Whole-genome sequencing platforms can demand start-up investments topping USD 500,000, with ongoing reagent and maintenance costs near USD 200,000 per site annually, creating adoption hurdles in resource-constrained settings. Networked surveillance compounds expenses as multiple facilities integrate standardized protocols, data warehouses, and quality systems. The WHO now offers catalytic grants of USD 50,000–250,000 to LMIC projects, while developers explore paper-based sensors that satisfy REASSURED criteria at lower cost.
Shortage of Skilled Microbiologists & Bioinformaticians
Advanced surveillance platforms require scarce expertise in microbiology, bioinformatics, and analytics, leaving many regions understaffed. Rapid tech evolution heightens the training curve, and few academic programs can supply the needed workforce volume. WHO-backed regional training hubs tackle the gap, while automated analysis pipelines reduce hands-on demand and tele-education extends specialist support remotely.
*Our forecasts treat driver/restraint impacts as directional, not additive. The impact forecasts reflect baseline growth, mix effects, and variable interactions.
Antimicrobial Resistance Surveillance Market Segment Analysis
By Solution:
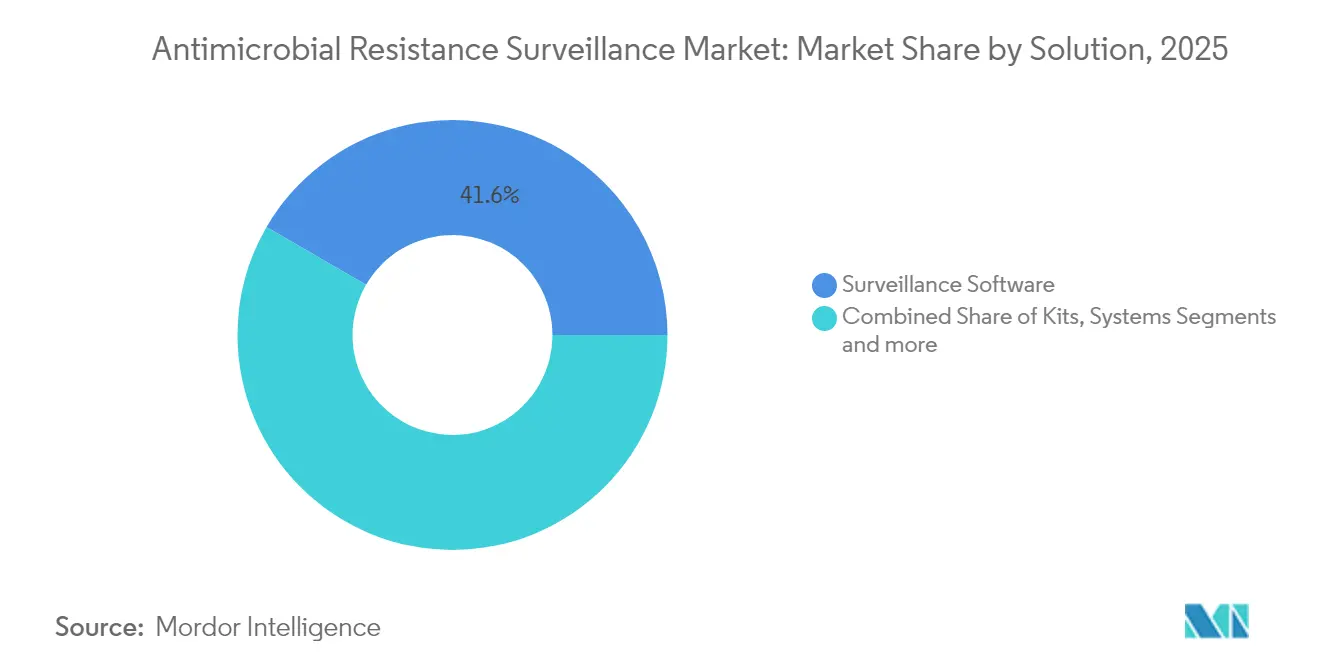
Software Dominance Drives Service InnovationSurveillance software held 41.63% revenue in 2026, reflecting its central role in data orchestration across laboratories, hospitals, and public health agencies. Hospitals increasingly offload daily analytics, regulatory reporting, and compliance tasks to external experts, propelling surveillance services at a 6.08% CAGR. This shift toward managed solutions aligns with post-2024 FDA rules that heighten oversight of laboratory-developed tests and require continuous quality documentation, tasks that cloud-based providers handle at scale.
Growth in services signals broader movement from product sales to subscription revenue, enabling vendors to lock in long-term contracts and provide continuous algorithm updates. The antimicrobial resistance surveillance market benefits as AI modules, outbreak alerts, and regulatory dashboards integrate seamlessly within cloud environments, giving smaller hospitals sophisticated capabilities without large local IT footprints. bioMérieux’s acquisition of LUMED illustrates how diagnostics firms now marry hardware with stewardship software to deliver end-to-end offerings.

By Technology:
AI Platforms Challenge Molecular Diagnostics LeadershipMolecular diagnostics commanded 38.55% of 2026 revenue as PCR and NGS methods offered rapid gene-based detection. Yet AI and data-analytics platforms are climbing fastest at 6.15% CAGR. These systems merge clinical, genomic, and epidemiological data to forecast resistance, a value proposition extending beyond laboratory walls. Integrated solutions that couple PCR detection with AI prediction now achieve >90% categorical agreement in susceptibility testing, positioning hybrids to erode the longstanding dominance of pure molecular workflows.
The antimicrobial resistance surveillance industry is witnessing portable sequencers such as Oxford Nanopore’s MinION that feed real-time reads into cloud AI engines for on-site decisions. Whole-genome sequencing remains a premium tool for cluster investigation, while culture-based and immunoassay methods retreat to niche roles where cost or infrastructure limit advanced options.
By Application:
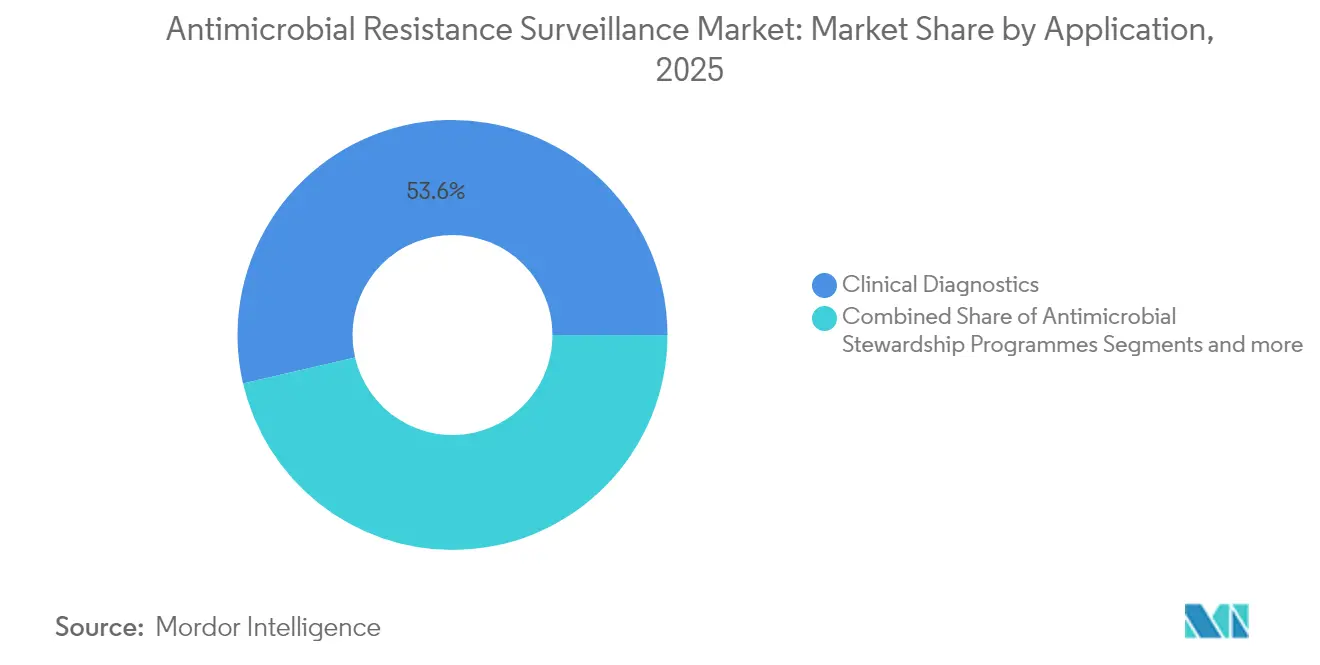
Clinical Diagnostics Leadership Faces R&D DisruptionClinical diagnostics delivered 53.62% of 2026 revenue because patient management hinges on timely susceptibility data. However, pharma and biotech R&D, expanding at 6.2% CAGR, increasingly relies on high-resolution resistance profiling to de-risk drug discovery pipelines. Surveillance data now drive candidate selection, dosing strategies, and trial site targeting, embedding market analytics deep into drug development workflows.
The antimicrobial resistance surveillance industry also supports public health authorities that monitor regional trends to guide stewardship policies. Antimicrobial stewardship programs integrate surveillance dashboards to flag prescribing outliers, while environmental surveillance tracks agricultural runoff, wastewater, and antimicrobial plastics for early warning of resistant strains.
By End-User:
Diagnostic Labs Challenge Hospital DominanceHospitals and clinics retained the largest share at 56.02% in 2026 due to point-of-care decision demands. Centralized diagnostic laboratories are the fastest-growing cohort, up 6.25% CAGR, as health systems outsource high-complexity testing. Large labs leverage economies of scale and automated workflows such as BD’s Phoenix-BDXpert-Synapsys suite to slash result turnaround and standardize quality.
The antimicrobial resistance surveillance market size for reference laboratories is set to expand as multisite networks seek uniform reporting formats, consolidated data lakes, and AI-powered epidemiological mapping. Academic centers and national reference labs remain critical for advanced genomic characterization, but private labs increasingly offer comparable services to regional hospitals under service-level agreements.
Geography Analysis
North America Antimicrobial Resistance Surveillance Market
North America retains leadership with 42.15% revenue in 2026, backed by USD650 million in project funding through the CDC Antimicrobial Resistance Solutions Initiative and favorable FDA policies that accelerate diagnostic approvals. Continuous collaboration among CDC, BARDA, and industry sustains a robust pipeline of AI-enabled tools and integrated reporting platforms that feed directly into national dashboards for real-time situational awareness.
APAC Antimicrobial Resistance Surveillance Market
Asia-Pacific is the fastest-expanding territory at 6.41% CAGR as growing AMR burden prompts governments to digitize surveillance. China’s national networks, operational since 2005, now combine hospital and agricultural data while India’s i-AMRSS provides modular, open-source software to more than 100 sentinel sites. Regional joint funding between India and Japan accelerates applied research, while Singapore’s One-Health-aligned Roadmap integrates human, animal, and environmental inputs. Local private-public partnerships import portable sequencers and cloud analytics to underserved provinces, enlarging the antimicrobial resistance surveillance market.
EMEA and LATAM Antimicrobial Resistance Surveillance Market
Europe shows steady uptake supported by EU-wide surveillance frameworks that harmonize laboratory methods and enable rapid cross-border notification of emerging strains. Latin America, Middle East, and Africa remain nascent but gain momentum as WHO’s GLASS increases country participation to 92 and multi-partner grants finance early-stage network rollouts. In these regions, cost-efficient AI models paired with portable devices promise to leapfrog legacy infrastructure hurdles and expand the antimicrobial resistance surveillance market share among LMICs.
Regulatory Landscape
Global antimicrobial resistance (AMR) surveillance requirements are shaped by WHO and One Health coordination mechanisms that push adoption of standardized reporting and interoperable data platforms. In 2026, the World Health Assembly (WHA79) adopted the Global Action Plan on AMR 2026-2036, establishing a multi-year policy anchor and requesting formal progress reports in 2027, 2029, and 2031. This cadence is likely to reinforce the need for auditable surveillance data flows.
In parallel, WHO GLASS guidance and the Quadripartite (FAO, UNEP, WHO, WOAH) integrated surveillance architecture, including GLASS and ANIMUSE, directs countries toward aligned case definitions, laboratory quality, and cross-sector data exchange across human, animal, and environmental settings. Regionally, Europe enforces structured AMR monitoring through both public health and food-chain rules. Commission Implementing Decision (EU) 2020/1729 mandates harmonized monitoring and reporting of AMR in specified bacteria and animal populations across EU member states for the 2021-2027 period, with rotating species and sampling schedules (including poultry categories in 2026), while ECDC EARS-Net reporting protocols for 2026 require clinical antimicrobial susceptibility testing to follow EUCAST guidance. In major LMIC programs, national coordinating centers and networks, such as India’s AMR surveillance guidance via the National Centre for Disease Control, formalize governance around data privacy, interoperability, and security. That compliance workload tends to increase demand for surveillance software and managed services.
Competitive Landscape
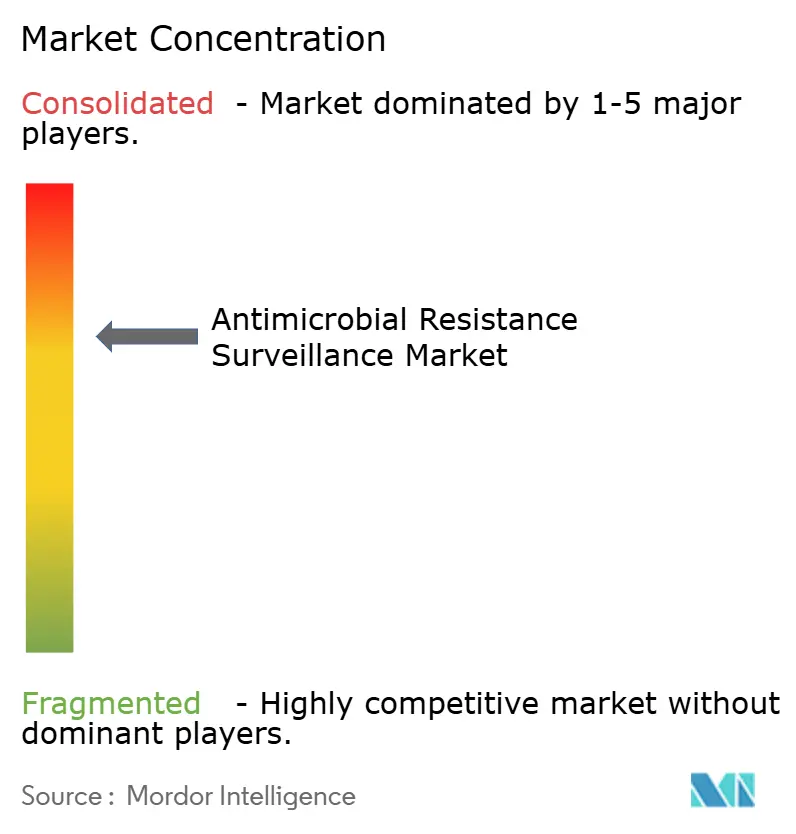
The antimicrobial resistance surveillance market is moderately consolidated, with diagnostics giants leveraging scale, regulatory expertise, and global distribution. bioMérieux’s acquisition of LUMED brings stewardship algorithms into its core diagnostics business, while the Aurobac joint venture with Boehringer Ingelheim and Evotec channels EUR40 million into precision antimicrobials. Thermo Fisher and Roche complement hardware portfolios with cloud dashboards and automated susceptibility panels to lock in end-to-end customer relationships.
Becton Dickinson’s plan to spin off Biosciences and Diagnostic Solutions underscores management focus on infectious-disease tools with USD3.4 billion annual revenue, enabling sharper resource allocation to microbiology automation and informatics. Oxford Nanopore partners with UK NHS sites to integrate real-time sequencing and AI analytics, illustrating how co-development with health systems can accelerate adoption.
Emerging disruptors raise venture financing to target gaps in speed, cost, and portability. T2 Biosystems uses magnetic resonance to identify bloodstream pathogens in 3–5 hours. Day Zero Diagnostics secured USD 16 million to combine rapid NGS and in-house machine learning for same-day susceptibility predictions. These challengers often license their AI engines to incumbents, fostering a cooperative-competitive dynamic that accelerates market innovation while broadening the antimicrobial resistance surveillance market footprint.
Antimicrobial Resistance Surveillance Industry Leaders
-
Pfizer Inc.
-
Merck KgaA
-
Thermo Fisher Scientific
-
Cepheid
-
Liofilchem S.r.l.
- *Disclaimer: Major Players sorted in no particular order
Antimicrobial Resistance Surveillance Market Companies Covered in this Report
- Accelerate Diagnostics
- Beckton Dickinson
- bioMérieux
- Bruker Corp.
- Cepheid (Danaher)
- DiaSorin
- Illumina
- Liofilchem Srl
- Merck
- Oxford Nanopore Technologies
- Pfizer
- QIAGEN
- Roche
- Thermo Fisher Scientific
- T2 Biosystems
- Luminex (Diasorin)
- Abbott Laboratories
- Seegene
- OpGen Inc.
- SyntBioLab Inc.
Read Analysis of Antimicrobial Resistance Surveillance Companies
Market Opportunities and Future Outlook
Active One Health harmonization creates room for platforms that can ingest and normalize multi-sector data (human, animal, and environment) while meeting governance constraints. The Quadripartite global integrated surveillance system direction, aligned with WHO GLASS, increases the focus on interoperable data models, secure cross-border sharing, and workflow tools that reduce manual reporting overhead for national coordinating centers and sentinel sites. Vendors that pair diagnostics outputs (culture, PCR, WGS) with configurable regulatory dashboards and automated quality documentation can address the compliance burden described in EU programs (EU 2020/1729 monitoring and ECDC EARS-Net 2026 protocols) and in national AMR network requirements.
A near-term productization opportunity also centers on faster, field-deployable testing and easier laboratory implementation, supported by collaborations aimed at rapid bacterial and fungal identification and deployment pathways. In April 2026, Cepheid and Oxford Nanopore expanded their partnership to develop a rapid pathogen identification workflow, including an early access program planned for Q3 2026, for use cases where surveillance depends on shorter turnaround times and decentralized testing. In June 2026, the Fleming Initiative and Cepheid launched the TRACE-CPE study to improve rapid diagnostic testing for drug-resistant infections, reflecting demand from programs that need evidence-backed deployment models. Capacity-building programs that connect training with data pipelines further support opportunities for integrated software and services, with Pfizer and Wellcome SPIDAAR supporting laboratory training in Ghana, Kenya, Malawi, and Uganda and integrating outputs into the ATLAS database, a pathway that can extend to additional LMIC networks seeking scalable analytics and standardized reporting.
Recent Industry Developments in Antimicrobial Resistance Surveillance Market
- March 2026: Thermo Fisher Scientific launched Brilliance Candida 2 Agar and Spectra Candida Agar, chromogenic culture media designed to improve detection and differentiation of Candida species, including drug-resistant Candida auris. Faster and clearer organism identification supports infection control teams and surveillance programs that need timely, standardized lab outputs for downstream analytics.
- February 2026: Merck KGaA announced a strategic partnership with Calla Lily Clinical Care to advance the Callavid intravaginal drug delivery platform. The collaboration targets improved localized delivery that can reduce repeated systemic antibiotic use in relevant conditions, aligning with stewardship-driven approaches that complement surveillance by lowering selection pressure and tracking-resistant infection dynamics.
- December 2025: Taiwan CDC and Pfizer signed a memorandum of understanding to establish a public-private partnership focused on AMR data sharing, research collaboration, and public education. Formalizing shared data and joint activities strengthens surveillance infrastructure and accelerates use of structured datasets for policy and clinical decision support.
Antimicrobial Resistance Surveillance Market Report Scope and Research Methodology
Market Definition and Coverage
For this report, the market covers solutions and related services used to detect, track, aggregate, and report antimicrobial resistance (AMR) patterns. This includes tools that generate susceptibility or resistance results and then convert those outputs into usable surveillance reporting.
Scope exclusions: Excludes antimicrobial drug sales and patient treatment costs that are not part of surveillance activities.
Segments Covered in This Report
- By Solution
- Kits
- Systems
- Surveillance Software
- Surveillance Services
- By Technology
- Culture-based Methods
- Molecular Diagnostics
- Whole-Genome Sequencing
- AI and Data-Analytics Platforms
- Others
- By Application
- Clinical Diagnostics
- Public-Health Surveillance
- Antimicrobial Stewardship Programmes
- Pharma & Biotech R&D
- Others
- By End-User
- Hospitals and Clinics
- Diagnostic Laboratories
- Other End-Users
- By Geography
- North America
- United States
- Canada
- Mexico
- Europe
- Germany
- United Kingdom
- France
- Italy
- Spain
- Rest of Europe
- Asia-Pacific
- China
- Japan
- India
- Australia
- South Korea
- Rest of Asia-Pacific
- Middle East and Africa
- GCC
- South Africa
- Rest of Middle East and Africa
- South America
- Brazil
- Argentina
- Rest of South America
- North America
Data Sources, Market Sizing, and Validation
Desk Research
Desk research was used to set clear market boundaries and lock a few stable inputs, including how AMR data is collected, reported, and used in public health and clinical settings. We referenced non-paywalled materials from public health authorities such as the World Health Organization (including GLASS publications), the US CDC, ECDC, and national health ministries that publish AMR action plans and surveillance summaries.
To avoid relying on one viewpoint, we also reviewed peer-reviewed microbiology and infectious disease journals, public procurement and tender notices where available, and diagnostic guidance documents such as those published by the FDA. Company annual reports, investor presentations, and product documentation were used to understand solution coverage and typical deployment patterns by end user. Select paid subscriptions were used for company financials and intelligence, patent databases, and an import or export shipment-level database when trade flows helped explain supply availability. The specific sources named above are illustrative only, and many other references were used for data collection, cross-checking, and clarification.
Primary Interviews and Surveys
Primary research focused on validating what customers actually purchase and use for AMR surveillance, and how usage differs across hospitals, diagnostic laboratories, and public health programs. We spoke with lab decision makers, surveillance program stakeholders, and commercial leaders across major regions, which helped confirm adoption timing, replacement cycles, and the split between consumables, instruments, software, and services.
Distribution of primary research fieldwork respondents
| Company type | Respondent position | Region |
|---|---|---|
| Top tier: 35% | CXOs: 17% | APAC: 50% |
| Mid tier: 47% | Functional/Unit leaders: 26% | EMEA: 31% |
| Smaller Players: 18% | Managers: 57% | Americas: 19% |
Market-Sizing & Forecasting
Sizing started with a top-down build where surveillance demand was reconstructed from testing volumes and resistance reporting coverage across key care settings, followed by normalization for the share of tests that feed AMR surveillance rather than routine diagnostics alone. We then corroborated the outputs using selective bottom-up approximations, including sampled volume times ASP ranges for major kit and system categories and channel checks on software and service attach rates.
A few practical model inputs were used because they can be tracked and explained without overfitting, including the mix between culture-based methods and faster technologies, lab automation and surveillance software penetration, instrument replacement cycles, and the intensity of national reporting programs that pull data from labs. When country-level detail was thin, proxy ratios were applied using comparable healthcare capacity and surveillance maturity, and then adjusted after expert feedback.
Forecasts were built using scenario analysis supported by expected shifts in test volumes, technology mix, and pricing movement, and then refined based on primary views on funding stability and upgrade plans. This keeps the forecast explainable and reduces the chance of reacting to short-term spikes in testing activity.
Data Validation & Update Cycle
Outputs were validated through triangulation across independent signals, including testing activity indicators, published surveillance participation, and supplier-side feedback on ordering patterns. When large variances appeared, the driver assumptions were re-checked, and follow-up outreach was triggered if the gap could not be explained by geography mix, product mix, or timing.
Before sign-off, the model and key assumptions go through multi-step internal reviews so calculations, units, and currency conversions stay consistent. Reports are refreshed annually, with interim updates when material events change demand or pricing expectations. Before delivery, a final review pass is completed so clients receive the latest available view.
Mordor Intelligence's Antimicrobial Resistance Surveillance Market Estimate Compared With Other Published Estimates
Published market values for AMR surveillance often differ because authors do not always count the same set of activities, and then they apply different pricing and adoption assumptions. In practice, the spread usually comes from what gets bundled into surveillance, the base year chosen, and how pricing is carried forward across the forecast window.
Infection surveillance platforms focused on healthcare-associated infections sit outside Mordor Intelligence's scope in this market, which is why figures that bundle those platforms can look higher even when AMR testing and reporting volumes are similar. Differences also show up when one model uses constant prices for kits and services, applies a single global ASP, or converts currencies using older exchange-rate averages, since procurement is local and pricing can move by region.
Benchmark comparison
| Source | Market Size | Gaps in Research Methodology |
|---|---|---|
| Mordor Intelligence | USD 6.59 B (2026) | |
| Industry Research Publisher A | USD 5.49 B (2024) | Uses an earlier base year and may apply narrower capture of surveillance software and services tied to resistance reporting, which can reduce the reported value even if demand signals are similar. |
| Industry Research Publisher B | USD 6.35 B (2024) | Often shares topline numbers without clear splits for instruments, consumables, and services, and the forecast window differs, which can shift adoption and pricing assumptions between years. |
The comparison shows that year selection, bundling of adjacent infection monitoring tools, and pricing carry-forward methods are the main reasons totals diverge. When the scope is kept consistent and the assumptions are checked against on-the-ground feedback, the resulting market value stays traceable to repeatable inputs and can be refreshed cleanly over time.
Key Questions Answered in the Report
What is the current size of the antimicrobial resistance surveillance market?
The antimicrobial resistance surveillance market is valued at USD 6.24 billion in 2026 and is projected to reach USD 8.66 billion by 2032.
Which region leads the antimicrobial resistance surveillance market?
North America leads with 42.15% revenue in 2026, supported by large federal investments and advanced healthcare infrastructure.
Which segment is growing fastest within the antimicrobial resistance surveillance market?
Surveillance services are expanding fastest at a 6.08% CAGR as hospitals prefer turnkey managed solutions.
Why is Asia-Pacific the fastest-growing region?
Asia-Pacific posts a 6.41% CAGR due to rising AMR burden, government digitization programs, and growing investment in integrated surveillance networks.
What are the main challenges limiting adoption?
High capital costs, shortage of skilled microbiologists and bioinformaticians, and data-sharing ethics across borders remain key hurdles, particularly in low- and middle-income countries.