E-pharmacy Market Size and Share
Market Overview
| Study Period | 2020 - 2031 |
|---|---|
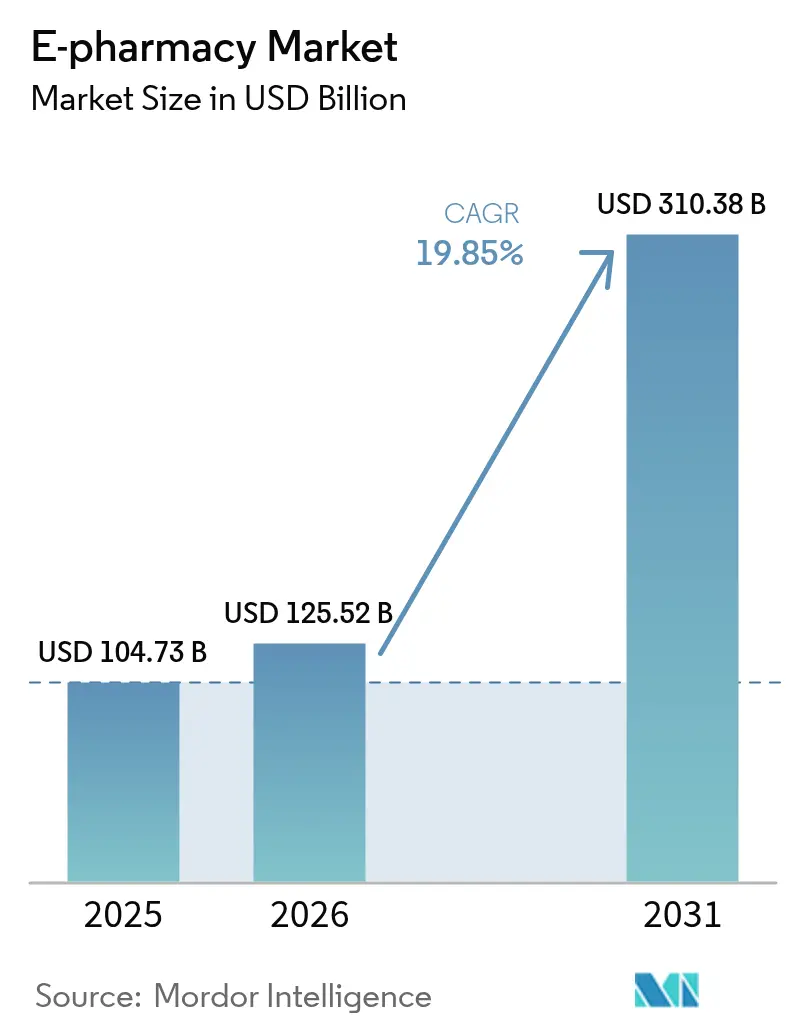
| Market Size (2026) | USD 125.52 Billion |
| Market Size (2031) | USD 310.38 Billion |
| Growth Rate (2026 - 2031) | 19.85% CAGR |
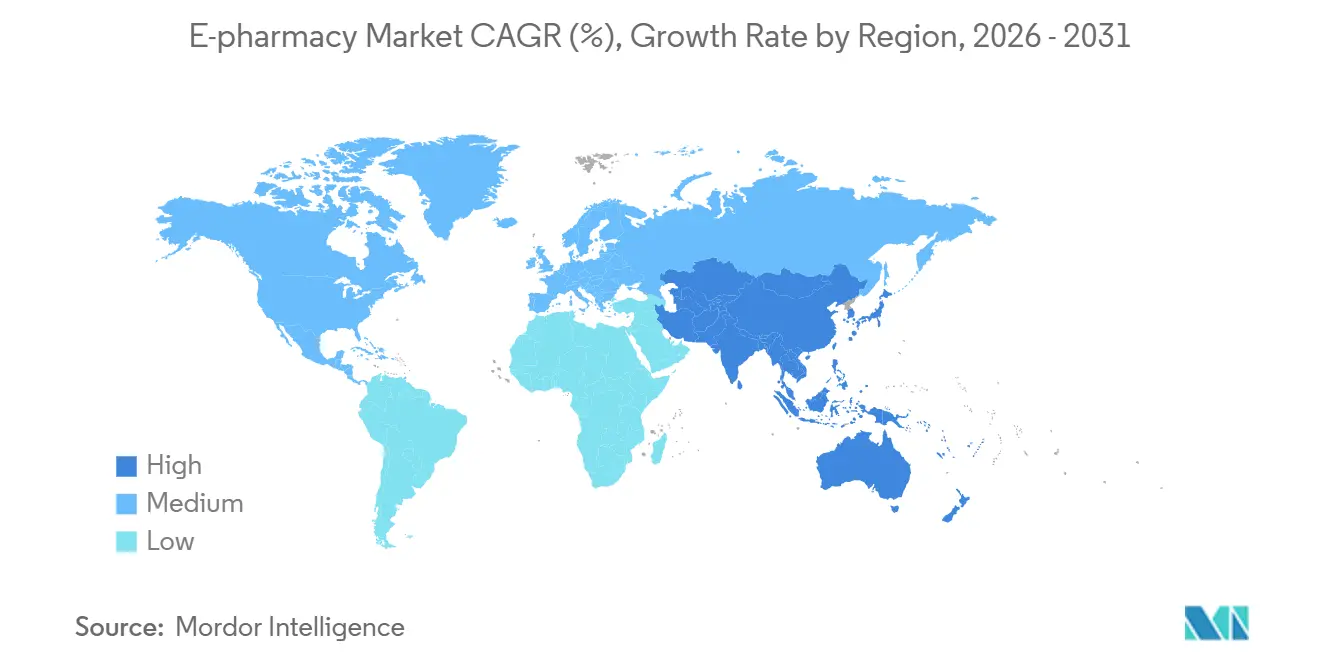
| Fastest Growing Market | Asia Pacific |
| Largest Market | North America |
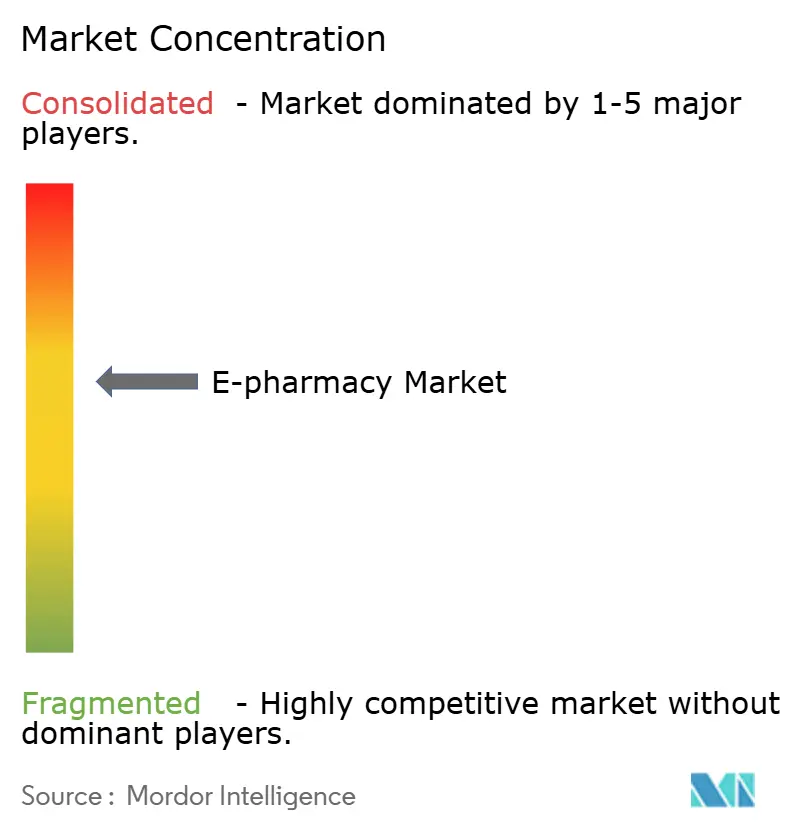
| Market Concentration | Medium |
Major Players *Disclaimer: Major Players sorted in no particular order Image © Mordor Intelligence. Reuse requires attribution under CC BY 4.0. | |
E-pharmacy Market Analysis by Mordor Intelligence
The E-pharmacy Market size is expected to increase from USD 104.73 billion in 2025 to USD 125.52 billion in 2026 and reach USD 310.38 billion by 2031, growing at a CAGR of 19.85% over 2026-2031.
Electronic-prescription mandates, pharmacy-desert expansion, and logistics investments are accelerating digital drug dispensing, while direct-to-consumer models from manufacturers threaten traditional intermediaries. Same-day delivery is becoming table stakes as Amazon Pharmacy rolls out service to 4,500 U.S. cities and towns in 2026, exploiting 2,100 planned brick-and-mortar closures by rival chains. Asia-Pacific platforms add further momentum by embedding one-click pharmacy storefronts inside super-apps, capturing smartphone-first audiences and leapfrogging legacy workflows. Cold-chain advances are widening the therapy mix to include biologics and GLP-1 agonists, lifting average basket values. However, fragmented global regulation and a surge in rogue websites temper growth, adding compliance costs and reputational risk.
Key Report Takeaways
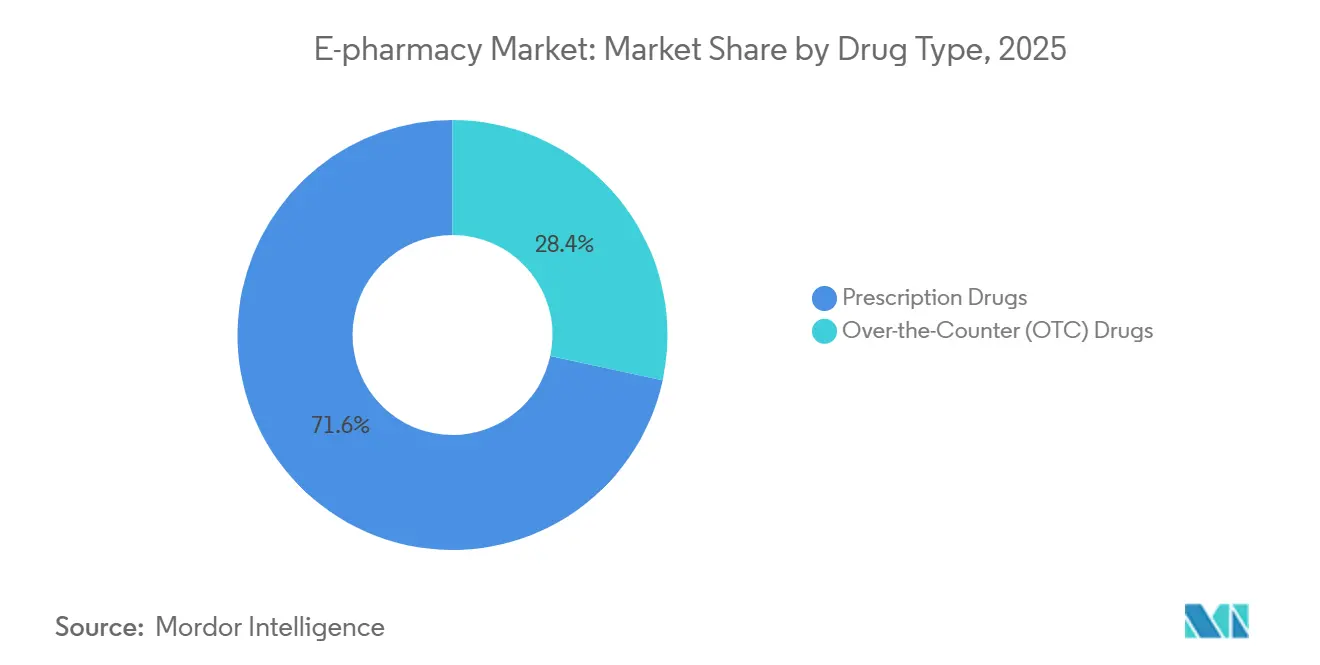
- By drug type, prescription drugs led with a 71.62% E-pharmacy market share in 2025, while over-the-counter items are forecast to post a 21.54% CAGR through 2031.
- By product type, cold and flu remedies accounted for 24.85% of the E-pharmacy market in 2025, but vitamins and dietary supplements will grow at a 22.32% CAGR through 2031.
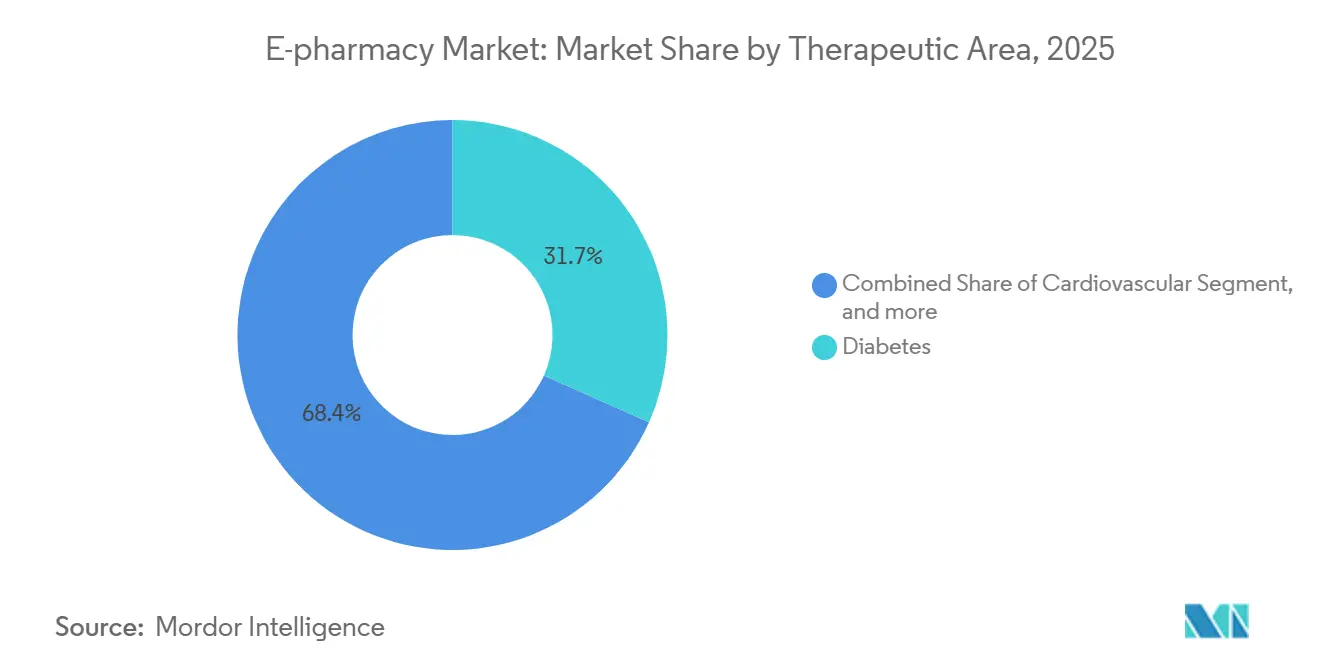
- By therapeutic area, diabetes accounted for 31.65% of revenue in 2025, and gastrointestinal disorders are set to grow at a 22.67% CAGR through 2031.
- By platform, mobile accounted for 58.54% of 2025 revenue and is expanding at a 22.76% CAGR to 2031.
- By geography, North America commanded 42.65% of 2025 revenue, while Asia-Pacific is projected to grow at a 20.54% CAGR through 2031.
Note: Market size and forecast figures in this report are generated using Mordor Intelligence’s proprietary estimation framework, updated with the latest available data and insights as of 2026.
Global E-pharmacy Market Trends and Insights
Driver Impact Analysis*
| Driver | (~) % Impact on CAGR Forecast | Geographic Relevance | Impact Timeline |
|---|---|---|---|
| Government Mandates for Electronic Prescriptions | +3.2% | North America & EU, spill-over to APAC | Medium term (2-4 years) |
| Growing Geriatric Population and Chronic Disease Burden | +4.5% | Global, with highest intensity in North America, Europe, and East Asia | Long term (≥ 4 years) |
| Strategic Collaborations Among Payers, PBMs, and E-Pharmacies | +2.8% | North America core, expanding to EU and select APAC markets | Short term (≤ 2 years) |
| Investments in Advanced Fulfilment and Same-Day Logistics | +3.1% | North America and urban APAC hubs (China, India, Japan) | Short term (≤ 2 years) |
| Integration with Digital Health and Remote Monitoring Platforms | +2.9% | Global, led by North America and Western Europe | Medium term (2-4 years) |
| Expansion of Direct-to-Consumer Distribution by Drug Manufacturers | +2.4% | North America and Europe, early pilots in APAC | Medium term (2-4 years) |
| Source: Mordor Intelligence | |||


Government Mandates for Electronic Prescriptions
New rules such as the U.S. HTI-4 standardize NCPDP SCRIPT and real-time benefit checks by 2027, removing paper friction and favoring platforms that already run certified APIs. Greece took a similar all-digital stance for public reimbursement in 2024, while the EU targets cross-border exchange in 2025. These mandates compress prescription hand-off times and cut abandonment at the counter, but require independents to fund costly software upgrades. The compliance floor therefore tilts share toward scaled players that can amortize integration costs, deepening consolidation in the E-pharmacy market.
Growing Geriatric Population and Chronic Disease Burden
The world’s 60-plus cohort will reach 1.4 billion by 2030, driving medication volume for diabetes, cardiovascular, and respiratory disorders[1]World Health Organization, “Global Ageing Report 2025,” who.int. Automated refill reminders and home shipping solve mobility barriers, lifting adherence and reducing hospital readmissions that payers track under value-based care models. LillyDirect’s home insulin delivery exemplifies the convergence of specialty therapy, telehealth, and E-pharmacy fulfillment. These dynamics lock in recurring revenue and reinforce the E-pharmacy market as a clinical partner rather than just a distribution node.
Strategic Collaborations Among Payers, PBMs, and E-Pharmacies
Express Scripts and Kroger Health linked 2,200 store pharmacies to 85 million covered lives in 2024, creating omnichannel steering power. CVS Health merged Oak Street Health clinics with its dispensing arm, while the FTC lawsuit against the big three PBMs subjects rebate tactics to antitrust review. Preferred-network dynamics make or break smaller entrants, underscoring why vertical integration reshapes the E-pharmacy market more than price alone.
Investments in Advanced Fulfillment and Same-Day Logistics
Amazon Pharmacy delivers prescriptions on the day of order in 20 cities and will scale to 4,500 localities by the end of 2026. Walmart trials 30-minute delivery from dark-store setups, converting real estate into micro-fulfillment nodes. These investments answer pharmacy-desert gaps created by 2,100 store closures at CVS and Walgreens. Cold-chain expansion unlocks biologics but inflates per-order costs by up to 50%, pushing platforms toward insulated packaging and IoT temperature tracking.
Restraints Impact Analysis*
| Restraints Impact Analysis | (~) % Impact on CAGR Forecast | Geographic Relevance | Impact Timeline |
|---|---|---|---|
| Fragmented International Regulatory Framework | -2.1% | Global, highest friction in EU and emerging Asia-Pacific | Long term (≥4 years) |
| Proliferation of Illegitimate Online Pharmacies | -1.8% | Global, concentrated on unregulated platforms | Medium term (2-4 years) |
| High Cold-Chain and Compliance Costs | -2.3% | North America, Europe, urban Asia-Pacific hubs | Short term (≤2 years) |
| Complex Reimbursement and Pricing Controls | -2.0% | North America and Europe, spill-over to select Asia-Pacific markets | Long term (≥4 years) |
| Source: Mordor Intelligence | |||
Fragmented International Regulatory Framework
EU cross-border dispensing requires manual re-verification in many states because only 12 of 27 countries exchanged e-prescriptions by mid-2024. India obliges separate state licences, a factor in PharmEasy’s valuation crash to USD 458 million in 2024. In the United States, just 53 websites carried NABP’s VIPPS seal in 2024[2]National Association of Boards of Pharmacy, “VIPPS Certified List 2024,” nabp.pharmacy. These mismatches add onboarding time, duplicate audits, and legal risk, trimming the E-pharmacy market growth trajectory.
Proliferation of Illegitimate Online Pharmacies
Operation Pangea XVII shut 500 domains and seized 1,900 counterfeit parcels in 2024, yet new sites appear within days. Search ads still drive consumers to non-certified sellers, with 40% of 2024 ad clicks landing on rogue operators. Authentic platforms shoulder additional serialization and audit costs to reassure payers, increasing overhead by up to 8% and narrowing margins across the E-pharmacy market.
*Our forecasts treat driver/restraint impacts as directional, not additive. The impact forecasts reflect baseline growth, mix effects, and variable interactions.
Segment Analysis
By Drug Type: OTC Gains Ground as Switch Rules Accelerate
Over-the-counter medicines will rise at a 21.54% CAGR through 2031, outstripping prescription growth even though Rx products owned 71.62% E-pharmacy market share in 2025. The ACNU rule trims switch timelines to 18 months, prompting manufacturers to pursue statins and PPIs for consumer use. Subscription bundles inside apps lower refill friction and reinforce brand loyalty. Nevertheless, high-priced biologics keep prescription revenue dominant, especially for specialty indications, maintaining the revenue core of the E-pharmacy market.
The E-pharmacy market size captured by OTC products will climb steadily as self-care trends align with digitized guidance tools. Price sensitivity persists because insurers seldom cover non-prescription items, nudging shoppers toward generics. Rx drugs, while slower growing, remain essential for chronic conditions that demand clinical oversight and benefit from real-time benefit checks introduced under HTI-4.


By Product Type: Wellness Supplements Outpace Traditional Categories
Cold and flu remedies held 24.85% of 2025 product share, but vitamins and dietary supplements will chart a 22.32% CAGR through 2031 as consumers pivot to preventive wellness[3]. Amazon owns 73% of online supplement sales and leverages recommendations plus Prime shipping to lock in monthly subscriptions, a dynamic that deepens its stake in the E-pharmacy market.
E-commerce guidelines now compel visible NSF or USP testing badges, raising compliance thresholds that favor larger sellers. Wellness stack baskets—immune vitamins, probiotics, plant-based proteins—boost average order value and reduce seasonality. The E-pharmacy market size for supplements will therefore widen faster than legacy OTC categories tied to episodic illness.
By Therapeutic Area: Diabetes Dominates, GI Disorders Surge
Diabetes accounted for 31.65% of 2025 revenue, driven by costly CGM sensors and GLP-1 injectables. Direct shipping through LillyDirect shortens refill cycles and captures data that informs dose titration algorithms. Gastrointestinal drugs will post the highest CAGR of 22.67%, buoyed by biologic adoption for IBD, which aligns with cold-chain-ready E-pharmacy infrastructure.
Cardiovascular and respiratory therapies remain volume leaders but face price compression from generics, limiting their contribution to growth in the E-pharmacy market. Oncology, mental health, and pain therapies carry stricter online controls, keeping penetration comparatively low until DEA accreditation processes mature.
By Platform: Mobile Apps Take the Lead
Mobile accounted for 58.54% of 2025 revenue and is growing at a 22.76% CAGR, reflecting global smartphone ubiquity and the convenience of biometric login and push reminders. Desktop retains loyalty among older patients who handle insurance paperwork on larger screens but will trail growth.
WeChat mini-programs in China and MedAdvisor’s Australian app exhibit the localized flavor of app-based fulfillment. Voice ordering and smartwatch prompts remain niche, yet they illustrate how the E-pharmacy market is evolving toward ambient, context-aware medicine management.
Geography Analysis
North America accounted for 42.65% of 2025 revenue, driven by USD 1,300 per capita drug spend and abundant insurance coverage. Store closures by CVS, Walgreens, and Rite Aid between 2024-2027 create access gaps that Amazon Pharmacy and Optum Rx fill with same-day logistics. U.S. HTI-4 standards remove prescribing friction, and VIPPS accreditation differentiates legitimate sites. Canada and Mexico lag amid fragmented rules, though cross-border Canadian imports remain a consumer workaround.
Asia-Pacific is the fastest-growing region, with a 20.54% CAGR through 2031. China’s 600 million digital health users fuel Alibaba Health’s USD 2.3 billion 2024 revenue and JD Health’s USD 4.8 billion 2023 revenue. India wrestles with multi-state licences, driving consolidation as Tata 1mg and Apollo Pharmacy blend online and offline assets. Japan’s older demographic and strict pharmacist consultations temper growth, whereas Australia’s MedAdvisor shows adherence gains that insurers reward.
Europe holds a 25% share but faces cross-border hurdles. Only a minority of EU states exchange e-prescriptions seamlessly, constraining DocMorris, which posted a CHF 84.8 million loss in H1 2024. Greece mandated full e-prescribing in 2024, offering a template for Southern Europe. The U.K.’s NHS App connects to brick-and-mortar fulfillment, limiting pure-play upside. Gulf states and South Africa pursue digital pilots, while Brazil and Argentina move slowly due to logistics and regulatory uncertainty.
Competitive Landscape
The top ten firms accounted for roughly 55% of 2025 revenue, indicating a moderately concentrated market. In North America, CVS Health, Cigna-Express Scripts, and UnitedHealth dominate through vertically integrated insurance and PBM arms that steer prescription flow. Amazon Pharmacy counters with transparent pricing and nationwide same-day service, forcing incumbents to accelerate digital offerings.
In China, Alibaba Health and JD Health wield super-app distribution advantages beyond Western reach, embedding pharmacy within payments and social media. India remains fragmented yet ripe for consolidation, as funding scarcity puts pressure on smaller platforms. Europe lacks a pan-regional giant due to regulatory heterogeneity, though DocMorris remains the largest single player despite restructuring losses.
Specialty niches open white-space for Alto Pharmacy and Capsule, which provide high-touch services for complex biologics. Manufacturer portals such as LillyDirect and Novo Nordisk’s pilots bypass retailers altogether, signaling a future where branded E-pharmacy experiences coexist with multi-brand marketplaces. Technology moats center on telemedicine APIs, real-time benefit verification, and AI adherence prompts, while NABP VIPPS and EU GDPR compliance form trust and privacy barriers.
E-pharmacy Industry Leaders
Walgreens Boots Alliance
CVS Health Corporation
Cigna Corporation (Express Scripts Holdings)
Amazon Pharmacy (PillPack)
DocMorris / Redcare Pharmacy
- *Disclaimer: Major Players sorted in no particular order

Recent Industry Developments
- January 2026: Amazon Pharmacy set to reach 4,500 U.S. towns with same-day delivery, addressing pharmacy deserts formed after 2,100 store closures.
- January 2026: Morrison launched Fillex, a national automated pharmacy fulfillment platform. It aims to help retailers and health systems scale prescription e-commerce and omnichannel operations without building their own centralized infrastructure.
- January 2024: Lilly launched LillyDirect for direct insulin delivery, integrating teleconsults and fulfillment.


Global E-pharmacy Market Report Scope
As per the scope of the report, an E-pharmacy is an online pharmacy that operates over the Internet and provides medicines to consumers through mail or shipping companies. E-pharmacy cuts down the long chain of distributors.
The E-pharmacy Market is Segmented by Drug Type (Prescription Drugs and Over-The-Counter Drugs), Product Type (Skin Care, Dental, Cold & Flu, Vitamins & Dietary Supplements, Weight Management, and Other Product Types), Therapeutic Area (Diabetes, Cardiovascular, Respiratory, Gastrointestinal, and Other Therapeutic Areas), Platform (Mobile Users and Desktop Users), and Geography (North America, Europe, Asia-Pacific, Middle East & Africa, and South America). The market report also covers the estimated market sizes and trends for 17 countries across major regions globally. The report offers the value (in USD million) for the above segments.
| Prescription Drugs |
| Over-The-Counter (OTC) Drugs |
| Skin Care |
| Dental |
| Cold & Flu |
| Vitamins & Dietary Supplements |
| Weight Management |
| Other Product Types |
| Diabetes |
| Cardiovascular |
| Respiratory |
| Gastrointestinal |
| Other Therapeutic Areas |
| Mobile Users |
| Desktop Users |
| North America | United States |
| Canada | |
| Mexico | |
| Europe | Germany |
| United Kingdom | |
| France | |
| Italy | |
| Spain | |
| Rest of Europe | |
| Asia-Pacific | China |
| Japan | |
| India | |
| Australia | |
| South Korea | |
| Rest of Asia-Pacific | |
| Middle East & Africa | GCC |
| South Africa | |
| Rest of Middle East & Africa | |
| South America | Brazil |
| Argentina | |
| Rest of South America |
| By Drug Type | Prescription Drugs | |
| Over-The-Counter (OTC) Drugs | ||
| By Product Type | Skin Care | |
| Dental | ||
| Cold & Flu | ||
| Vitamins & Dietary Supplements | ||
| Weight Management | ||
| Other Product Types | ||
| By Therapeutic Area | Diabetes | |
| Cardiovascular | ||
| Respiratory | ||
| Gastrointestinal | ||
| Other Therapeutic Areas | ||
| By Platform | Mobile Users | |
| Desktop Users | ||
| Geography | North America | United States |
| Canada | ||
| Mexico | ||
| Europe | Germany | |
| United Kingdom | ||
| France | ||
| Italy | ||
| Spain | ||
| Rest of Europe | ||
| Asia-Pacific | China | |
| Japan | ||
| India | ||
| Australia | ||
| South Korea | ||
| Rest of Asia-Pacific | ||
| Middle East & Africa | GCC | |
| South Africa | ||
| Rest of Middle East & Africa | ||
| South America | Brazil | |
| Argentina | ||
| Rest of South America | ||


Key Questions Answered in the Report
How large will online drug sales become by 2031?
The E-pharmacy market is projected to reach USD 310.38 billion by 2031, growing at a 19.85% CAGR from 2026.
Which product category will grow the fastest online?
Vitamins and dietary supplements are on track for a 22.32% CAGR through 2031 as wellness spending shifts to digital channels.
Why is Asia-Pacific the quickest growing region?
Smartphone ubiquity, super-app integrations, and supportive digitization policies push Asia-Pacific to a 20.54% CAGR through 2031.
What role do electronic-prescription mandates play?
Mandates such as HTI-4 in the United States force all prescribers onto digital rails by 2027, reducing friction and expanding the e-pharmacy customer base.
How are manufacturers disrupting traditional pharmacy channels?
Platforms such as LillyDirect ship insulin and other therapies straight to patients, bypassing retail stores and PBMs to capture higher margins and adherence data.
Are counterfeit medicines a serious online risk?
Yes, with only 53 U.S. sites VIPPS-certified in 2024, enforcement actions like Operation Pangea XVII highlight ongoing challenges against illegitimate sellers.
Page last updated on:


