Peru Container Glass Market Size and Share
Market Overview
| Study Period | 2020 - 2031 |
|---|---|
| Base Year For Estimation | 2025 |
| Forecast Data Period | 2026 - 2031 |
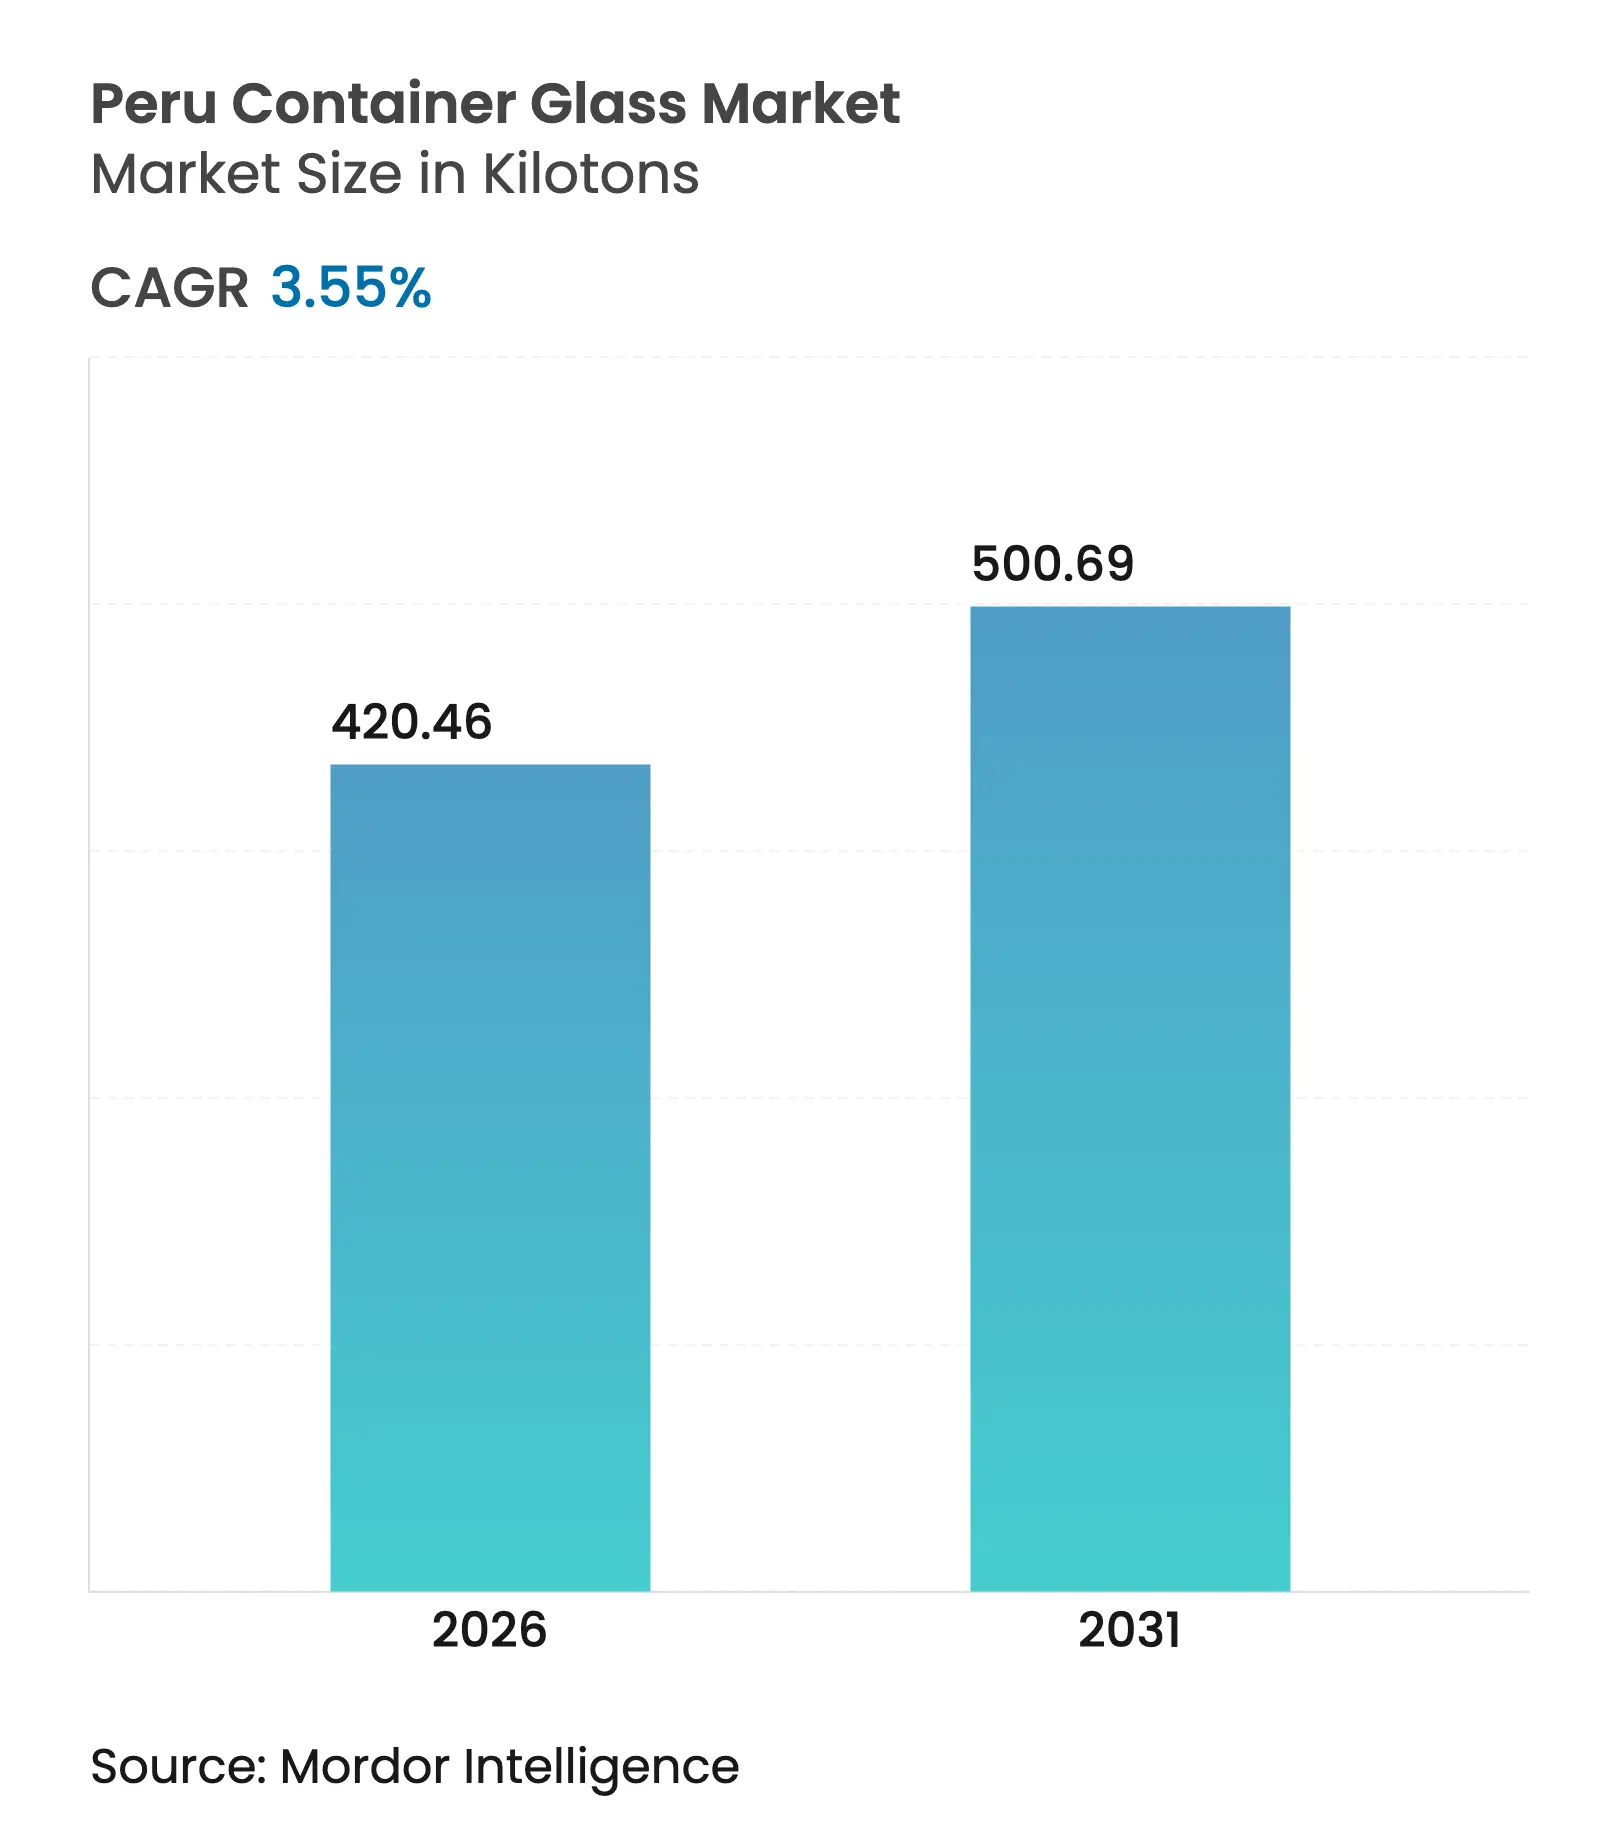
| Market Volume (2026) | 420.46 kilotons |
| Market Volume (2031) | 500.69 kilotons |
| CAGR | 3.55 % |
| Market Concentration | High |
Major Players *Disclaimer: Major Players sorted in no particular order. Image © Mordor Intelligence. Reuse requires attribution under CC BY 4.0. |
Peru Container Glass Market Analysis by Mordor Intelligence
The Peru container glass market size was valued at 406.05 kilotons in 2025 and estimated to grow from 420.46 kilotons in 2026 to reach 500.69 kilotons by 2031, at a CAGR of 3.55% during the forecast period (2026-2031). This growth trajectory underscores the market’s resilience amid regional macro-economic volatility, bolstered by sustainability imperatives, premiumization trends, and Peru’s widening export base. Beverage manufacturers continue to prioritize glass for product differentiation and brand heritage, while food processors leverage the material’s barrier properties to preserve flavor integrity over long shipping distances.[1]U.S. Commercial Service, “Peru - Food Processing and Packaging Equipment,” privacyshield.gov Parallel policy support for circular economy initiatives is expected to improve cullet availability, easing raw-material imports and moderating furnace costs. Vertical integration among leading producers, combined with Peru’s extensive free-trade agreement network, further underpins capacity additions targeted at regional export opportunities.
Key Report Takeaways
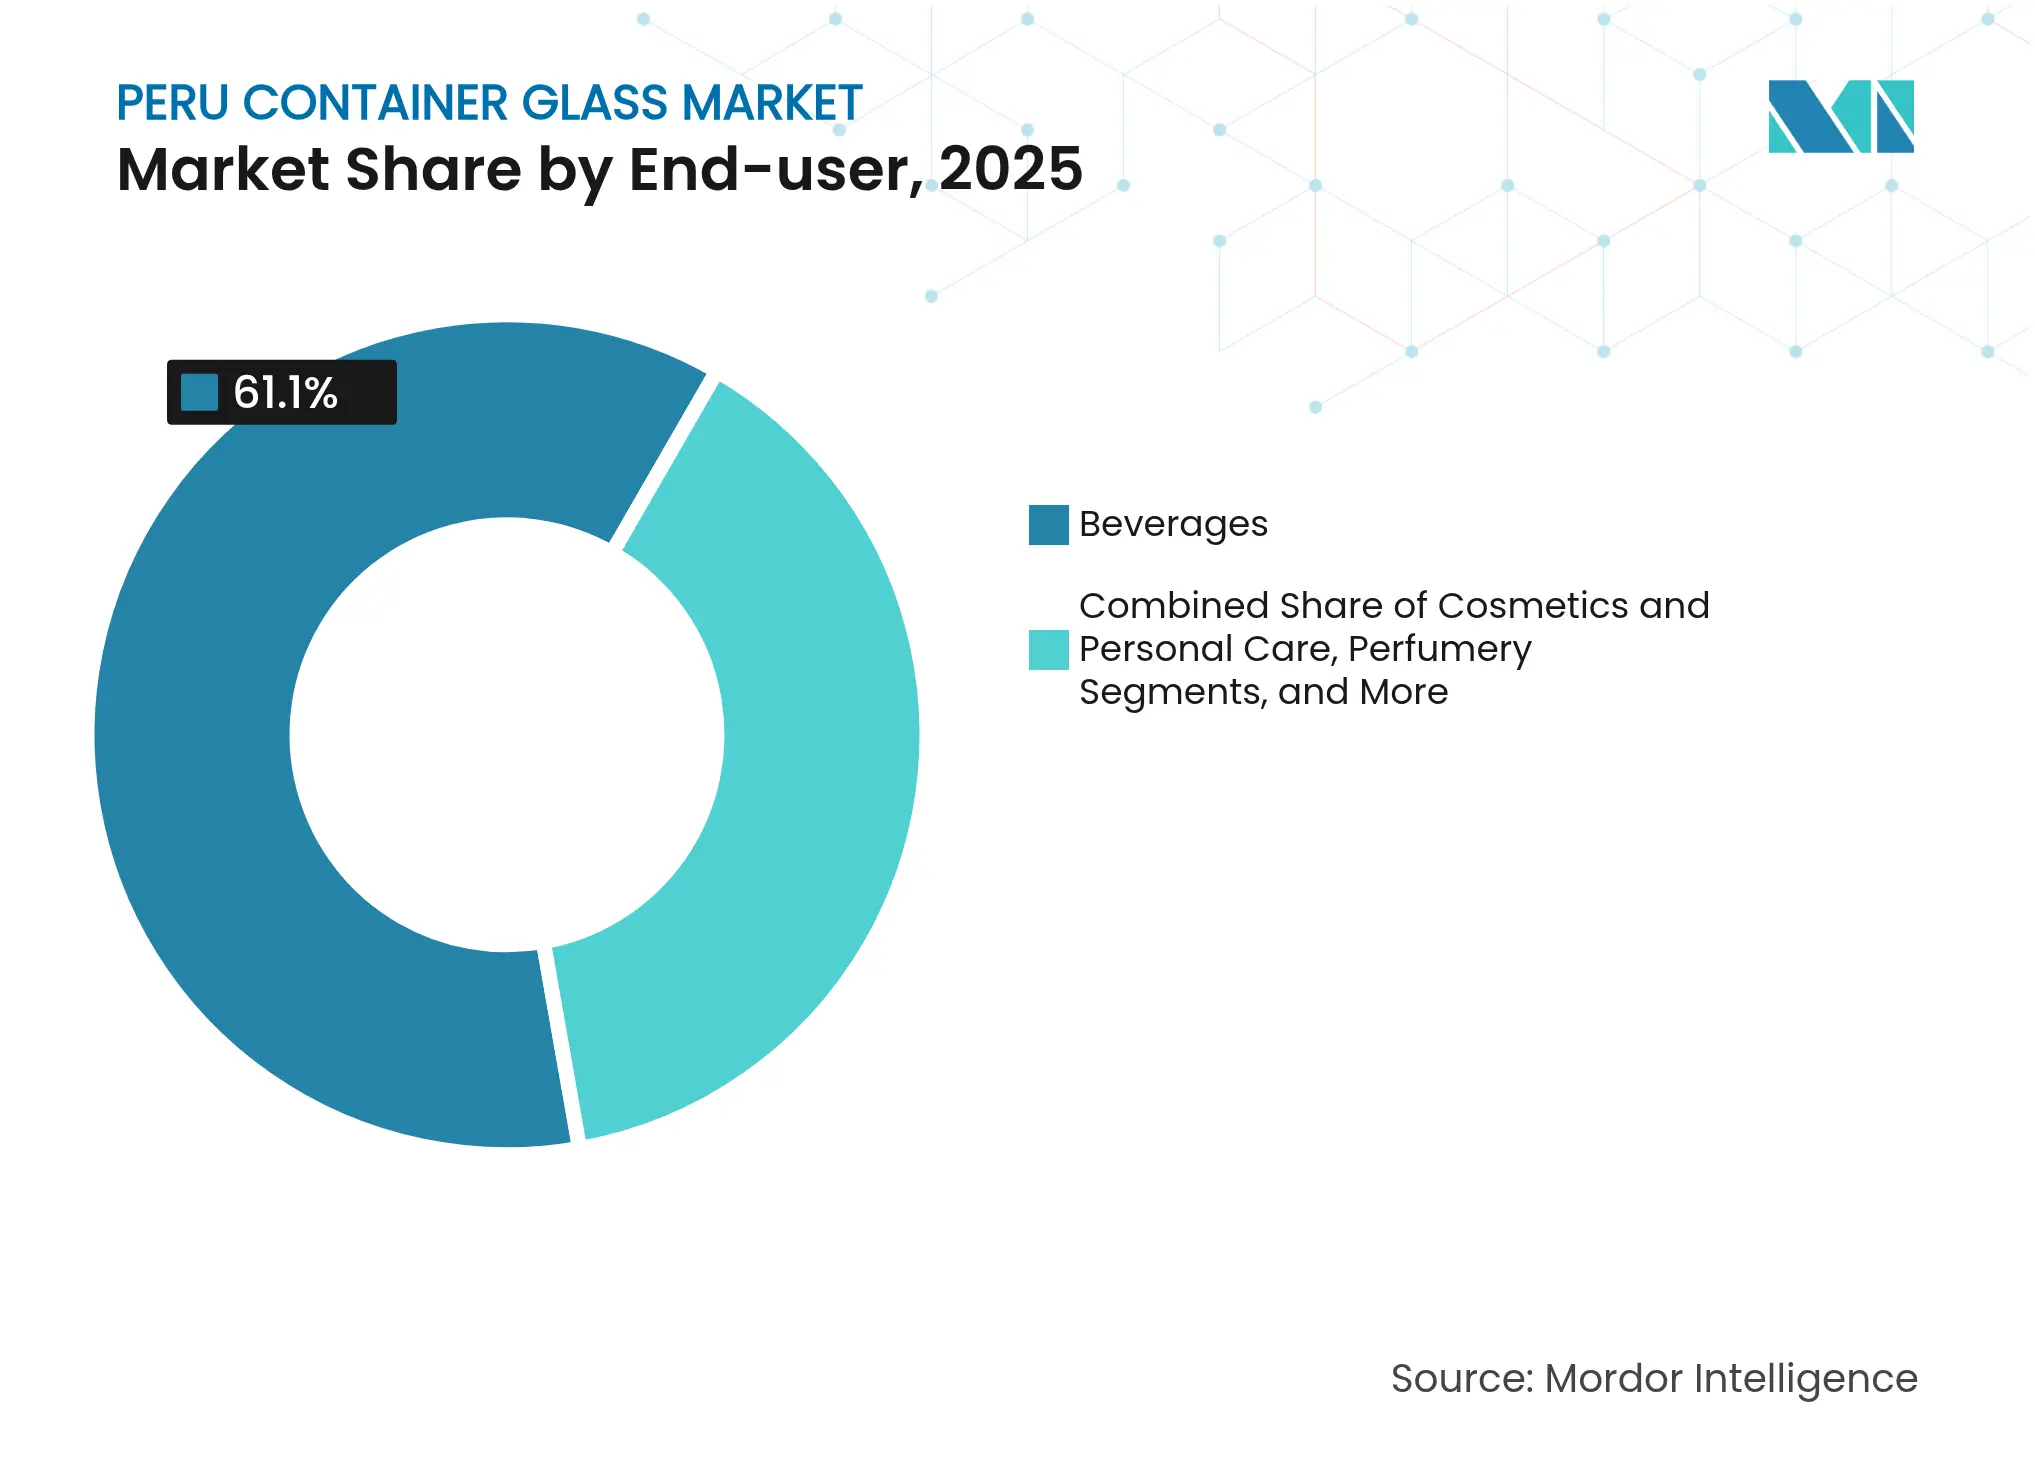
- By end-user, beverages captured 61.10% of the Peru container glass market share in 2025.
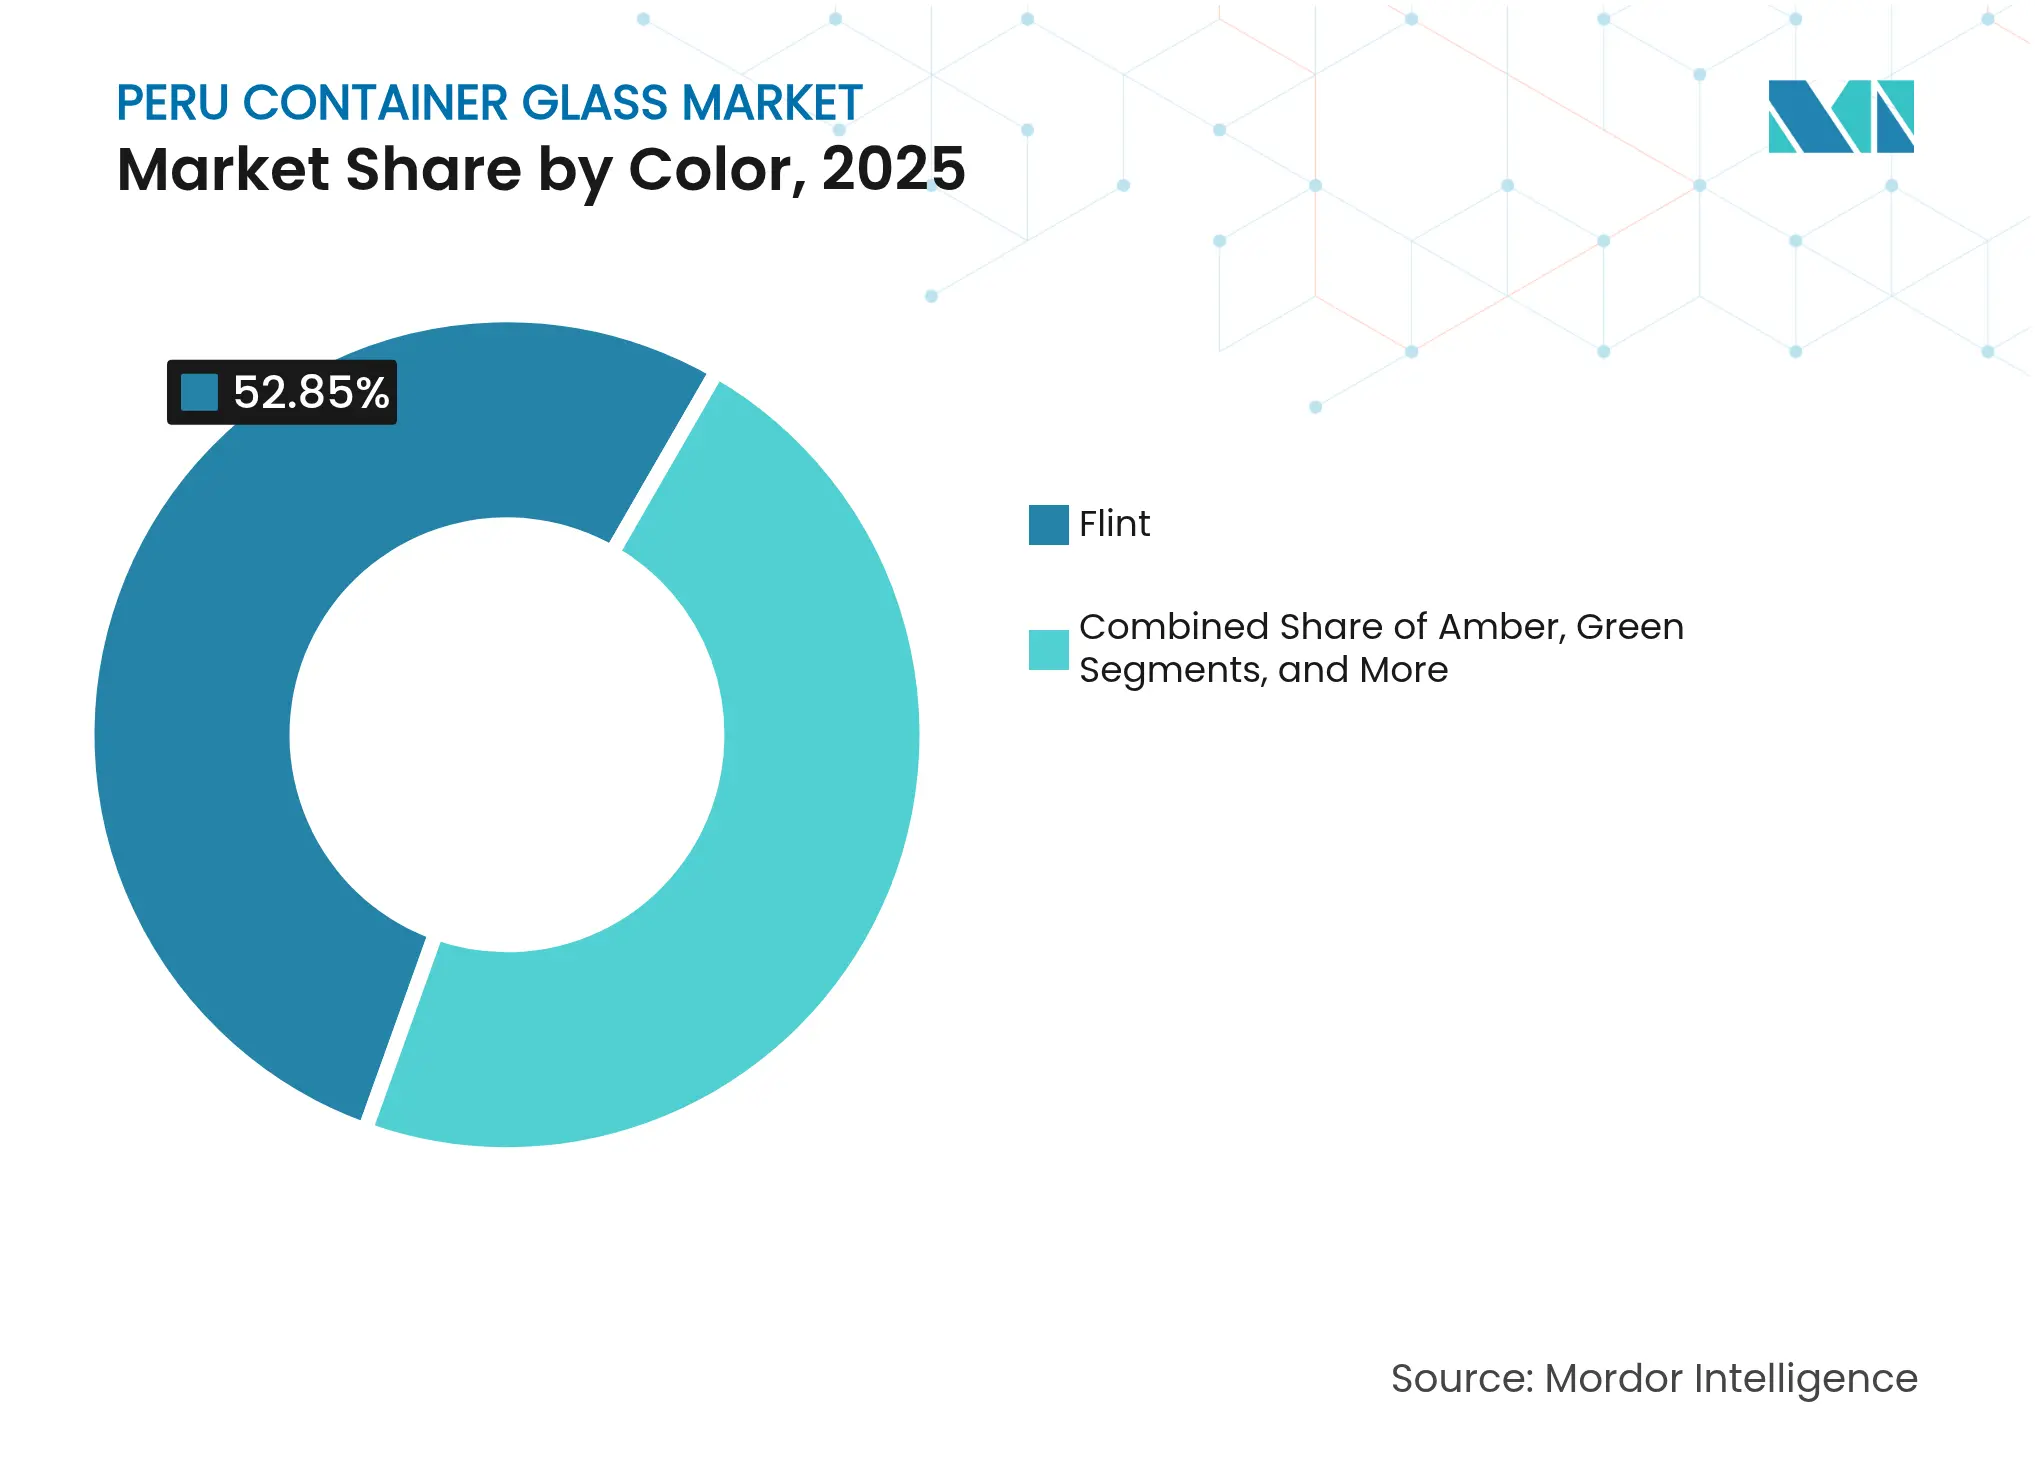
- By color, the Peru container glass market for amber glass is projected to grow at a 5.05% CAGR between 2026-2031.
Note: Market size and forecast figures in this report are generated using Mordor Intelligence's proprietary estimation framework, updated with the latest available data and insights as of 2026.
Peru Container Glass Market Trends and Insights
Drivers Impact Analysis
| Driver | (~) % Impact on CAGR Forecast | Geographic Relevance | Impact Timeline | |||
|---|---|---|---|---|---|---|
Rising demand for eco-friendly, recyclable packaging Rising demand for eco-friendly, recyclable packaging | +0.8% | National, concentrated in Lima and coastal urban centers | Medium term (2-4 years) | (~) % Impact on CAGR Forecast:+0.8% | Geographic Relevance:National, concentrated in Lima and coastal urban centers | Impact Timeline:Medium term (2-4 years) |
Surging beverage consumption Surging beverage consumption | +0.7% | National, strongest growth in Lima metropolitan area | Short term (≤ 2 years) | |||
Growth of processed-food exports in glass jars Growth of processed-food exports in glass jars | +0.5% | Export-oriented regions: Lima, Ica, Arequipa | Medium term (2-4 years) | |||
Free-trade-zone incentives spurring domestic glass capacity Free-trade-zone incentives spurring domestic glass capacity | +0.4% | Special economic zones: Tacna, Paita, Ilo, Matarani | Long term (≥ 4 years) | |||
Premiumisation of Pisco and craft-spirit bottles Premiumisation of Pisco and craft-spirit bottles | +0.3% | Pisco-producing regions: Lima, Ica, Arequipa, Moquegua, Tacna | Medium term (2-4 years) | |||
Retail-recycler tie-ups boosting cullet availability Retail-recycler tie-ups boosting cullet availability | +0.2% | Urban centers with modern retail presence | Long term (≥ 4 years) | |||
| Source: Mordor Intelligence | ||||||
Rising demand for eco-friendly recyclable packaging
Consumer awareness of circular-economy principles has expanded rapidly in Lima and other coastal cities, positioning glass containers as credible alternatives to single-use plastics. The #ReciclaConsciente initiative, a collaboration between O-I Glass and Plaza Vea, has installed in-store collection points across more than 50 supermarkets, anchoring a closed-loop model that reinjects recovered cullet into local furnaces.[2]O-I Glass, “Peru’s Plaza Vea Supermarkets Make Recycling Easy with #ReciclaConsciente,” o-i.com Legislative momentum accelerated in 2023 when Law Nº 31896 formally embedded industrial-scale recycling in Peru’s waste-management framework, opening the door for dedicated cullet-processing investments. Corporate mandates mirror these developments: Backus Brewery’s environmental management plan prioritizes recycled packaging across five facilities, creating a predictable offtake for domestic cullet. Sustainability credentials also resonate with Peru’s horticulture exporters, who increasingly select glass to meet the strict requirements of European retailers for reusable and endlessly recyclable packaging.
Surging beverage consumption
Beverage demand has rebounded on the back of a 10% sectoral upturn, led by beer and bottled water categories that heavily rely on returnable glass systems. Urban concentration amplifies this impact; 79% of Peru’s 33 million residents live in cities, with Lima alone topping 9.5 million, creating dense distribution corridors ideal for glass’s reverse logistics cycles. Modern retail footprints are now approaching 1,000 convenience stores, favoring single-serve premium beverages marketed in embossed or sleeved-decorated glass that command price premiums. Cervecería San Juan’s 60,000-bph Krones line in Pucallpa underscores brewer confidence in scalable, returnable formats. Rising disposable incomes within Peru’s expanding middle class further tilt purchases toward premium liquids packaged in glass, driven by perceived quality, taste retention, and environmental attributes. Hospitality volumes add a reinforcing loop as the tourism rebound channels upscale imports, especially spirits, through Lima’s on-premise segment.
Growth of processed-food exports in glass jars
The processed-food industry represents 28% of industrial GDP and delivered USD 8.6 billion in gross value added in 2024, underpinning steady demand for glass jars across preserves, sauces, and condiments. Trade agreements granting duty-free access to the United States and European Union incentivize exporters to match overseas quality expectations, where glass remains synonymous with freshness and premium shelf presentation. Small shippers such as ENVASES DE VIDRIO SAC repeatedly demonstrate the feasibility of niche exports, evidenced by 17,856 units of 125 ml jars shipped to Ecuador in a single consignment. Long sea voyages to North America and Europe enhance the role of glass in preventing oxidation and safeguarding texture, advantages that are difficult to replicate with polymer or metal formats. As Peru’s fruit-based value-added lines, such as mango chutneys, blueberry preserves, and marinated olives, scale, they expand the addressable base for glass packaging solutions within the Peruvian container glass market.
Free-trade-zone incentives spurring domestic glass capacity
Peru’s four operational special economic zones grant 100 % exemptions on income tax, VAT, and municipal levies through at least 2041, offering glass manufacturers a compelling arbitrage over regional peers. The 3% drawback on raw-material imports directly lowers silica sand and soda-ash input costs, which are critical for furnaces that already consume 70% of total manufacturing expenses. Tacna, Paita, Ilo, and Matarani connect efficiently to the Pacific trade lanes, allowing producers to shuttle finished bottles to Chile, Ecuador, and Western Mexico within a five-day shipping window. Investors also gain unrestricted permanence of goods, easing production planning for color campaigns. Collectively, these incentives encourage capacity additions tailored to export batches, thereby catalyzing incremental volume growth for the Peru container glass market through 2030.
Restraints Impact Analysis
| Restraint | (~) % Impact on CAGR Forecast | Geographic Relevance | Impact Timeline | |||
|---|---|---|---|---|---|---|
PET and metal-can substitution pressure PET and metal-can substitution pressure | -0.6% | National, strongest in cost-sensitive segments | Short term (≤ 2 years) | (~) % Impact on CAGR Forecast:-0.6% | Geographic Relevance:National, strongest in cost-sensitive segments | Impact Timeline:Short term (≤ 2 years) |
High energy cost for furnace operations High energy cost for furnace operations | -0.4% | Manufacturing centers: Lima, Callao, Arequipa | Medium term (2-4 years) | |||
Weak post-consumer cullet collection network Weak post-consumer cullet collection network | -0.2% | National, particularly outside Lima metropolitan area | Long term (≥ 4 years) | |||
Logistics bottlenecks for silica sand and soda-ash supply Logistics bottlenecks for silica sand and soda-ash supply | -0.2% | Manufacturing centers dependent on imported raw materials | Medium term (2-4 years) | |||
| Source: Mordor Intelligence | ||||||
PET and metal-can substitution pressure
Cost-sensitive market segments often opt for lighter, cheaper alternatives, such as PET and aluminum, particularly in traditional retail channels that still hold a 75% share outside Lima. Price volatility tied to Peru’s 0.8 % GDP growth in 2023 spurred both manufacturers and consumers to prioritize unit economics over premium aesthetics. Fragmented food processors, 90 of which qualify as micro-enterprises, lack the scale to absorb the higher logistics and breakage costs associated with glass, reinforcing the shift toward polymers. Returnable economies also wane for single-use beverages, where brand strategies hinge on cost leadership rather than heritage cues. These dynamics shave 0.6 percentage points off the forecast CAGR for the Peru container glass market.
High energy cost for furnace operations
Continuous melting furnaces operate at temperatures above 1,500 °C and account for more than one-third of total production expenses. In Peru, industrial energy tariffs rank among the highest in South America, pressuring smaller manufacturers unable to spread fixed energy overhead across large batches. Environmental compliance compounds the burden; semiannual monitoring of NOx, SO2, and particulates necessitates both testing fees and potential fuel conversion outlays. Supply chain fragility for natural gas, especially in southern regions reliant on pipeline spur lines, forces occasional shifts to pricier diesel, further tightening margins. These cost headwinds lower competitiveness against imported bottle alternatives and trim 0.4 points from the projected CAGR for the Peru container glass market.
Segment Analysis
By End-user: Beverages anchor market leadership
Beverage applications dominated the Peru container glass market size, with a 61.10% share in 2025, supported by established brewery return systems and expanding premium spirits lines. Over 2026-2031, sustained beer output and an accelerating craft-cocktail culture in Lima’s food-service venues are projected to keep the segment on a 3.1 % annual growth path. Cosmetics and personal care, although starting from a smaller base, exhibit a robust 4.95% CAGR, driven by Heinz-Glas Peru’s export-oriented production for European fragrance houses. Food exports add a steady container pull, especially in jar formats where shelf-life preservation and premium shelf presence remain critical. The pharmaceutical and perfumery niches provide counter-cyclical demand, with specialized amber and flint vials offering high margins. The diversity of applications balances volume stability with value-added growth, reinforcing the long-term expansion of the Peru container glass market.
Second-tier end-user groups reveal nuanced adoption patterns. In cold-fill dairy beverages, glass recovers a share of the premium probiotic lines that leverage better taste retention, while niche craft coffee roasters shift toward ready-to-drink brews sealed in slim flint bottles. The hospitality sector’s resurgence supports single-serve sparkling waters and imported lager in proprietary glass, though sales remain concentrated in urban centers. Meanwhile, domestic sauce and condiment producers align with front-of-package labeling rules, favoring glass to accentuate clean-label ingredients. These differentiated growth pockets add depth to overall per-capita consumption and contribute incrementally to Peru's projected gains in container glass market share for 2030.
Note: Segment shares of all individual segments available upon report purchase
By Color: Flint dominance amid amber growth
Flint continued to lead color adoption, accounting for 52.85% of Peru's container glass market share in 2025, on the back of transparent aesthetics prized by soft-drink bottlers and tabletop condiment brands. The neutral color streamlines furnace campaigns and simplifies inventory for fillers switching flavors or viscosity grades, adding operational efficiency that sustains its lead position. Nevertheless, amber is outpacing all other hues with a 5.05% CAGR to 2031, as pharmaceutical fillers and craft breweries specify higher UV shielding. Cosmetics brands also adopt amber tints to underscore natural ingredient claims, widening demand beyond medicinal formats.
Green glass occupies niche roles in wine and artisanal olive oil packaging, benefiting from Peru’s emerging enology sector in the Ica and Moquegua valleys. Specialty shades such as cobalt blue and matte black capture boutique spirits and dermocosmetic launches, although volumes remain small. Production scheduling increasingly clusters color runs in multi-furnace plants such as O-I’s Callao site, enabling swift changeovers without compromising capacity utilization. Economies of scale in cullet sorting will likely favor dominant flint and amber streams, solidifying their combined influence over forthcoming Peru container glass market size projections.
Note: Segment shares of all individual segments available upon report purchase
Geography Analysis
Lima and neighboring Callao continue to anchor 72% of the installed furnace capacity, leveraging their proximity to Peru’s largest beverage plants, food processors, and the country’s principal seaport. The agglomeration facilitates the efficient inbound reception of silica sand, soda ash, and spare parts, while supporting multimodal export routes that reach North America in under 17 days.
Demand concentration mirrors supply; roughly two-thirds of national glass consumption emanates from the capital’s 9.5 million residents and its hospitality and retail nodes. Arequipa serves as the southern production hub, supplying bottles to regional breweries, dairy factories, and pickled-vegetable factories. Backus’s plant in the province stabilizes long-term bottle contracts that involve furnace pull-throughs and backhaul empties via consolidated rail shipments, thereby mitigating Andean road constraints.
Export-oriented operations tend to gravitate towards special economic zones in Tacna and Paita, where duty exemptions and customs flexibilities streamline throughput for Latin American clients. These zones’ maritime access complements Peru’s Pan-American Highway, ensuring that west-coast Chilean and Ecuadorian markets receive replenishment cycles within one week, thereby amplifying regional spillover growth for the Peruvian container glass market.

Competitive Landscape
Market Concentration
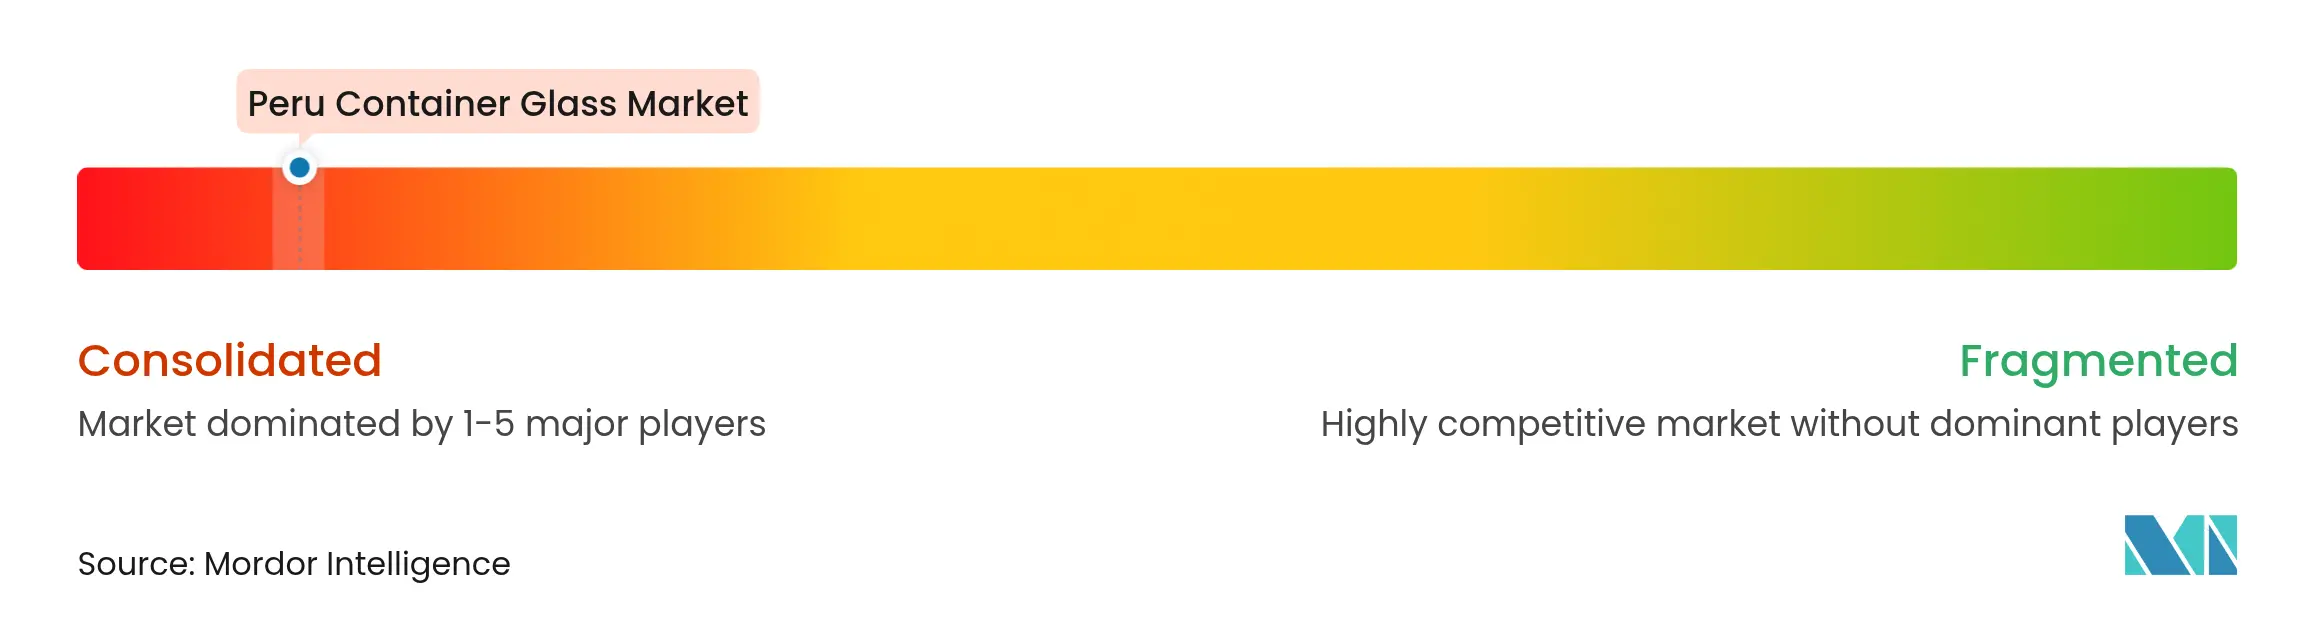
Owens-Illinois Peru retains a commanding position, operating twin facilities in Bellavista and Lurín with integrated cullet yards and high-speed NNPB lines. Majority ownership by Owens-Illinois Peru STS Inc. secures capital access for furnace rebuilds and the digitization of quality control. Heinz-Glas Peru differentiates through artisanal batch-size flexibility, exporting thick-wall flacons to high-margin fragrance houses and reinforcing Peru’s stature as a specialty container supplier.
Domestic producers, such as ENVISAC and Amfa Vitrum, sustain local food and pharmaceutical allocations, respectively, under long-term supply agreements that smooth demand seasonality. Vertical integration strategies span cullet aggregation, mold fabrication, and direct-to-filler decoration services, collectively fortifying switching costs.
White space remains in recycling infrastructure, where only 118 municipalities manage compliant waste collection systems.[3]Swiss Global Enterprise, “Waste and Recycling Management in Peru,” s-ge.com Start-ups like Irbin deploy tech-enabled segregation kiosks that collected 500,000 bottles in 2025, signaling grassroots momentum toward closed-loop supply. Meanwhile, multinational ceramic-line suppliers are exploiting capacity upgrades; KEDA Group’s 600 t/d float glass line in Cañete illustrates inbound technology partnerships that could spill over to container-grade feedstock.
Peru Container Glass Industry Leaders

*Disclaimer: Major Players sorted in no particular order
Recent Industry Developments
- May 2025: KEDA Industrial Group commenced operations at its 600 t/d float glass line in Cañete Province, marking the first local float glass supply for furnace feed.
- January 2025: BranchOut Food recorded USD 3.2 million in Q1 revenue after scaling its 50,000 square-foot Peruvian plant to full throughput.
- October 2024: Heinz-Glas Peru posted 49.69 % annual revenue growth, reflecting export demand for premium fragrance bottles.
- August 2024: The Swiss Chamber of Commerce highlighted infrastructure gaps, leaving only 118 municipalities with compliant waste-disposal coverage.
Table of Contents for Peru Container Glass Industry Report
1. INTRODUCTION
- 1.1Study Assumptions and Market Definition
- 1.2Scope of the Study
2. RESEARCH METHODOLOGY
3. EXECUTIVE SUMMARY
4. MARKET LANDSCAPE
- 4.1Market Overview
- 4.2Market Drivers
- 4.2.1Rising demand for eco-friendly, recyclable packaging
- 4.2.2Surging beverage consumption
- 4.2.3Growth of processed-food exports in glass jars
- 4.2.4Free-Trade-Zone incentives spurring domestic glass capacity
- 4.2.5Premiumisation of Pisco and craft-spirit bottles
- 4.2.6Retail-recycler tie-ups boosting cullet availability
- 4.3Market Restraints
- 4.3.1PET and metal-can substitution pressure
- 4.3.2High energy cost for furnace operations
- 4.3.3Weak post-consumer cullet collection network
- 4.3.4Logistics bottlenecks for silica sand and soda-ash supply
- 4.3.5Cooling-water scarcity regulations
- 4.4PESTEL Analysis
- 4.5Industry Supply-Chain Analysis
- 4.6Container Glass Furnace Capacity and Locations in Peru
- 4.6.1Plant Locations and Year of Commencement
- 4.6.2Production Capacities
- 4.6.3Types of Furnaces
- 4.6.4Color of Glass Produced
- 4.7Export-Import Data of Container Glass - Covering Key Import and Export Destinations
- 4.7.1Import Volume and Value, 2021-2024
- 4.7.2Export Volume and Value, 2021-2024
- 4.8Porter’s Five Forces Analysis
- 4.8.1Threat of New Entrants
- 4.8.2Bargaining Power of Suppliers
- 4.8.3Bargaining Power of Buyers
- 4.8.4Threat of Substitutes
- 4.8.5Competitive Rivalry
- 4.9Raw Material Analysis
- 4.10Recycling Trends for Glass Packaging
- 4.11Demand vs Supply Analysis for Glass Packaging
5. MARKET SIZE AND GROWTH FORECASTS (VOLUME)
- 5.1By End-user
- 5.1.1Beverages
- 5.1.1.1Alcoholic
- 5.1.1.1.1Beer
- 5.1.1.1.2Wine
- 5.1.1.1.3Spirits
- 5.1.1.1.4Other Alcoholic Beverages (Cider and Other Fermented Drinks)
- 5.1.1.2Non-Alcoholic
- 5.1.1.2.1Juices
- 5.1.1.2.2Carbonated Drinks (CSDs)
- 5.1.1.2.3Dairy Product Based Drinks
- 5.1.1.2.4Other Non-Alcoholic Beverages
- 5.1.2Food (Jam, Jelly, Marmalades, Honey, Sausages and Condiments, Oil, Pickles)
- 5.1.3Cosmetics and Personal Care
- 5.1.4Pharmaceuticals (excluding Vials and Ampoules)
- 5.1.5Perfumery
- 5.2By Color
- 5.2.1Green
- 5.2.2Amber
- 5.2.3Flint
- 5.2.4Other Colors
6. COMPETITIVE LANDSCAPE
- 6.1Market Concentration
- 6.2Strategic Moves and Developments
- 6.3Company Market Share Analysis, (Based on Latest Production Capacity)
- 6.4Company Profiles (includes Global level Overview, Market level overview, Core Segments, Financials as available, Strategic Information, Market Rank/Share for key companies, Products and Services, and Recent Developments)
- 6.4.1Owens-Illinois Peru S.A.
- 6.4.2Feemio Group Co., Ltd.
- 6.4.3Xuzhou Yanru Glass Products Co., Ltd.
- 6.4.4HEINZ-GLAS Peru S.A.C.
- 6.4.5Cristalerías Ferrand S.A.
7. MARKET OPPORTUNITIES AND FUTURE OUTLOOK
- 7.1White-space and Unmet-Need Assessment
Peru Container Glass Market Report Scope
Glass containers are vessels made from glass used to store and protect products such as food, beverages, pharmaceuticals, cosmetics, and chemicals. Available in diverse shapes and sizes, such as bottles, jars, and vials, these containers provide airtight seals and protect contents from external contaminants. Glass packaging is valued for its non-reactive nature, preservation of product quality, and high recyclability. These attributes make glass containers a preferred choice for packaging across multiple industries.
The Peru container glass market is segmented by end-user vertical (beverages [alcoholic beverages (beer, wine, spirits, and other alcoholic beverages {cider and other fermented drinks}), non-alcoholic beverages (juices, carbonated drinks (CSDs), dairy product-based drinks, other non-alcoholic beverages)], food [jam, jelly, marmalades, honey, sausages and condiments, oil, pickles], cosmetics and personal care, pharmaceuticals (excluding vials and ampoules), and perfumery, by color (green, amber, flint and other colors). The report offers market forecasts and size in volume (kilotons) for all the above segments.