Brazil Container Glass Market Size and Share
Market Overview
| Study Period | 2020 - 2031 |
|---|---|
| Forecast Data Period | 2026 - 2031 |
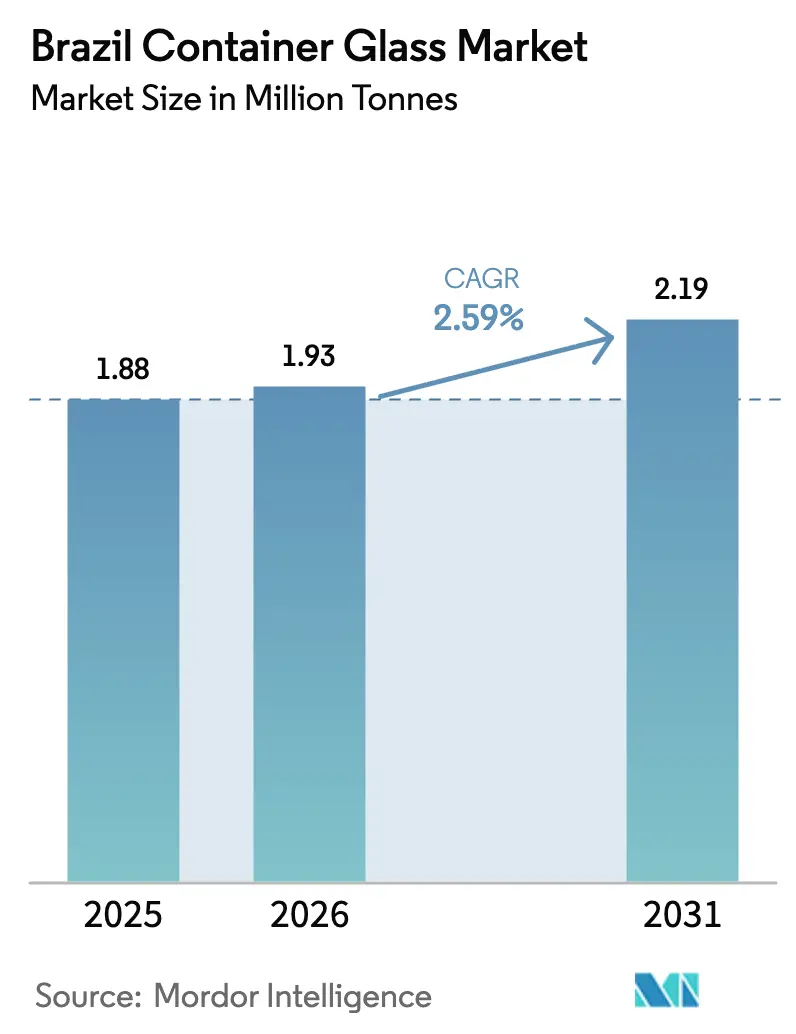
| Base Year Market Size (2025) | 1.88 Million tonnes |
| Market Volume (2026) | 1.93 Million tonnes |
| Market Volume (2031) | 2.19 Million tonnes |
| Growth Rate (2026 - 2031) | 2.59% CAGR |
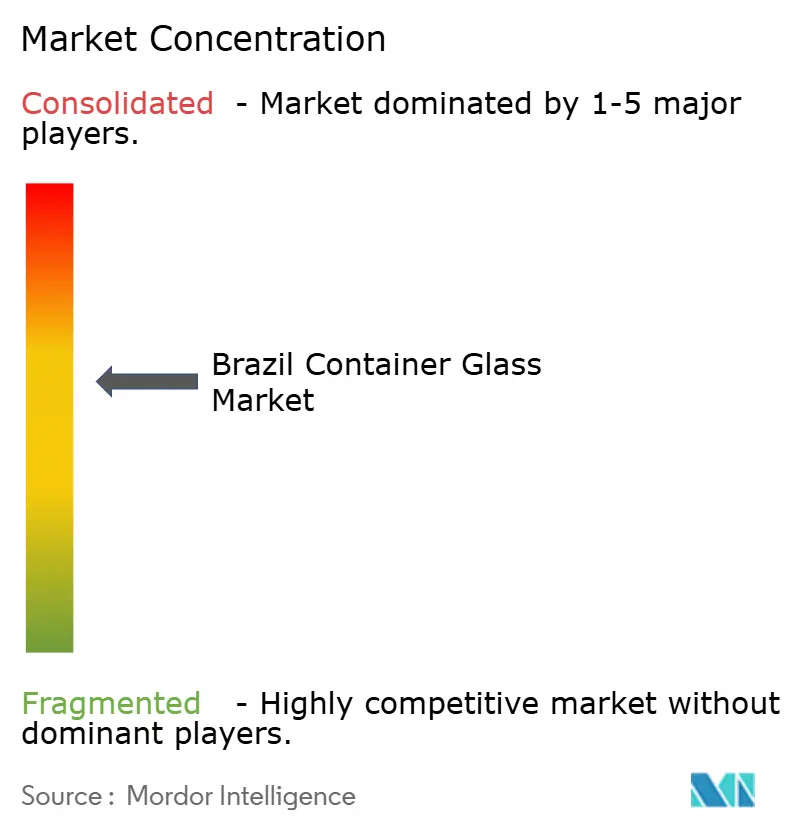
| Market Concentration | Medium |
Major Players *Disclaimer: Major Players sorted in no particular order Image © Mordor Intelligence. Reuse requires attribution under CC BY 4.0. | |
Brazil Container Glass Market Analysis by Mordor Intelligence
The Brazil Container Glass Market size is expected to grow from 1.88 Million tons in 2025 to 1.93 Million tons in 2026 and is forecast to reach 2.19 Million tons by 2031 at 2.59% CAGR over 2026-2031. Muted but steady growth reflects a maturing industry that now competes on the basis of premiumization and sustainability credentials rather than sheer output. Rising reverse logistics quotas, craft-beverage momentum, and cosmetic-fragrance uptrading collectively support demand, even as PET and aluminum substitution erode volumes in mainstream soft drinks. Consolidation is reshaping the competitive field, with Vidrala’s February 2025 purchase of Vidroporto and the Moreira Salles family’s March 2025 bid for Verallia reinforcing investor confidence in long-run fundamentals. Capital is now flowing into hybrid-electric furnaces that promise 40% energy savings and lower carbon-pricing exposure, while reverse-logistics certificates incentivize above-target recycling performance.
Key Report Takeaways
- By end-user, beverages captured 68.74% of the Brazil container glass market share in 2025.
- By color, the Brazil container glass market for amber glass is projected to grow at a 4.45% CAGR between 2026-2031.
Note: Market size and forecast figures in this report are generated using Mordor Intelligence’s proprietary estimation framework, updated with the latest available data and insights as of 2026.
Brazil Container Glass Market Trends and Insights
Drivers Impact Analysis*
| Driver | (~) % Impact on CAGR Forecast | Geographic Relevance | Impact Timeline |
|---|---|---|---|
| Eco-conscious consumer shift toward infinitely recyclable packaging | +0.8% | National; early gains in São Paulo, Rio de Janeiro, Minas Gerais | Medium term (2-4 years) |
| Premiumization in beer and craft spirits | +0.6% | National; strongest in South and Southeast | Short term (≤ 2 years) |
| Mandatory returnable-bottle quotas | +0.5% | National | Long term (≥ 4 years) |
| Craft breweries’ localized short-run orders | +0.3% | São Paulo, Santa Catarina, Rio Grande do Sul | Short term (≤ 2 years) |
| Hybrid-electric furnace investments | +0.4% | São Paulo, Rio de Janeiro, Bahia | Medium term (2-4 years) |
| Government incentives for recycled glass | +0.2% | National metropolitan areas | Long term (≥ 4 years) |
| Source: Mordor Intelligence | |||
Eco-conscious consumer shift toward infinitely recyclable packaging
Brazilian shoppers are embracing circular-economy principles, rewarding brands that adopt glass because it can be recycled endlessly without quality loss. Coca-Cola’s USD 1.25 billion 2025 spending plan includes QR-coded returnable bottles, illustrating how multinationals now treat recyclability as a brand asset. Rising environmental scrutiny and social-media activism intensify this momentum, pushing retailers to increase shelf space for glass-packaged SKUs.
Premiumization in beer and craft spirits boosting glass demand
More than 1,700 craft breweries now operate across Brazil, and their need for distinct bottle shapes, embossing, and small-batch runs favors glass over cans. Premium spirits also rely on heavier amber bottles to signal authenticity and shield liquids from UV exposure, anchoring value growth even when overall beer consumption plateaus.
Mandatory returnable-bottle quotas under new reverse-logistics law
Federal Decree No. 11,413 created tradable recycling credits, making high glass-return rates financially attractive. Glass makers investing early in collection hubs gain first-mover advantages as phased quotas tighten between 2026 and 2028.
Craft breweries’ localized short-run bottle orders
Regional producers in São Paulo, Santa Catarina, and Rio Grande do Sul source nearby glass to avoid shipping delays and to secure bespoke molds. This “local for local” model yields margin upside for manufacturers that can execute quick changeovers, supporting resilient demand pockets despite macro headwinds.
Restraints Impact Analysis*
| Restraint | (~) % Impact on CAGR Forecast | Geographic Relevance | Impact Timeline |
|---|---|---|---|
| High energy intensity and carbon-pricing exposure | -0.7% | Nationwide, more acute in grid-dependent industrial centers | Medium term (2-4 years) |
| PET and aluminum substitution in mass beverages | -0.9% | National, concentrated in mainstream beverage segments | Short term (≤ 2 years) |
| Domestic soda-ash supply bottlenecks | -0.4% | National, with regional price spikes | Short term (≤ 2 years) |
| Furnace-upgrade capital expenditure | -0.3% | Industrial clusters requiring new infrastructure | Long term (≥ 4 years) |
| Source: Mordor Intelligence | |||
High energy intensity and carbon-pricing exposure
Melting furnaces absorb roughly 60% of total production costs, exposing glass makers to volatile electricity tariffs and impending CO₂ levies. All-electric furnaces like Verallia’s 180-tonne-per-day unit in Cognac cut emissions by 60% but require large capital outlays that smaller domestic players struggle to finance. If carbon taxes rise, cost gaps versus PET could widen further.
PET and aluminum can substitution in mass beverages
Lightweight PET bottles weigh 85% less than equivalent glass, slashing freight costs across Brazil’s vast geography. Aluminum cans offer durability and quick-chill benefits, aligning with the growing trend of on-the-go consumption. Imports of plastic products worth USD 2.63 billion in 2024 evidence a robust supply for PET alternatives.[1]TradeImeX, “Brazil Import Data Breakdown: Which Industries Are Thriving?” tradeimex.in Mainstream beer and soda brands continue to migrate, dampening baseline glass volumes.
*Our forecasts treat driver/restraint impacts as directional, not additive. The impact forecasts reflect baseline growth, mix effects, and variable interactions.
Segment Analysis
By End-user: Beverages Dominate While Cosmetics Fuel Value Upside
Glass containers for beverages accounted for 68.74% of 2025 shipments, securing the largest share of the Brazilian container glass market. Premium beer and craft spirits anchor volumes, whereas specialty non-alcoholic drinks rely on clear bottles to accentuate color cues and affirm natural positioning. Craft breweries contract local suppliers for embossed and short-run orders, deepening regional interdependencies that offset PET erosion in mainstream categories. Parallel growth in ready-to-drink cocktails and cold-brew coffee offers fertile ground for custom design services that command higher per-unit margins.
Cosmetics and personal care, although still accounting for less than 10% of shipment tonnage, are on track for a 4.12% CAGR, a rate that outpaces total industry growth and tilts the value mix toward high-margin SKUs. Luxury fragrance houses specify heavy-walled flacons and intricate coloration to reinforce brand storytelling, elevating average revenue per ton. Rising disposable income in Brazil’s urban middle class, combined with the expansion of cross-border e-commerce channels, is increasing the addressable demand for premium glass packaging. Consequently, the Brazil container glass market size for cosmetics and fragrance applications is projected to grow at nearly twice the rate of total output between 2026 and 2031.


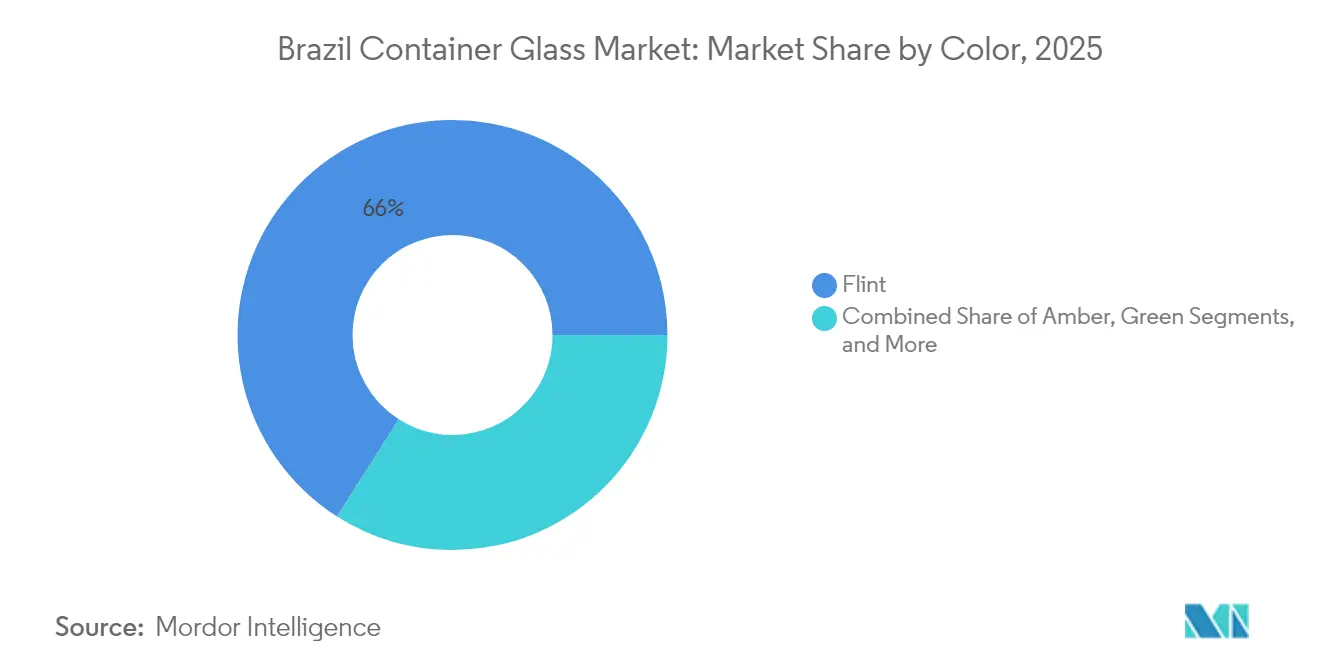
By Color: Flint Retains Scale, Amber Accelerates
Flint products accounted for 65.98% of shipments in 2025, underpinning baseline scale economies for large furnaces and multi-plant networks. Clear containers excel where visual clarity enhances merchandising, particularly for condiments, sauces, and premium juices. Standardized molds and abundant cullet streams keep unit costs competitive, sustaining the Brazil container glass market even in price-sensitive SKUs.
Amber bottles, posting a 4.45% CAGR, satisfy UV-protection mandates in pharmaceuticals and craft beer alike. ANVISA’s stricter photostability guidelines propel demand for amber vials and syrup bottles, while regional breweries prefer earthy tones that evoke authenticity. This functional-plus-aesthetic dual appeal is steadily chipping away at Flint’s share. Green glass remains prominent in wine, whereas cobalt and other specialty tints cater to niche high-end cosmetics. Custom-color capability thus becomes a strategic differentiator, especially as customers shift toward storytelling-rich packaging to capture premium shelf prices.
Geography Analysis
Production is regionally clustered, yet demand remains national, meaning most glass travels shorter distances than competing plastics. The Southeast, anchored by São Paulo and Rio de Janeiro, houses 60% of furnace capacity and serves Brazil’s densest consumer belt. Craft breweries around Campinas, Sorocaba, and Blumenau foster short lead-time demand for customized bottles, while Rio’s port network eases cullet imports when domestic soda ash supplies are tight.
The southern states, specifically Rio Grande do Sul and Santa Catarina, emerge as growth nodes. Coca-Cola Femsa’s USD 68 million Crystal water upgrade in Antônio Prado magnifies glass throughput in the region. Local wineries utilize amber and green bottles to enhance their terroir narratives, with exports to North America contributing incremental volume.
The Northeast offers long-term upside tied to food-processing expansion; however, high freight costs still limit glass penetration compared to PET. Northern Amazon states rely on river transport, which reduces glass competitiveness due to the risk of breakage. Imports from China totaled USD 502.51 million in 2024, but steep freight costs and lead times naturally cap share at niche levels. Overall, geography-driven edge goes to domestic furnaces strategically located near consumer hubs and raw material deposits, thereby reinforcing integrated supply chains.
Competitive Landscape
Brazil’s container glass market is moderately concentrated, with the top three players holding roughly 70% of the capacity; however, aggressive M&A activity suggests that the field remains dynamic. Vidrala’s USD 433 million takeover of Vidroporto in February 2025 granted it 25% share and a strategic foothold in the lucrative Southeast corridor. In March 2025, the Moreira Salles family’s EUR 30-per-share bid for Verallia underlined domestic investors’ drive to vertically integrate glass with mining and logistics assets, potentially realigning competitive alliances.[3]Reuters, “Verallia abaisse sa prévision d'Ebitda pour 2025,” reuters.com
Technology adoption differentiates leaders. Verallia pilots hybrid-electric furnaces that reduce CO₂ intensity by 40%, O-I implements its “Fit to Win” capacity utilization program, and Wheaton Brasil leverages its cosmetics specialization to secure higher margins. Capital access thus becomes the axis around which market power rotates, especially under tightening carbon rules.
Niche challengers cater to craft-brewery and cosmetics micro-runs, carving defensible niches amid macroplayer consolidation. Yet their scale disadvantages expose them to soda-ash price volatility and rising electricity tariffs. Strategic partnerships, either with cullet suppliers or contract decorators, are therefore pivotal for survival.
Brazil Container Glass Industry Leaders
Vidrala, S.A.
Owens-Illinois do Brasil Indústria e Comércio Ltda
Verallia Brasil S.A.
SGD Brasil Vidros Ltda
Vitro do Brasil Ltda
- *Disclaimer: Major Players sorted in no particular order

Recent Industry Developments
- August 2025: Brazil files WTO dispute against U.S. retaliatory tariffs, which could raise duties on glass exports to 50%, underscoring the trade-policy risk for outbound shipments.
- April 2025: Verallia cuts 2025 EBITDA outlook amid soft European demand, heightening focus on South American growth.
- March 2025: Moreira Salles family launches EUR 30-per-share (USD 34-per-share) bid for Verallia, aiming to fold the world’s third-largest container glass group into a Brazilian-controlled portfolio.
- February 2025: Vidrala finalizes USD 433 million acquisition of Vidroporto, lifting its Brazilian share to roughly 25%.


Brazil Container Glass Market Report Scope
Glass Containers refer to clean bottles and jars made from glass. The scope excludes windows and other non-container glass products. Container glass is used in the alcoholic and non-alcoholic beverage industries due to its ability to maintain chemical inertness, sterility, and non-permeability. Glass packaging is valued for its unique properties, including its transparency, inertness, and ability to preserve the quality and integrity of its contents.
Brazil container glass market is segmented by end-user vertical (beverages [alcoholic beverages (beer, wine, spirits, and other alcoholic beverages {cider and other fermented drinks}), non-alcoholic beverages (juices, carbonated drinks (CSDs), dairy product-based drinks, other non-alcoholic beverages)], food [jam, jelly, marmalades, honey, sausages and condiments, oil, pickles], cosmetics and personal care, pharmaceuticals (excluding vials and ampoules), and perfumery, by color (green, amber, flint and other colors). The report offers market forecasts and size in volume (kilotons) for all the above segments.
| Beverages | Alcoholic | Beer |
| Wine | ||
| Spirits | ||
| Other Alcoholic Beverages (Cider and Other Fermented Drinks) | ||
| Non-Alcoholic | Juices | |
| Carbonated Drinks (CSDs) | ||
| Dairy Product Based Drinks | ||
| Other Non-Alcoholic Beverages | ||
| Food (Jam, Jelly, Marmalades, Honey, Sausages and Condiments, Oil, Pickles) | ||
| Cosmetics and Personal Care | ||
| Pharmaceuticals (excluding Vials and Ampoules) | ||
| Perfumery | ||
| Green |
| Amber |
| Flint |
| Other Colors |
| By End-user | Beverages | Alcoholic | Beer |
| Wine | |||
| Spirits | |||
| Other Alcoholic Beverages (Cider and Other Fermented Drinks) | |||
| Non-Alcoholic | Juices | ||
| Carbonated Drinks (CSDs) | |||
| Dairy Product Based Drinks | |||
| Other Non-Alcoholic Beverages | |||
| Food (Jam, Jelly, Marmalades, Honey, Sausages and Condiments, Oil, Pickles) | |||
| Cosmetics and Personal Care | |||
| Pharmaceuticals (excluding Vials and Ampoules) | |||
| Perfumery | |||
| By Color | Green | ||
| Amber | |||
| Flint | |||
| Other Colors | |||


Key Questions Answered in the Report
How large is Brazil’s container glass market in 2026?
The Brazil container glass market size is 1.93 million tons in 2026 and is forecast to grow at a 2.59% CAGR through 2031.
Which end-user category drives the most demand?
Beverages led, accounting for 68.74% of shipments in 2025, supported by beer, craft spirits, and premium non-alcoholic drinks.
Why is amber glass gaining share?
Amber provides UV protection required by pharmaceuticals and craft brewers; its 4.45% CAGR makes it the fastest-growing color segment.
How is regulation shaping industry investment?
Federal reverse-logistics quotas and tradeable recycling credits are spurring furnace upgrades and returnable-bottle systems among major glass makers.
What risks threaten glass demand in mass-market drinks?
PET and aluminum substitution, driven by lighter weight and logistics savings, pose the biggest volume threat to mainstream beverage glass.
Which regions present the strongest growth?
The South and Southeast, especially São Paulo and Rio Grande do Sul, combine robust demand with new capacity investments and craft-brewery clusters.
Page last updated on:


