Ecuador Container Glass Market Size and Share
Market Overview
| Study Period | 2020 - 2031 |
|---|---|
| Forecast Data Period | 2026 - 2031 |
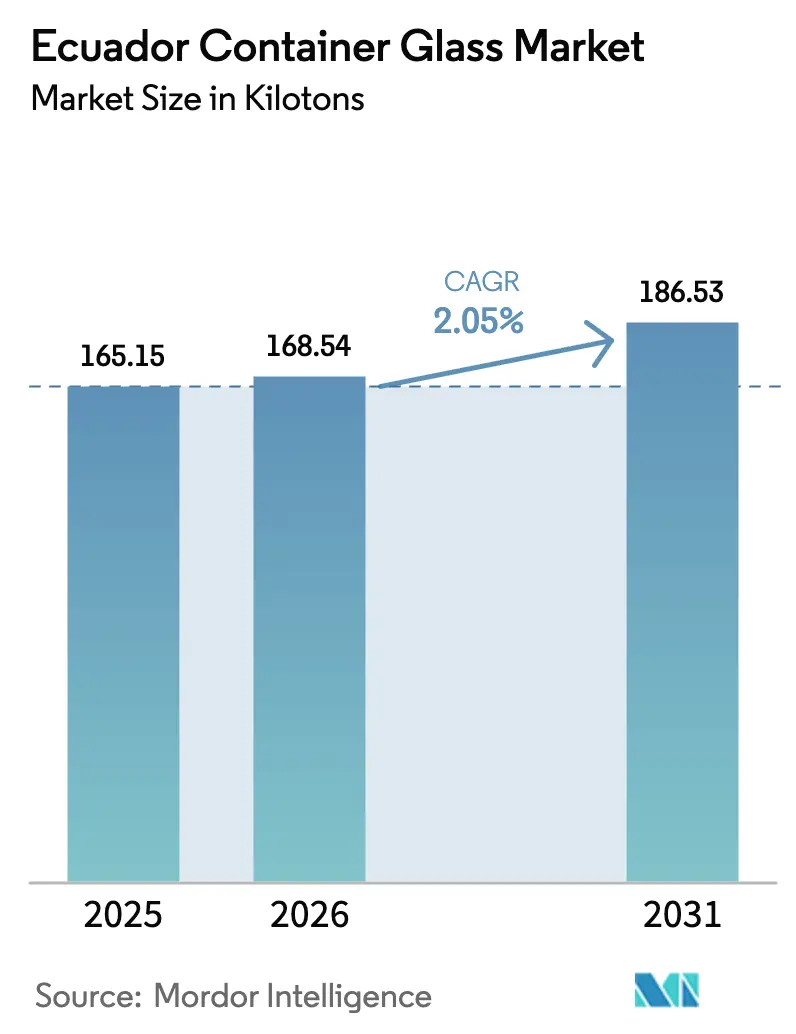
| Base Year Market Size (2025) | 165.15 kilotons |
| Market Volume (2026) | 168.54 kilotons |
| Market Volume (2031) | 186.53 kilotons |
| Growth Rate (2026 - 2031) | 2.05% CAGR |
| Market Concentration | High |
Major Players *Disclaimer: Major Players sorted in no particular order Image © Mordor Intelligence. Reuse requires attribution under CC BY 4.0. | |
Ecuador Container Glass Market Analysis by Mordor Intelligence
The Ecuador container glass market size is expected to grow from 165.15 kilotons in 2025 to 168.54 kilotons in 2026 and is forecast to reach 186.53 kilotons by 2031 at 2.05% CAGR over 2026-2031. Maturation of domestic demand, the country’s single-manufacturer structure, and stable beverage consumption underpin the current market size, while phased plastic restrictions, export-oriented food processing, and pharmaceutical fill-finish expansion keep growth on track. Rising recycling rates, formalized under extended-producer-responsibility rules, lower cullet costs for producers, and improve the circularity narrative that resonates with urban consumers. Import substitution strategies in food processing and pharmaceuticals, combined with dollarization that facilitates capital and equipment purchases, encourage value-added local production. However, drought-driven electricity rationing, fragile road infrastructure across the Andes, and lingering competition from lightweight PET and metal cans temper volume gains, pressuring glassmakers to invest in energy efficiency and lightweighting.
Key Report Takeaways
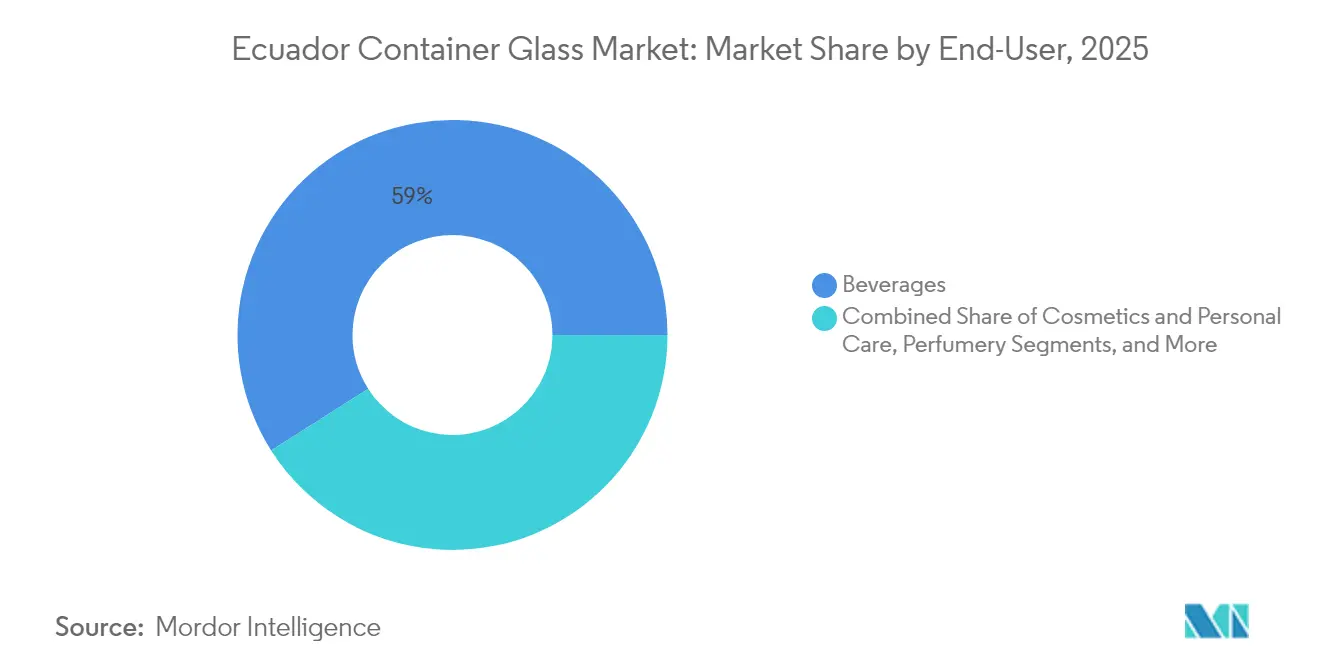
- By end-user, beverages captured 59.02% of the Ecuador container glass market share in 2025.
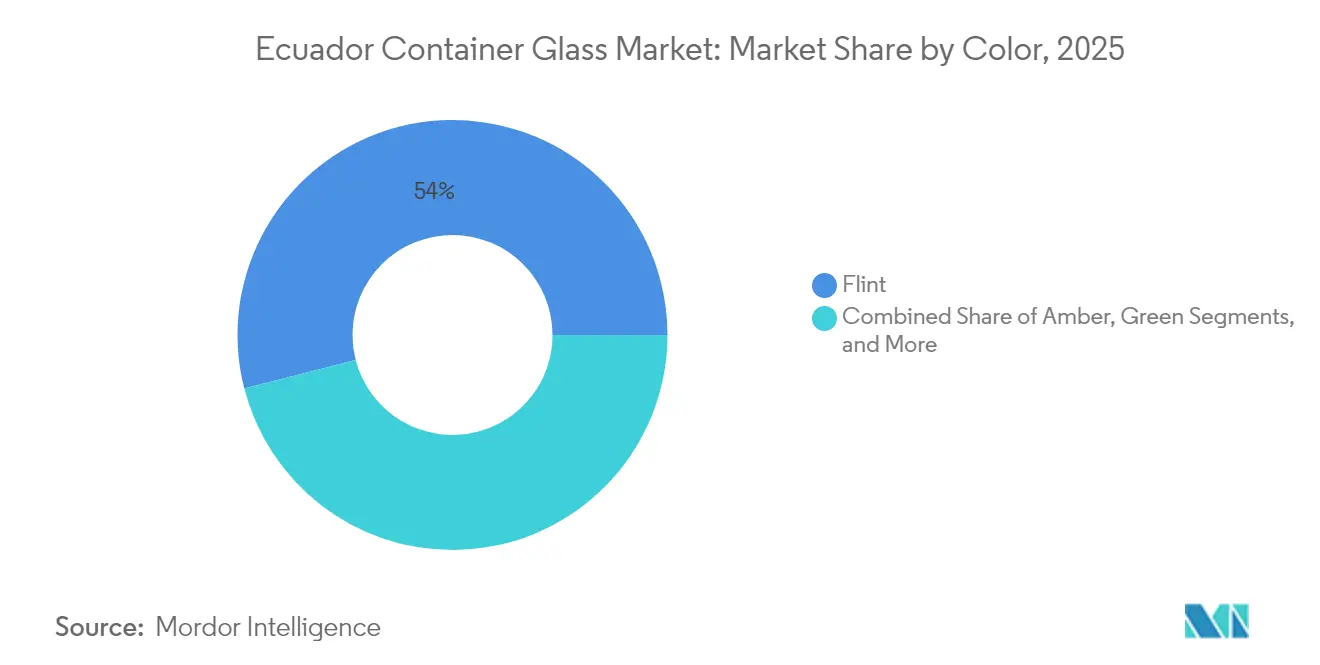
- By color, the Ecuador container glass market for amber glass is projected to grow at a 3.14% CAGR between 2026-2031.
Note: Market size and forecast figures in this report are generated using Mordor Intelligence’s proprietary estimation framework, updated with the latest available data and insights as of 2026.
Ecuador Container Glass Market Trends and Insights
Drivers Impact Analysis*
| Driver | (~) % Impact on CAGR Forecast | Geographic Relevance | Impact Timeline |
|---|---|---|---|
| Rising demand for sustainable packaging | +0.8% | National, led by Quito and Guayaquil | Medium term (2-4 years) |
| High consumption of beer, wine, spirits and CSDs | +0.6% | Urban centers nationwide | Short term (≤ 2 years) |
| Expansion in food and pharmaceutical sectors | +0.4% | Major cities, export corridors | Long term (≥ 4 years) |
| Government push for environmental regulations | +0.5% | Nationwide, provincial variation | Medium term (2-4 years) |
| Technological advancements in glass making | +0.2% | Guayaquil production hub | Long term (≥ 4 years) |
| Consumer preference for premium packaging | +0.3% | Quito and Guayaquil retail clusters | Medium term (2-4 years) |
| Source: Mordor Intelligence | |||
Rising Demand for Sustainable Packaging
The 2020 Organic Law on plastic reduction phases out several single-use formats and mandates 25% recycled content in PET beverage bottles, elevating cost structures for plastic converters and making glass a compliance-ready alternative. Retail-partnered collection programs, such as ReciVeci’s “Recicla Siempre,” offer economic incentives to informal recyclers, boosting cullet availability and reinforcing the circular economy story.[1]ReciVeci, “Recicla Siempre Pilot Launch,” reciveci.com Multinational beverage bottlers with science-based emission targets increasingly specify returnable glass, deepening long-term supply contracts with Ecuadorian filler-breweries. Brands leverage “plastic-free” claims to command shelf premiums in urban supermarkets, and growing consumer concern over microplastic contamination keeps the channel momentum positive.
High Consumption of Beer, Wine, Spirits, and Carbonated Drinks
More than 250 craft breweries operate across Ecuador, generating approximately 8,000 jobs and experiencing annual growth of nearly 20%. The segment relies on 330ml glass bottles to preserve organoleptic quality and differentiate its branding in crowded metropolitan taprooms. Imports of still wines climbed to 12.2 million liters in 2023, a 7.1% annual increase, and specialty beer imports grew 14.8% to 26.2 million liters, reinforcing premium-glass demand. Spirits volumes remain steady, yet secondary packaging upgrades in rum and aguardiente favor embossed flint bottles that communicate heritage. Quito accounts for roughly one-third of craft-beer sales, creating highly localized demand clusters that ensure efficient pallet turnaround for returnable containers.
Expansion in Food and Pharmaceutical Sectors
Government incentives to replace finished-food imports spur capital inflows into processing lines that prefer heat-stable, inert glass jars for sauces, jams, and baby foods. Annual imports of processing and packaging equipment reached USD 235 million in 2024, signaling continued plant upgrades that lift accompanying container pull-through. Regionally, pharmaceutical glass vials and ampules are projected to advance at an 8.06% CAGR to 2033, driven by the uptake of biologics, and Ecuador is expected to follow this trend as hospitals expand their chronic disease treatments. Compliance with Executive Decree 4114, which tightens norms for food-contact materials, drives formulators toward certified glass packaging that meets both domestic and export safety standards.
Government Push for Environmental Regulations
The redeemable PET bottle tax (IRBP), in effect since 2012, increased PET recovery from 20% to 80%, while simultaneously professionalizing collection routes that now handle glass cullet. Municipal bans on single-use plastics in Quito, the Galápagos, Manabí, and Azuay provinces accelerate the substitution toward glass and other permanent materials. Ecuador’s alignment with Pacific Alliance sustainability chapters signals the likely tightening of packaging eco-design rules, anchoring glass as a low-risk, regulation-ready option. Public-awareness campaigns financed through environmental fund levies spotlight refillable “growler” schemes, further normalizing glass in daily consumption habits.
Restraints Impact Analysis*
| Restraint | (~) % Impact on CAGR Forecast | Geographic Relevance | Impact Timeline |
|---|---|---|---|
| Fragility and logistics challenges | –0.3% | National, acute in highland provinces | Short term (≤ 2 years) |
| Limited domestic production capacity | –0.4% | Guayaquil manufacturing hub | Medium term (2-4 years) |
| Procurement and transparency issues | –0.2% | Public-sector procurement nationwide | Short term (≤ 2 years) |
| Competition from plastics and metals | –0.5% | Cost-sensitive segments countrywide | Medium term (2-4 years) |
| Source: Mordor Intelligence | |||
Fragility and Logistics Challenges
Only 20% of Ecuador’s road network is paved, and winding Andean passes increase the risk of breakage and freight premiums for glass, especially when serving rural retailers. National school-feeding programs opted for aseptic cartons over glass milk bottles to circumvent cold-chain requirements and minimize product loss, demonstrating cost-sensitivity in public procurement. Inland legs from the Guayaquil furnace to Quito add altitude-driven fuel surcharges, reducing the competitiveness of glass against lightweight PET in cost-focused segments. Electricity rationing episodes in 2023-2024 led to intermittent furnace idling, reduced inventory buffers, and increased lead times for SMEs. These logistics frictions constrain penetration beyond core coastal and highland urban corridors.
Limited Domestic Production Capacity
Ecuador hosts a single integrated furnace in Guayaquil, operated by O-I Cridesa. Modern glass melting requires investments of upward of USD 200 million, deterring new entrants. Import licenses for specialized molds and refractory blocks pass through multiple agencies, adding lead time for capacity upgrades. While monopoly pricing is partially moderated by regional imports, niche formats such as low-aluminum vials remain supply-constrained, exposing pharmaceutical fillers to shipment delays. Administrative burdens: 11 procedures and 48.5 days to secure a manufacturing permit further chill potential brownfield projects. Limited redundancy keeps buyers reliant on a single source, elevating supply-chain risk during furnace rebuild cycles.
*Our forecasts treat driver/restraint impacts as directional, not additive. The impact forecasts reflect baseline growth, mix effects, and variable interactions.
Segment Analysis
By End-User: Beverage Volumes Dominate as Cosmetics Accelerate
In 2025, beverages accounted for 59.02% of Ecuador's container glass market volume, reflecting entrenched consumption of beer, soda, and spirits across urban centers. Craft microbreweries fill roughly 61 bottles per 20-liter batch, and returnable-bottle loops cut packaging costs while meeting zero-waste pledges. The Ecuadorian container glass market size for beverages is projected to reach 110.6 kilotons by 2031, advancing at a 2.12% CAGR as premium imports and the expansion of cold-chain retail outlets sustain demand. Non-alcoholic malt beverages and mineral waters are increasingly choosing lightweight flint designs to compete with cans on logistics costs. Cosmetics and personal care products, although small in tonnage, are projected to post a 3.27% CAGR through 2031, driven by higher discretionary spending and social-media–driven premiumization, which encourages ornate flint flacons that highlight formulations. Local skincare lines capitalize on “clean beauty” claims by adopting recyclable glass jars, while international prestige brands continue to import decorated vials.
Food applications leverage glass’s heat tolerance for high-acid sauces and preserved fruits, benefiting from Ecuador’s push to export value-added agro-products. The Ecuador container glass market share allocated to food is expected to remain stable at 17.92% as capacity investments in retort lines increase. Pharmaceutical uptake concentrates on amber vials and ampoules, riding Latin America’s wider 8.06% CAGR in injectable drugs. Cough syrups and pediatric formulations show notable glass adoption, aligning with doctor perceptions of inertness and safety. Perfumery remains niche but gains marketing cachet from artisanal distillers of Andean botanicals who favor hand-blown bottles to justify premium SRPs.


By Color: Flint Retains Leadership, Amber Advances Rapidly
Flint glass accounted for 54.01% of 2025 shipments, buoyed by its versatility in showcasing beverage clarity and enabling vibrant label contrast. The Ecuadorian container glass market size tied to flint bottles is set to increase to 101.3 kilotons by 2031 as breweries employ neck-finish standardization to optimize returnability. Lightweighting gains mirroring Vetropack’s 30% bottle weight reduction offer a path to cut freight emissions without sacrificing shelf appeal. Flint dominance also stems from consumer preference for family-size condiment jars, which benefit from visibility and tamper-evident closures.
Amber glass, with a smaller base, records the fastest trajectory at a 3.14% CAGR through 2031, as photoprotection needs rise for biologic drugs and hopped IPAs. The Ecuador container glass market share for amber bottles is projected to rise to 28.85% by 2031, supported by brewers experimenting with barrel-aged stouts that degrade under UV light. Health and wellness beverage start-ups adopt amber droppers for functional shots, strengthening the segment pipeline. Green glass remains tied to traditional wine imports and select lagers, but its share is inching downward as producers standardize on flint for supply-chain simplicity. Recycling initiatives collect all three main color streams, and cullet color-sorting lines in Guayaquil operate at 1.5 tons per day, ensuring circular feedstock availability.
Geography Analysis
Coastal Guayas province anchors domestic production because the lone furnace is located within Guayaquil’s industrial belt, which offers port proximity for soda ash and cullet imports. The cluster shortens lead times for coastal fillers and exporters who load reefer containers with finished beverages destined for Pacific markets. Quito accounts for the single largest consumption node, capturing roughly one-third of national craft-beer sales and hosting the first Glass Hub that channels 1.5 tons of cullet daily into furnace feedstock. Highland distributors incur steep freight mark-ups due to serpentine routes exceeding 4,000 meters, yet affluent consumers sustain premium-glass demand through specialty bottle shops.
Loja and Azuay provinces form secondary consumption belts, together accounting for close to 10% of craft-beer demand and benefiting from grassroots tourism that favors local brews in returnable containers. Amazonian provinces generate limited tonnage but register above-average uptake of cosmetic glass, tied to niche botanical-extract producers marketing to eco-tourists. Ecuador's container glass market logistics chains integrate multimodal handoffs. Guayaquil–Duran rail segments feed into truck lanes ascending the Andes, while reverse loops bring cullet back, improving furnace energy efficiency by 2% for every 10% increase in cullet ratio. Dollarization stabilizes CIF import prices for specialized stoppers and decorative coatings sourced from the United States, China, and the European Union, enabling converters to manage input cost volatility.
The government’s USD 700 million Energy Competitiveness Law package, approved in 2024, unlocks renewable-electricity PPAs that could lower furnace power costs in the medium term. Coastal wind projects and Andean run-of-river hydro schemes now qualify for expedited interconnection, providing the glass sector with an avenue to decarbonize its melting operations. Municipal landfill tipping fees in Quito and Guayaquil climb annually, encouraging beverage fillers to backhaul cullet and trim disposal costs. Collectively, these geographic dynamics maintain tight coastal-highland synergies while reinforcing the value of localized recycling nodes in sustaining the Ecuador container glass market.
Competitive Landscape
Ecuador operates as a de facto single-furnace market: O-I Cridesa’s continuous-melt plant in Guayaquil furnishes flint, amber, and green containers to beverage, food, and pharma fillers. Importers from Colombia, Peru, and Chile supply niche formats such as borosilicate vials and ultra-flint cosmetic jars, injecting limited price tension into standard-neck SKUs. Energy-efficiency retrofits, including high-transmission oxy-fuel burners and batch pre-heaters, are underway to offset rising electricity tariffs and ESG-driven carbon disclosures. O-I partners with ReciVeci on the Glass Hub, reinforcing supplier-locked cullet streams, trimming melting temperatures by up to 40 °C, and shrinking Scope 1 emissions.[3]ReciVeci, “Latitude R – ECU Project Overview,” reciveci.com
Regional fillers seek differentiated decoration, such as acid-etch finishes, low-lead crystal, and laser coding, to appeal to millennials and Gen Z consumers who prioritize premium packaging. Imported shrink-sleeve applicators enable local fillers to run limited-edition designs without high label inventory, sustaining higher ASPs per case. Lightweighting remains the chief technical battleground: trials on 250ml amber beer bottles show a 10% reduction in glass usage without compromising top-load strength, unlocking freight-cost savings and improved breakage performance on mountain roads.
Brand owners adopt supply-chain financing to cover the 90-day float of returnable-glass cycles, using bank guarantees secured against bottle pools. Larger breweries often maintain in-house bottle-washing lines, whereas emerging craft producers tend to outsource this service, highlighting opportunities for shared glass logistics platforms. Regulatory adherence, particularly the execution of plastic-reduction milestones, strengthens the competitive moat for glass, while tax incentives on renewable-energy adoption reduce future operating-cost disparities against PET converters. Overall, capital intensity, closed-loop cullet access, and regulatory alignment sustain a moderate level of competitive intensity in the Ecuadorian container glass market.
Ecuador Container Glass Industry Leaders
O-I Glass, Inc.
Vitro, S.A.B. de CV
PSC Products Inc. (Vivaplex)
Ecuaenvases Cia Ltda.
Feemio Group Co., Ltd.
- *Disclaimer: Major Players sorted in no particular order

Recent Industry Developments
- January 2025: ReciVeci launched the “Recicla Siempre” pilot with Mi Comisariato, adding four retail-based drop-off stations in Quito that capture glass alongside other recyclables, rewarding collectors with digital points redeemable for groceries.
- October 2024: Ecuavisa highlighted Glass Hub performance; the facility hit 1.5 tons per day throughput within its first quarter of operation, providing Ecuador’s first dedicated glass-only collection center.
- July 2024: The eighth Copa Cervecera Mitad del Mundo gathered 600 Latin American beer brands, underscoring the craft sector’s milestone of 250 breweries and 8,000 jobs.
- July 2024: The World Bank approved USD 700 million in development financing, with energy clauses enabling private renewable generation that benefits energy-intensive glass melting.


Ecuador Container Glass Market Report Scope
Ecuador Containers refer to clean bottles and jars made from glass. The scope excludes windows and other non-container glass products. Container glass is used in the alcoholic and non-alcoholic beverage industries due to its ability to maintain chemical inertness, sterility, and non-permeability. Glass packaging is valued for its unique properties, including its transparency, inertness, and ability to preserve the quality and integrity of its contents. The Bulgaria glass containers market tracks the shipment volume of different types of glass containers across end-user industries in the market.
Ecuador container glass market is segmented by end-user vertical (beverages [alcoholic beverages (beer, wine, spirits, and other alcoholic beverages {cider and other fermented drinks}), non-alcoholic beverages (juices, carbonated drinks (CSDs), dairy product-based drinks, other non-alcoholic beverages)], food [jam, jelly, marmalades, honey, sausages and condiments, oil, pickles], cosmetics and personal care, pharmaceuticals (excluding vials and ampoules), and perfumery, by color (green, amber, flint and other colors). The report offers market forecasts and size in volume (kilotons) for all the above segments.
| Beverages | Alcoholic | Beer |
| Wine | ||
| Spirits | ||
| Other Alcoholic Beverages (Cider and Other Fermented Drinks) | ||
| Non-Alcoholic | Juices | |
| Carbonated Drinks (CSDs) | ||
| Dairy Product Based Drinks | ||
| Other Non-Alcoholic Beverages | ||
| Food (Jam, Jelly, Marmalades, Honey, Sausages and Condiments, Oil, Pickles) | ||
| Cosmetics and Personal Care | ||
| Pharmaceuticals (excluding Vials and Ampoules) | ||
| Perfumery | ||
| Green |
| Amber |
| Flint |
| Other Colors |
| By End-user | Beverages | Alcoholic | Beer |
| Wine | |||
| Spirits | |||
| Other Alcoholic Beverages (Cider and Other Fermented Drinks) | |||
| Non-Alcoholic | Juices | ||
| Carbonated Drinks (CSDs) | |||
| Dairy Product Based Drinks | |||
| Other Non-Alcoholic Beverages | |||
| Food (Jam, Jelly, Marmalades, Honey, Sausages and Condiments, Oil, Pickles) | |||
| Cosmetics and Personal Care | |||
| Pharmaceuticals (excluding Vials and Ampoules) | |||
| Perfumery | |||
| By Color | Green | ||
| Amber | |||
| Flint | |||
| Other Colors | |||


Key Questions Answered in the Report
What is the current volume and expected CAGR for Ecuador container glass market through 2031?
Shipments reached 168.54 kilotons in 2026 and are projected to grow at a 2.05% CAGR, reaching 186.53 kilotons by 2031.
Which end-use segment consumes the most container glass in Ecuador?
Beverages dominate, accounting for 59.02% of 2025 volume thanks to robust craft-beer, wine, spirits and soft-drink demand.
Why is amber glass growing faster than other color segments in Ecuador?
Pharmaceutical vials and premium beer styles that need UV protection are driving amber’s 3.14% CAGR, the highest among color categories.
How do Ecuador’s plastic-reduction laws influence container choices for beverage brands?
Mandated recycled-PET content and phased bans on single-use plastics make glass the compliant, premium alternative, steering brands toward returnable bottles.
What logistics challenges affect glass bottle distribution in highland provinces?
Only one-fifth of roads are paved; winding Andean routes raise breakage risk and freight costs, making rural deliveries more expensive than coastal shipments.
Who supplies most of Ecuador’s container glass and how concentrated is production?
O-I Cridesa operates the nation’s only furnace, giving it more than 60% share, while imports from Colombia, Peru and Chile fill niche format gaps.
Page last updated on:


