Paper Cups And Container Forming Equipment Market Size and Share
Market Overview
| Study Period | 2020 - 2031 |
|---|---|
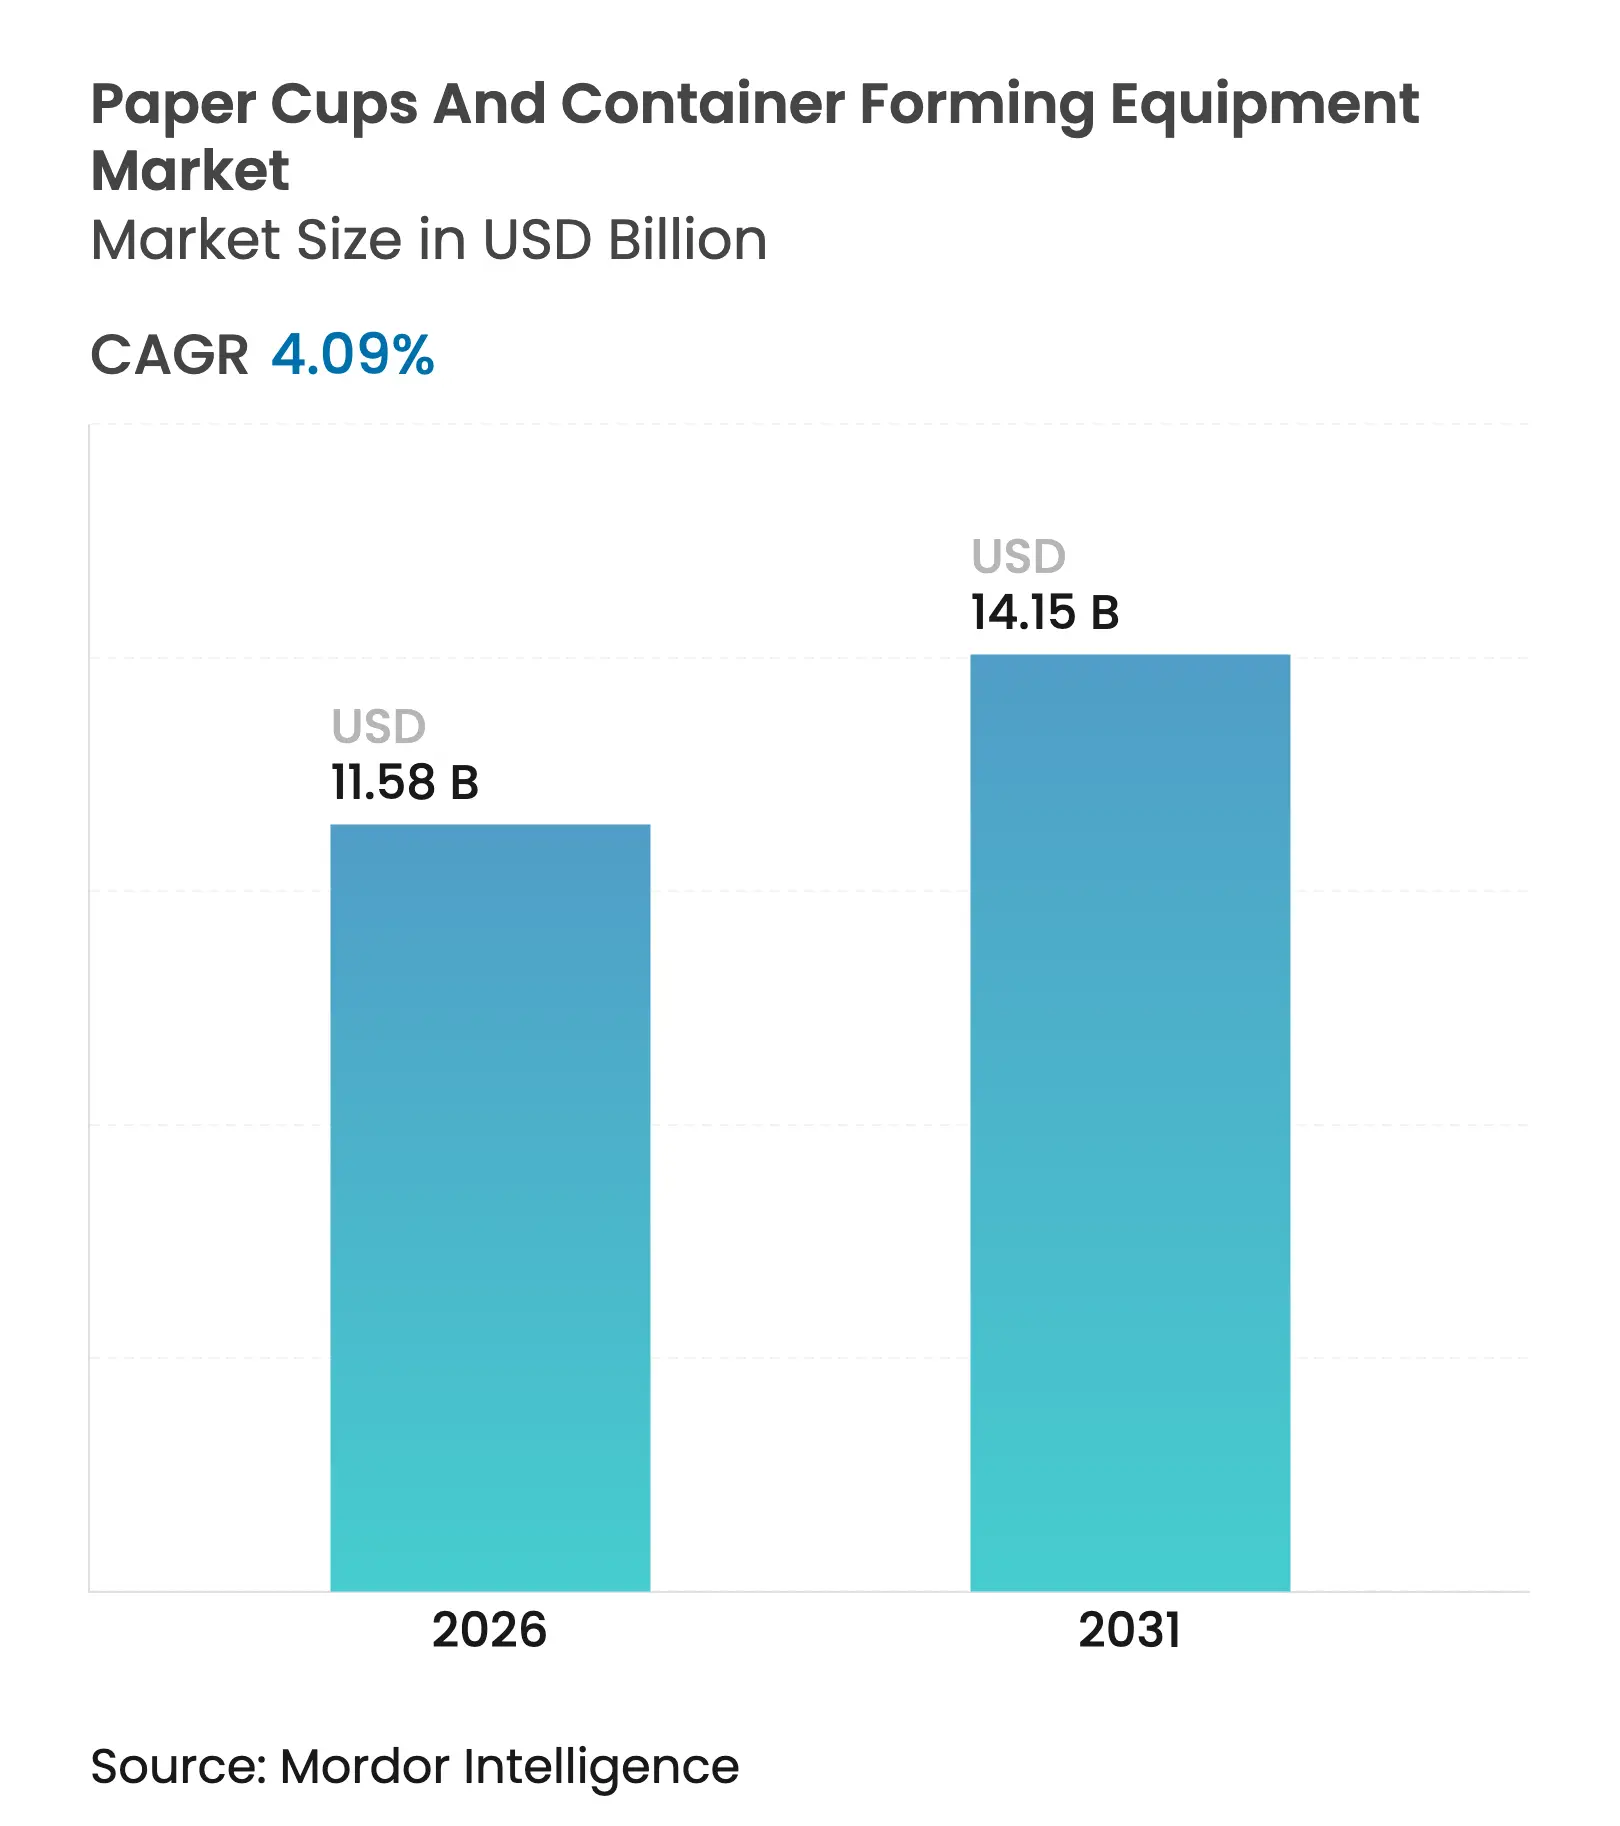
| Market Size (2026) | USD 11.58 Billion |
| Market Size (2031) | USD 14.15 Billion |
| Growth Rate (2026 - 2031) | 4.09 % CAGR |
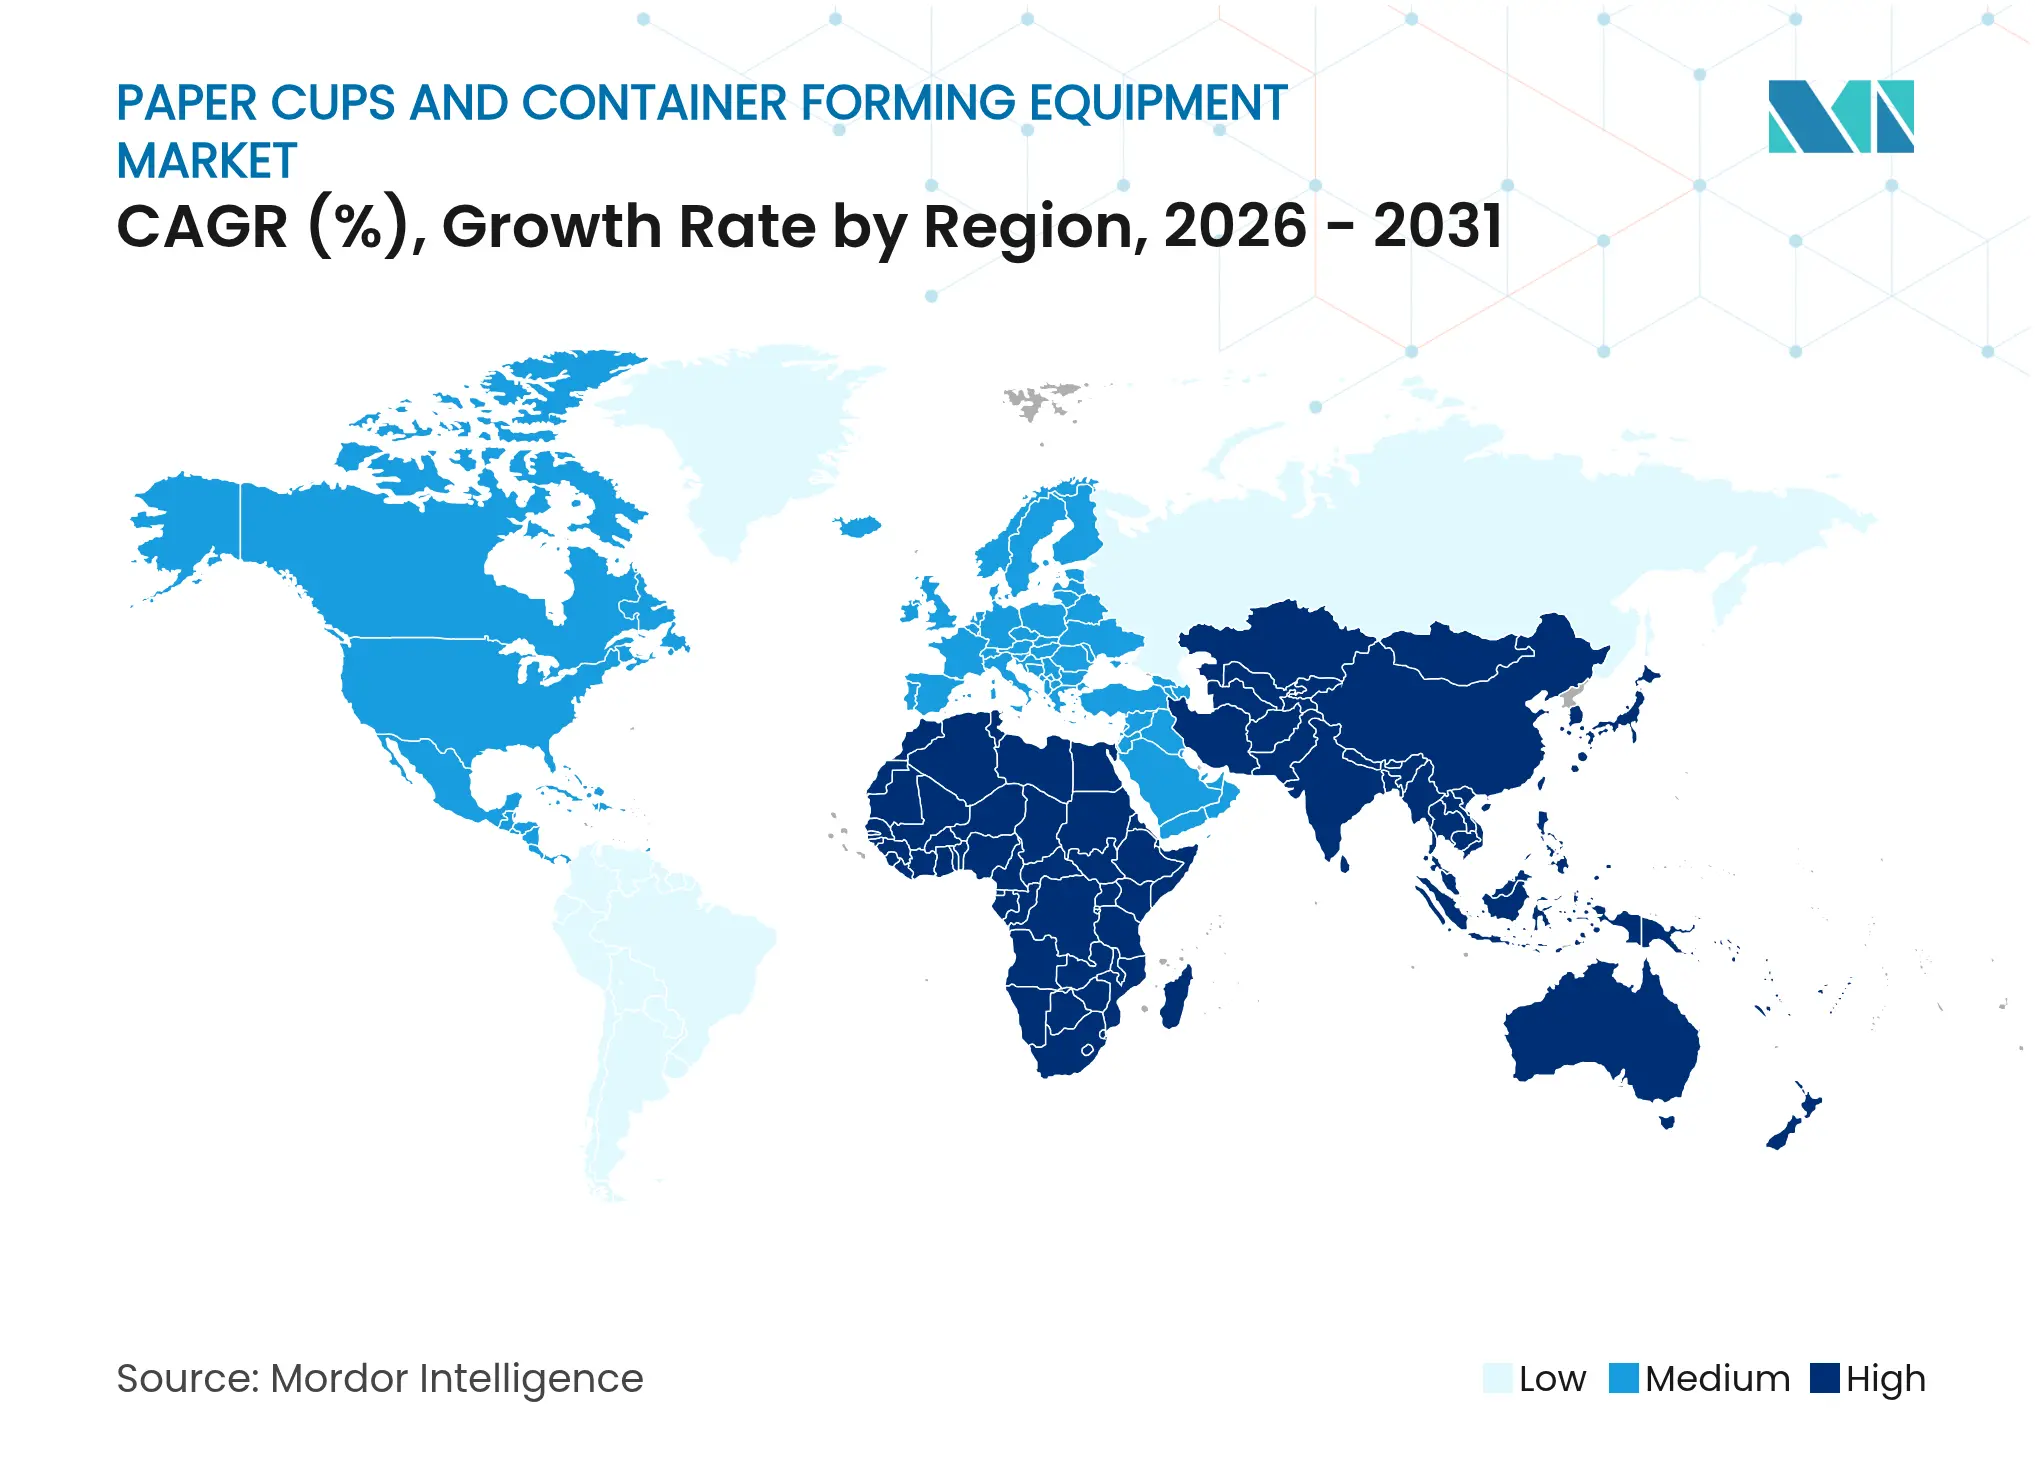
| Fastest Growing Market | Asia Pacific |
| Largest Market | Asia Pacific |
| Market Concentration | Medium |
Major Players *Disclaimer: Major Players sorted in no particular order. Image © Mordor Intelligence. Reuse requires attribution under CC BY 4.0. |
Paper Cups And Container Forming Equipment Market Analysis by Mordor Intelligence
The paper cups and container forming equipment market size reached USD 11.58 billion in 2026 and is projected to rise to USD 14.15 billion by 2031, advancing at a 4.09% CAGR. Current growth is driven by regulatory bans on single-use plastics, rapid expansion of outlets by quick-service restaurants, and steady technological upgrades that increase output per machine. Converters everywhere are adopting servo-driven systems to counter labor shortages, while European composability rules are accelerating a shift from polyethylene to aqueous or PLA barrier coatings. These shifts increase the demand for retrofittable modules that integrate Industry 4.0 connectivity into legacy lines, thereby compressing lead times to match QSR rollouts. Supply volatility for coated cup-stock paper and skilled labor gaps in the Asia-Pacific region temper the upside but reinforce the appeal of bundled maintenance contracts, which lower the total cost of ownership.
Key Report Takeaways
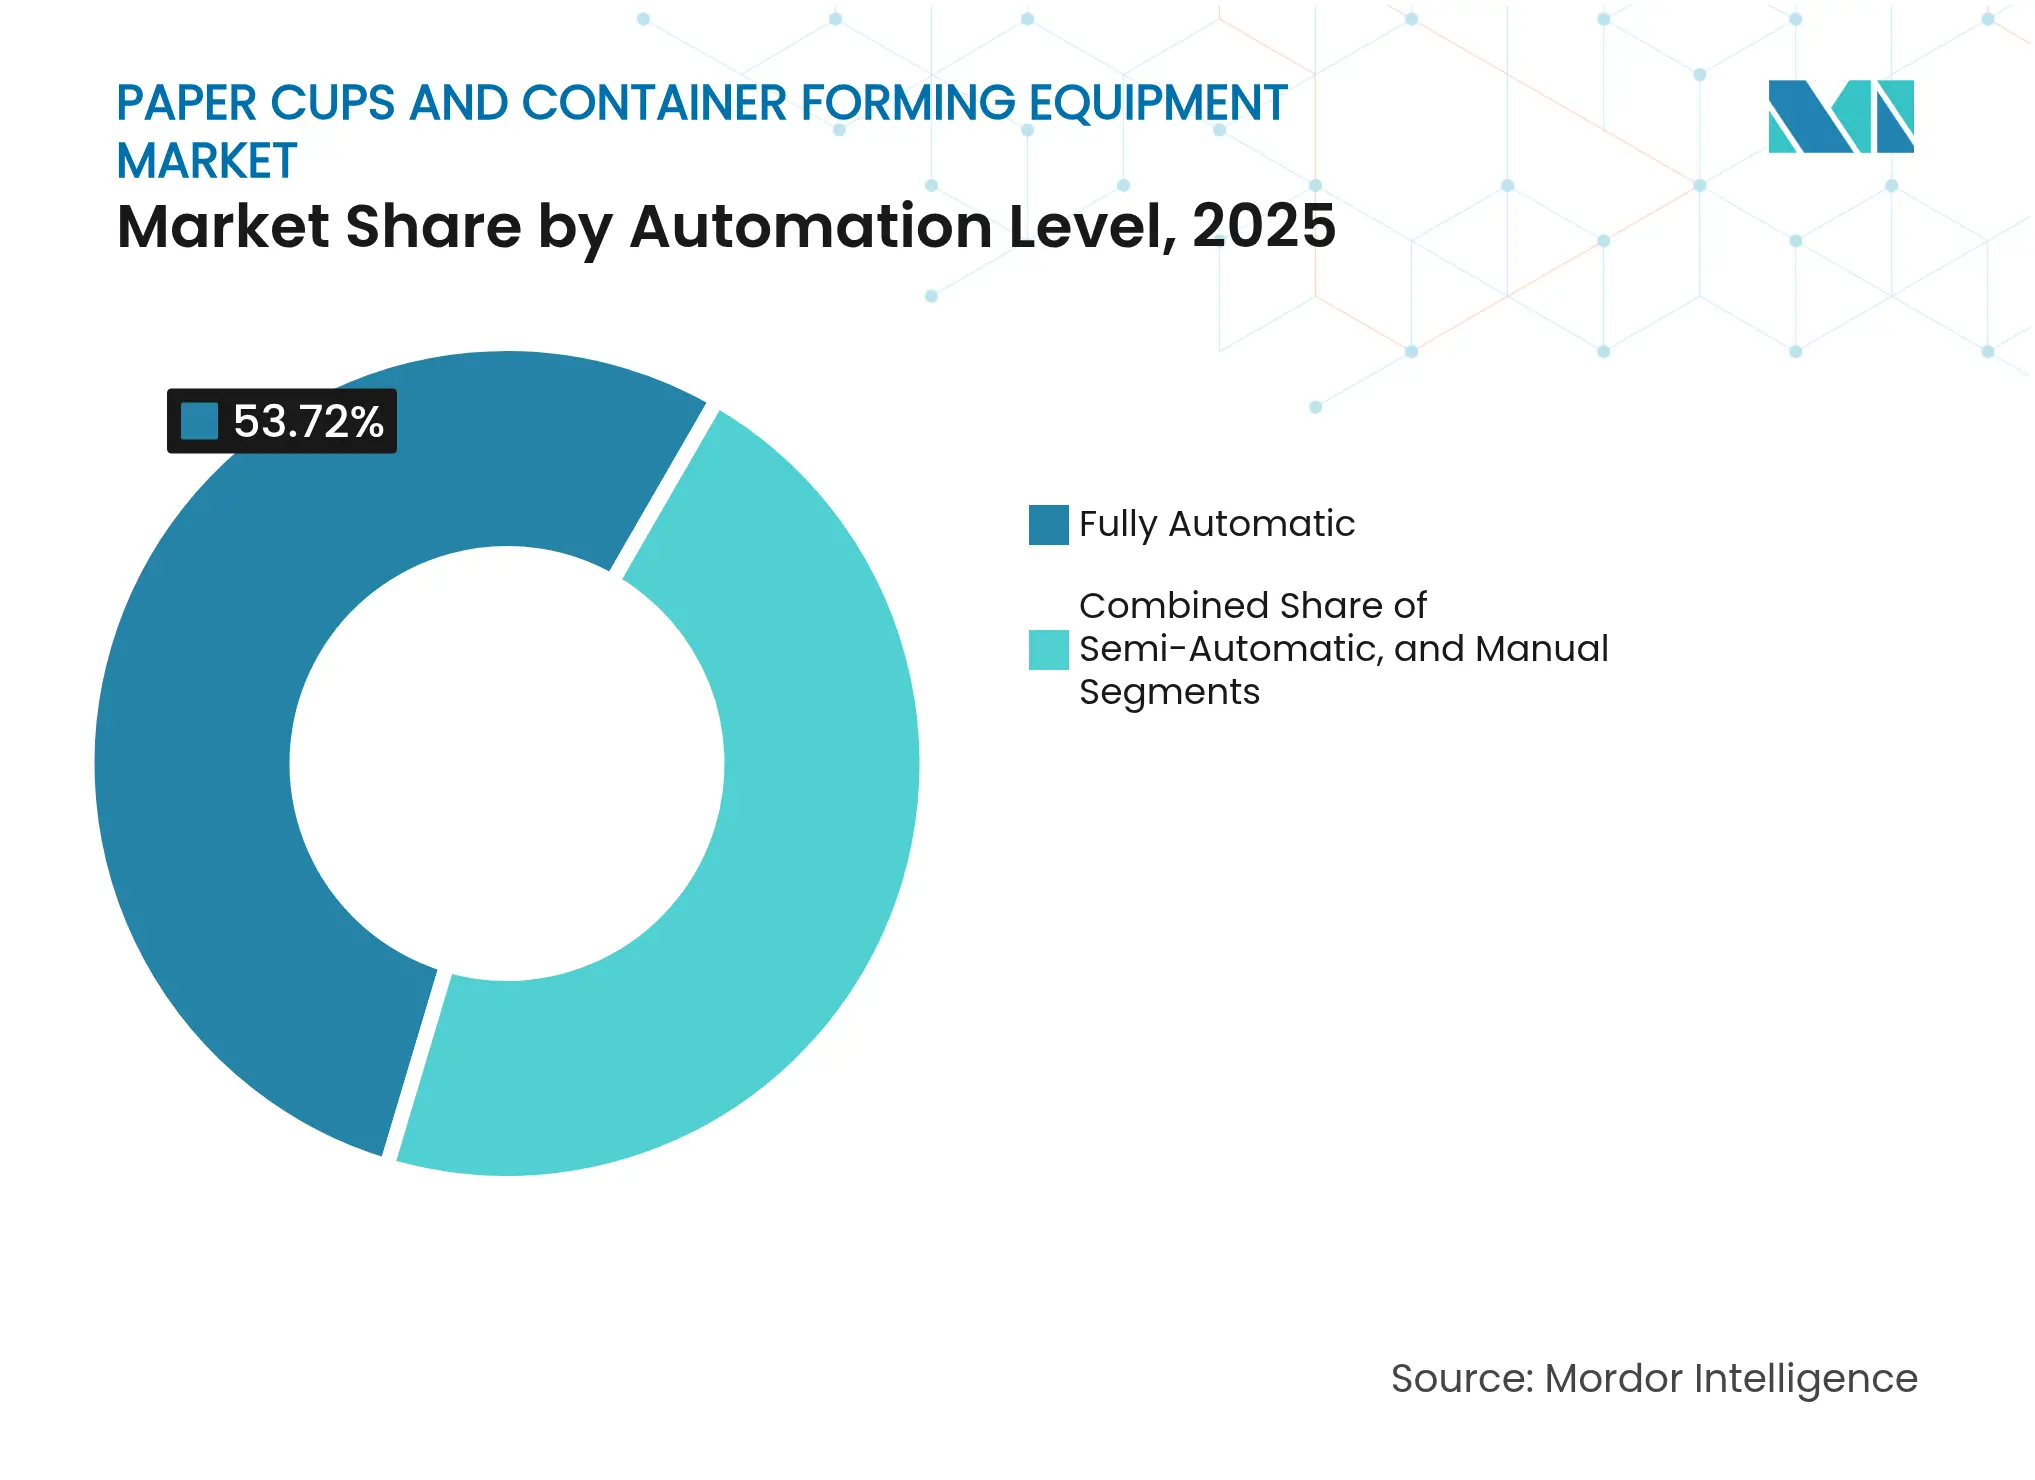
- By automation level, fully automatic equipment captured 53.72% of the paper cups and container forming equipment market share in 2025.
- By equipment type, the paper cups and container forming equipment market size for sleeve and double-wall formats is projected to grow at a 6.25% CAGR from 2026 to 2031.
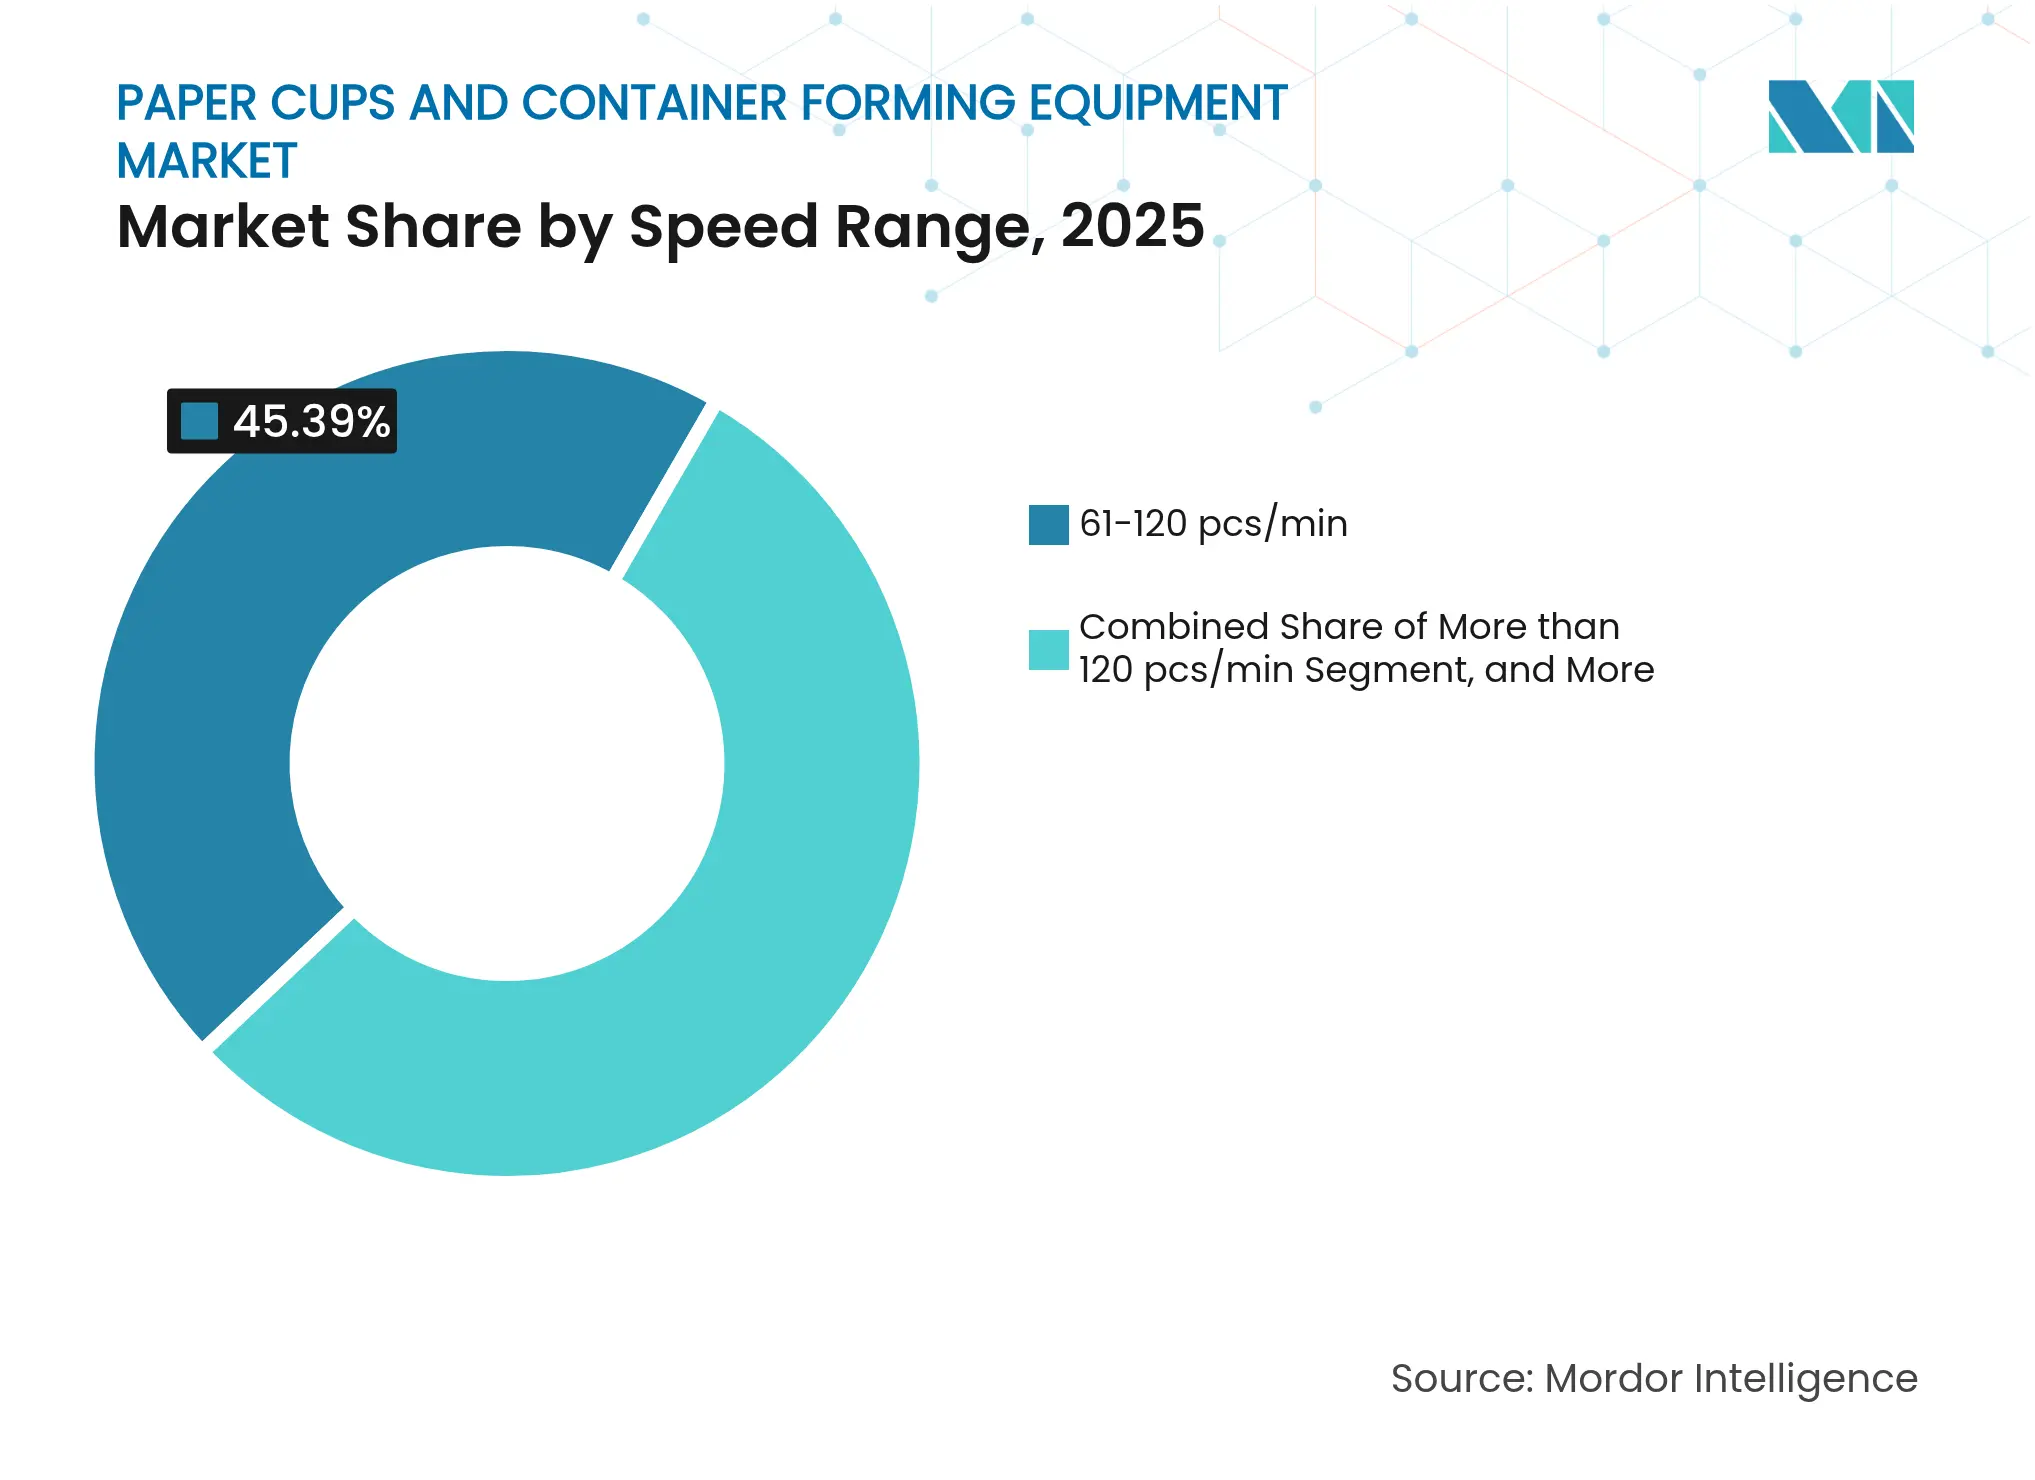
- By speed range, mid-speed systems captured 45.39% of the paper cups and container forming equipment market share in 2025.
- By end-user, the paper cups and container forming equipment market size for contract tableware manufacturers is projected to grow at a 6.39% CAGR from 2026 to 2031.
- By geography, Asia-Pacific captured 34.61% of the paper cups and container forming equipment market share in 2025.
Global Paper Cups And Container Forming Equipment Market Trends and Insights
Drivers Impact Analysis
| Driver | (~) % Impact on CAGR Forecast | Geographic Relevance | Impact Timeline | |||
|---|---|---|---|---|---|---|
Rising Innovation in Forming-Equipment Technologies Rising Innovation in Forming-Equipment Technologies | +0.8% | Global, with early adoption in Europe and East Asia | Medium term (2-4 years) | (~) % Impact on CAGR Forecast:+0.8% | Geographic Relevance:Global, with early adoption in Europe and East Asia | Impact Timeline:Medium term (2-4 years) |
Regulatory Bans on Single-Use Plastics Regulatory Bans on Single-Use Plastics | +1.2% | Europe, North America, India, select ASEAN markets | Short term (≤ 2 years) | |||
Growth of QSR and On-The-Go Beverage Culture Growth of QSR and On-The-Go Beverage Culture | +0.9% | Global, strongest in APAC and North America | Long term (≥ 4 years) | |||
Demand for Eco-Friendly Packaging in Food Demand for Eco-Friendly Packaging in Food | +0.7% | Europe, North America, urban APAC | Medium term (2-4 years) | |||
Industry 4.0 Predictive-Maintenance Adoption Industry 4.0 Predictive-Maintenance Adoption | +0.5% | Europe, North America, and China coastal clusters | Long term (≥ 4 years) | |||
Compostable Barrier-Coating Breakthroughs Compostable Barrier-Coating Breakthroughs | +0.6% | Europe (EN 13432), North America (BPI), Australia (AS5810) | Medium term (2-4 years) | |||
| Source: Mordor Intelligence | ||||||
Regulatory Bans on Single-Use Plastics
The European Union’s Packaging and Packaging Waste Regulation 2025/40 mandates that all packaging placed on the market be reusable or recyclable by 2030, while exempting fiber-based cups that meet the EN 13432 compostability norms. This carve-out amplifies demand for high-speed lines compatible with aqueous and PLA coatings. In the United States, California Assembly Bill 1276 restricts the automatic distribution of plastic food-service ware, prompting chains to overhaul their cup procurement. India intensified enforcement of its Plastic Waste Management Amendment Rules in 2025, levying penalties of INR 100,000 (USD 1,200) per infraction, which pushed thousands of street vendors toward affordable paper cups. Collectively, these measures create a near-term demand spike for forming machines that can switch substrates without time-consuming changeovers.
Growth of QSR and On-The-Go Beverage Culture
Starbucks added 3,200 new stores in 2024, including 1,100 in China, which translates to an incremental demand of roughly 550 million cups each year.[1]Starbucks Corporation, “Annual Report 2024,” investor.starbucks.com McDonald’s is committed to sourcing 100% fiber-based packaging by 2027, an initiative that requires an extra 2 billion paper cups annually. Franchisees prefer contract manufacturers that can deliver branded cups within 10 days, a lead-time target that only high-output, automated lines can meet. As similar beverage cultures gain traction in India, Indonesia, and Mexico, converters are racing to add servo-driven equipment that can sustain 120 cups or more per minute with minimal human oversight.
Compostable Barrier-Coating Breakthroughs
Dispersion coatings that pass the ASTM D6400 tests extend industrial compostability to hot-drink applications; however, actual recovery hinges on the limited U.S. network of fewer than 200 composting facilities. European municipalities integrating cup collection with organic waste report higher capture rates; however, TÜV SÜD found that 40% of supposedly compostable stock failed the 12-week disintegration threshold due to poly-laminate residues. Equipment suppliers respond by refining precision heating and forming profiles that reduce delamination at higher line speeds, thus improving real-world compostability without eroding throughput.
Industry 4.0 Predictive-Maintenance Adoption
New generators of operating data include energy-monitoring modules debuted by Romaco in 2025, which track kilowatt draws at each heating plate, enabling 12% downtime reductions among German adopters. OPC UA interfaces are now standard on premium European and Korean machines, enabling cloud-based dashboards to trigger service alerts before critical component failure. Chinese retrofit kits that add sensors and PLCs to cam-driven legacy machines cost roughly USD 30,000, a price that pays back in under 18 months for converters running three shifts.
Restraints Impact Analysis
| Restraint | (~) % Impact on CAGR Forecast | Geographic Relevance | Impact Timeline | |||
|---|---|---|---|---|---|---|
Low-Cost Plastic and Styrofoam Cup Substitutes Low-Cost Plastic and Styrofoam Cup Substitutes | -0.6% | Regions with weak enforcement of plastic bans (parts of Africa, Latin America, Southeast Asia) | Short term (≤ 2 years) | (~) % Impact on CAGR Forecast:-0.6% | Geographic Relevance:Regions with weak enforcement of plastic bans (parts of Africa, Latin America, Southeast Asia) | Impact Timeline:Short term (≤ 2 years) |
High CAPEX For High-Speed Automated Lines High CAPEX For High-Speed Automated Lines | -0.9% | Global, most acute in emerging markets and SME converters | Medium term (2-4 years) | |||
Volatile Supply of Coated Cup-Stock Paper Volatile Supply of Coated Cup-Stock Paper | -0.5% | Global, with acute spikes in North America and Europe | Short term (≤ 2 years) | |||
Shortage of Skilled Servo-Equipment Technicians Shortage of Skilled Servo-Equipment Technicians | -0.4% | Asia-Pacific manufacturing clusters, emerging markets | Long term (≥ 4 years) | |||
| Source: Mordor Intelligence | ||||||
High CAPEX for High-Speed Automated Lines
Fully automatic systems that exceed 120 cups per minute cost between USD 150,000 and USD 300,000, excluding downstream packaging cells. Add-ons increase project outlays beyond USD 500,000, a hurdle for converters operating on single-digit margins. Government subsidies in India cover up to 3 percentage points of interest but apply only to locally built machines, which often lag behind top-tier Chinese lines in terms of speed and efficiency. Lease-to-own programs from Zhejiang suppliers tie payments to production volume, easing cash-flow stress yet locking buyers into single-source consumable supply contracts, inflating lifetime costs.
Volatile Supply of Coated Cup-Stock Paper
Coated board prices swung 12% in 2025 amid pulp strikes in Scandinavia and competition from corrugated-box converters. Fewer than 20 mills worldwide now supply aqueous-coated stock at scale, resulting in lead times of 12 weeks and forcing converters to hold more inventory. The EU ban on PFAS barriers, effective in 2026, compels mills to upgrade their coaters, thereby tightening the supply and keeping premiums on PLA and dispersion grades elevated through 2027.
Segment Analysis
By Automation Level: Servo Precision Drives Margin Defense
The paper cups and container forming equipment market size for fully automatic machines stood at 53.72% of the Market share in 2025 and is projected to expand faster than semi-automatic alternatives. Robust adoption reflects 8% wage inflation in Zhejiang and Wenzhou, as well as shrinking pools of skilled operators. Mingguo’s MG-G800 series, launched in 2025, illustrates its appeal: with a throughput of 120-150 cups per minute at scrap rates below 0.5%, one operator can oversee three lines, preserving margins as paperboard costs rise.
Semi-automatic platforms still serve converters handling seasonal promotional runs; however, their share continues to decline as digital printing moves onto high-speed lines. Manual gear persists in rural South Asia, but its commercial relevance is fading. Growth momentum favors factories that retrofit cam-driven assets with PLC modules, an upgrade that increases speed by 15% and aligns older units with predictive-maintenance dashboards, supporting the broader transition of the paper cups and container forming equipment market toward lights-out manufacturing.
Note: Segment shares of all individual segments available upon report purchase
By Equipment Type: Insulation Formats Capture Premium Demand
Paper cup formers accounted for 42.32% of market share in 2025; however, the fastest-growing segment belongs to sleeve and double-wall machines, which expanded at a rate of 6.25% annually as beverage chains seek heat protection without the need for separate corrugated sleeves. Mingyuan’s MYC-DW120 reaches 100 cups per minute thanks to isolated curling and sealing stations, demonstrating how innovation centers on thermal stability rather than raw speed.
Bowl and bucket lines serve soups, salads, and fried chicken, but remain niche because deeper draws complicate tooling. Ancillary kits, such as denesters and robotic case packers, are now bundled with new high-speed units, confirming the trend in the paper cups and container forming equipment market toward end-to-end automation.
By Speed Range: Throughput Separates Commodity from Premium
Mid-speed machines, rated 61-120 cups per minute, captured 45.39% of 2025 sales, striking a balance between affordability and decent productivity. Yet demand is migrating upward. Lines topping 120 cups per minute post a 6.18% CAGR as contract manufacturers chase 72-hour turnaround windows for supermarket promotions.
Top Chinese brands incorporate open-cam designs and advanced lubrication to stabilize bearings at 150-180 cups per minute, providing operators with the flexibility to compress lead times without adding shifts.
Note: Segment shares of all individual segments available upon report purchase
By End-user Industry: Outsourcing Reshapes Value Chains
Food and beverage producers held a 40.56% share in 2025, but contract manufacturers are increasing at the fastest rate as QSR chains focus capital on storefronts rather than captive conversion. Starbucks now sources 90% of cups externally, and McDonald’s communicates similar procurement patterns.
Packaging converters offer multisubstrate portfolios, but private-label supermarkets continue to pressure prices, which leads converters to invest in high-speed equipment that amortizes overhead across a greater volume. Institutional caterers value traceability and third-party safety reports, steering orders to suppliers with FSSC 22000 certificates and reinforcing the premium tier of the paper cups and container forming equipment market.
Geography Analysis
The Asia-Pacific region owned 34.61% of the value in 2025 and is projected to grow at 5.89% through 2031, as Chinese clusters export turnkey lines and India enforces plastic bans. Lines priced under USD 50,000 find ready buyers among Indian SMEs accessing Make in India credit.[2]Government of India, Ministry of Environment, Forest and Climate Change, “Plastic Waste Management Amendment Rules 2021,” moef.gov.in
Japan and South Korea specialize in high-spec systems with OPC UA integration, catering to pharmaceutical and niche food clients. North America and Europe draw growth from regulation rather than volume. EU extended producer responsibility fees make PLA and aqueous coatings cost-competitive, spurring upgrades.
U.S. converters import Chinese machines to avoid steep capex despite limited after-sales coverage. South America and the Middle East invest selectively in areas with rising QSR density, whereas Africa lags behind due to weak enforcement of plastic restrictions and irregular power supply.

Competitive Landscape
Market Concentration
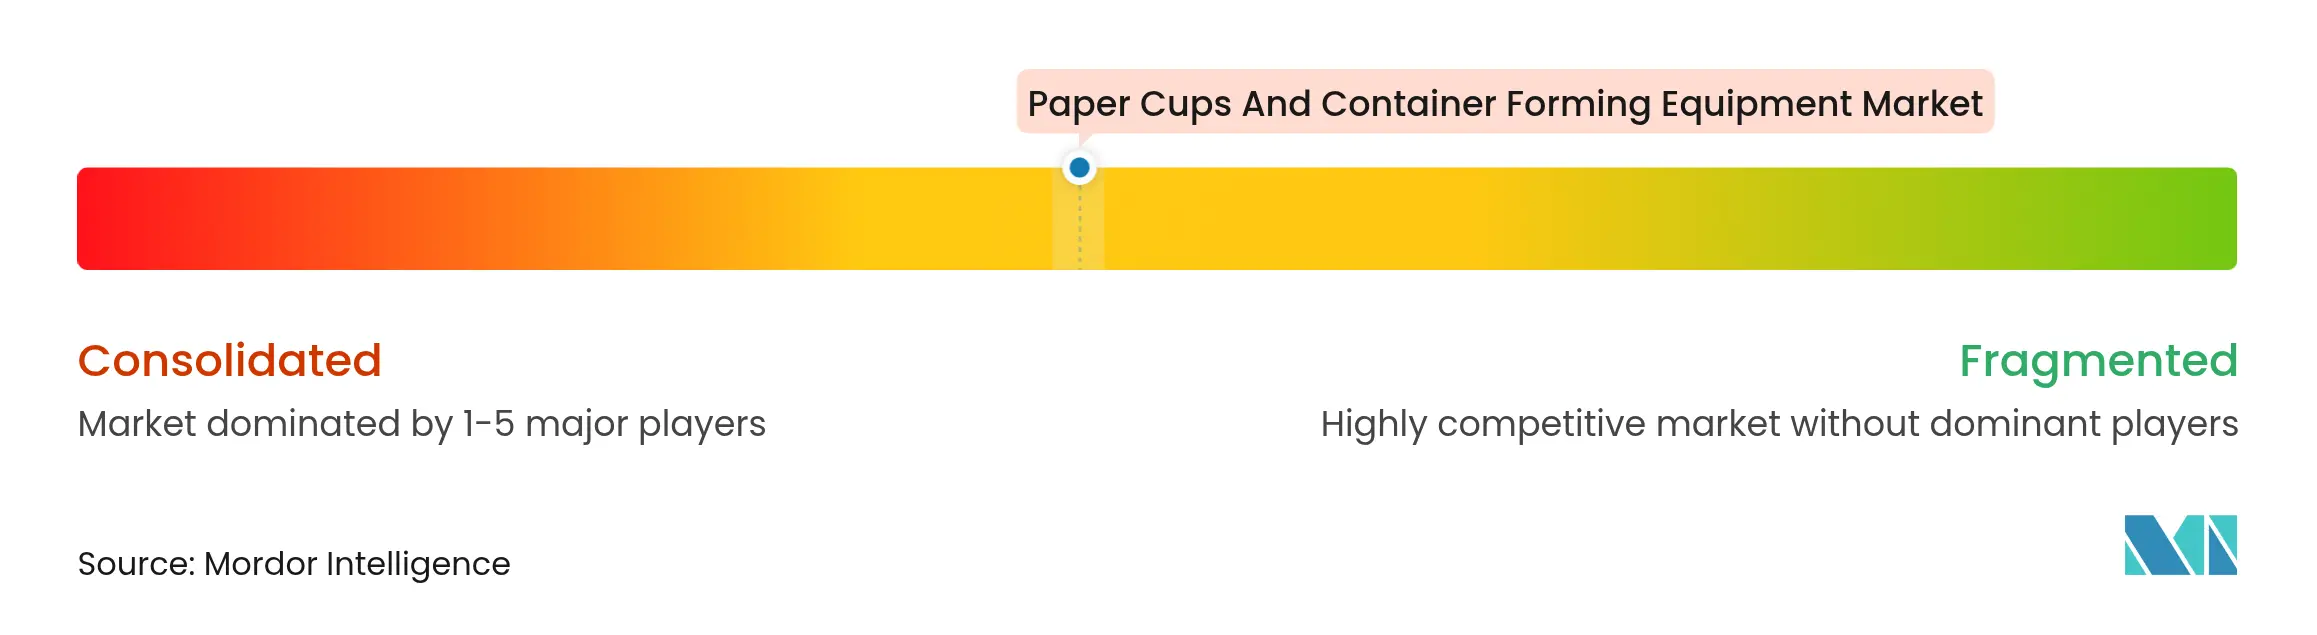
The top four suppliers accounted for only 28% of global revenue in 2025, indicating a moderately fragmented paper cup and container forming equipment market. Chinese manufacturers such as Zhejiang SEE Machinery, Wenzhou New Smart, and Ruian Mingyuan deliver more than 1,000 units annually by integrating servo motors in-house and offering modular upgrades at approximately 40% of the cost of new equipment.
European and Korean competitors emphasize CE compliance, OPC UA connectivity, and multi-year warranties but face resistance in price-sensitive regions where payback must remain under 18 months. Indian brands leverage domestic financing schemes yet struggle to expand their international after-sales reach.
White-space resides in coating-agnostic lines that switch between PE, PLA, and aqueous stock without requiring tooling changes; energy-tracking modules that certify carbon footprints for QSR audits; and retrofit kits that add vision inspection capabilities for under USD 30,000.[3]Messe Düsseldorf, “Interpack Exhibitors 2026,” interpack.de Start-ups are piloting rent-to-own contracts keyed to machine output, transforming capex into opex and broadening market access for small converters.
Paper Cups And Container Forming Equipment Industry Leaders

*Disclaimer: Major Players sorted in no particular order
Recent Industry Developments
- November 2025: Zhejiang Jinhao scaled laminated paper capacity to 20,000 tons and produced 2 billion cups annually across 17 fully automated lines.
- October 2025: NewTop Machinery published a video demonstrating full-process automation from blank feed to inspection on its high-speed paper cup line.
- September 2025: Ruian Mingyuan added the MYC-DB120 double-turn-plate bowl machine with Schneider PLCs.
- August 2025: The Interpack 2026 exhibitor list confirmed strong participation from leading European and Chinese forming equipment brands.
Table of Contents for Paper Cups And Container Forming Equipment Industry Report
1. INTRODUCTION
- 1.1Study Assumptions and Market Definition
- 1.2Scope of the Study
2. RESEARCH METHODOLOGY
3. EXECUTIVE SUMMARY
4. MARKET LANDSCAPE
- 4.1Market Overview
- 4.2Market Drivers
- 4.2.1Rising Innovation in Forming-Equipment Technologies
- 4.2.2Regulatory Bans on Single-Use Plastics
- 4.2.3Growth of QSR and On-The-Go Beverage Culture
- 4.2.4Demand for Eco-Friendly Packaging In Food
- 4.2.5Industry 4.0 Predictive-Maintenance Adoption
- 4.2.6Compostable Barrier-Coating Breakthroughs
- 4.3Market Restraints
- 4.3.1Low-Cost Plastic and Styrofoam Cup Substitutes
- 4.3.2High CAPEX For High-Speed Automated Lines
- 4.3.3Volatile Supply of Coated Cup-Stock Paper
- 4.3.4Shortage of Skilled Servo-Equipment Technicians
- 4.4Industry Value Chain Analysis
- 4.5Regulatory Landscape
- 4.6Technological Outlook
- 4.7Impact of Macroeconomic Factors
- 4.8Porter’s Five Forces Analysis
- 4.8.1Threat of New Entrants
- 4.8.2Bargaining Power of Suppliers
- 4.8.3Bargaining Power of Buyers
- 4.8.4Threat of Substitutes
- 4.8.5Industry Rivalry
5. MARKET SIZE AND GROWTH FORECASTS (VALUE)
- 5.1By Automation Level
- 5.1.1Fully Automatic
- 5.1.2Semi-Automatic
- 5.1.3Manual
- 5.2By Equipment Type
- 5.2.1Paper Cup Forming Machines
- 5.2.2Paper Bowl Forming Machines
- 5.2.3Paper Bucket/Container Formers
- 5.2.4Sleeve/Double-Wall Cup Machines
- 5.2.5Ancillary Equipment (Denesters, Dispensers)
- 5.3By Speed Range
- 5.3.1Less than 60 pcs/min
- 5.3.261-120 pcs/min
- 5.3.3More than 120 pcs/min
- 5.4By End-user Industry
- 5.4.1Food and Beverage Manufacturers
- 5.4.2Packaging Converters
- 5.4.3Contract Tableware Manufacturers
- 5.4.4Institutional and Hospitality Suppliers
- 5.4.5Retail Private-Label Packagers
- 5.4.6Other End-user Industries
- 5.5By Geography
- 5.5.1North America
- 5.5.1.1United States
- 5.5.1.2Canada
- 5.5.1.3Mexico
- 5.5.2South America
- 5.5.2.1Brazil
- 5.5.2.2Argentina
- 5.5.2.3Chile
- 5.5.2.4Rest of South America
- 5.5.3Europe
- 5.5.3.1United Kingdom
- 5.5.3.2Germany
- 5.5.3.3France
- 5.5.3.4Italy
- 5.5.3.5Spain
- 5.5.3.6Rest of Europe
- 5.5.4Asia-Pacific
- 5.5.4.1China
- 5.5.4.2India
- 5.5.4.3Japan
- 5.5.4.4South Korea
- 5.5.4.5Australia
- 5.5.4.6Rest of Asia-Pacific
- 5.5.5Middle East and Africa
- 5.5.5.1Middle East
- 5.5.5.1.1Saudi Arabia
- 5.5.5.1.2United Arab Emirates
- 5.5.5.1.3Turkey
- 5.5.5.1.4Rest of Middle East
- 5.5.5.2Africa
- 5.5.5.2.1South Africa
- 5.5.5.2.2Nigeria
- 5.5.5.2.3Rest of Africa
6. COMPETITIVE LANDSCAPE
- 6.1Market Concentration
- 6.2Strategic Moves
- 6.3Market Share Analysis
- 6.4Company Profiles (includes Global level Overview, Market level overview, Core Segments, Financials as available, Strategic Information, Market Rank/Share for key companies, Products and Services, and Recent Developments)
- 6.4.1Zhejiang SEE Machinery Co., Ltd.
- 6.4.2Paper Machinery Corporation
- 6.4.3ACE PACK Co., Ltd.
- 6.4.4Zhejiang New Debao Machinery Co., Ltd.
- 6.4.5Henan Yuancui Machinery Equipment Co., Ltd.
- 6.4.6Ruian Mingyuan Machinery Co., Ltd.
- 6.4.7Ruian Daqiao Packaging Machinery Co., Ltd. (DAKIOU)
- 6.4.8Michael Hörauf Maschinenfabrik GmbH & Co. KG
- 6.4.9Woosung Machinery Co., Ltd.
- 6.4.10Hariram Engineering
- 6.4.11SPB Machinery
- 6.4.12Daesung Hi-Tech Co., Ltd.
- 6.4.13Prime Machinery
- 6.4.14Bharath Machines
- 6.4.15Think India Industries
- 6.4.16Henan Yulu Machinery Co., Ltd.
- 6.4.17Wenzhou Toppro Machinery Co., Ltd.
7. MARKET OPPORTUNITIES AND FUTURE OUTLOOK
- 7.1White-space and Unmet-need Assessment
Global Paper Cups And Container Forming Equipment Market Report Scope
The paper cups and container forming equipment includes specialized machines designed to manufacture high-quality paper cups and container products of various capacities, shapes, and sizes. The rising demand for on-the-go beverage takeout has led to a growing demand for paper cups, thereby propelling the market's growth.
The Paper Cups and Container Forming Equipment Market Report is Segmented by Automation Level (Fully Automatic, Semi-Automatic, and Manual), Equipment Type (Paper Cup Forming Machines, Paper Bowl Forming Machines, Paper Bucket/Container Formers, Sleeve/Double-Wall Cup Machines, and Ancillary Equipment), Speed Range (Less than 60 pcs/min, 61-120 pcs/min, and More than 120 pcs/min), End-user Industry (Food and Beverage Manufacturers, Packaging Converters, Contract Tableware Manufacturers, Institutional and Hospitality Suppliers, Retail Private-Label Packagers, and Other End-user Industries), and Geography (North America, South America, Europe, Asia-Pacific, Middle East and Africa). The Market Forecasts are Provided in Terms of Value (USD).