Bottling Machinery Market Size and Share
Market Overview
| Study Period | 2021 - 2031 |
|---|---|
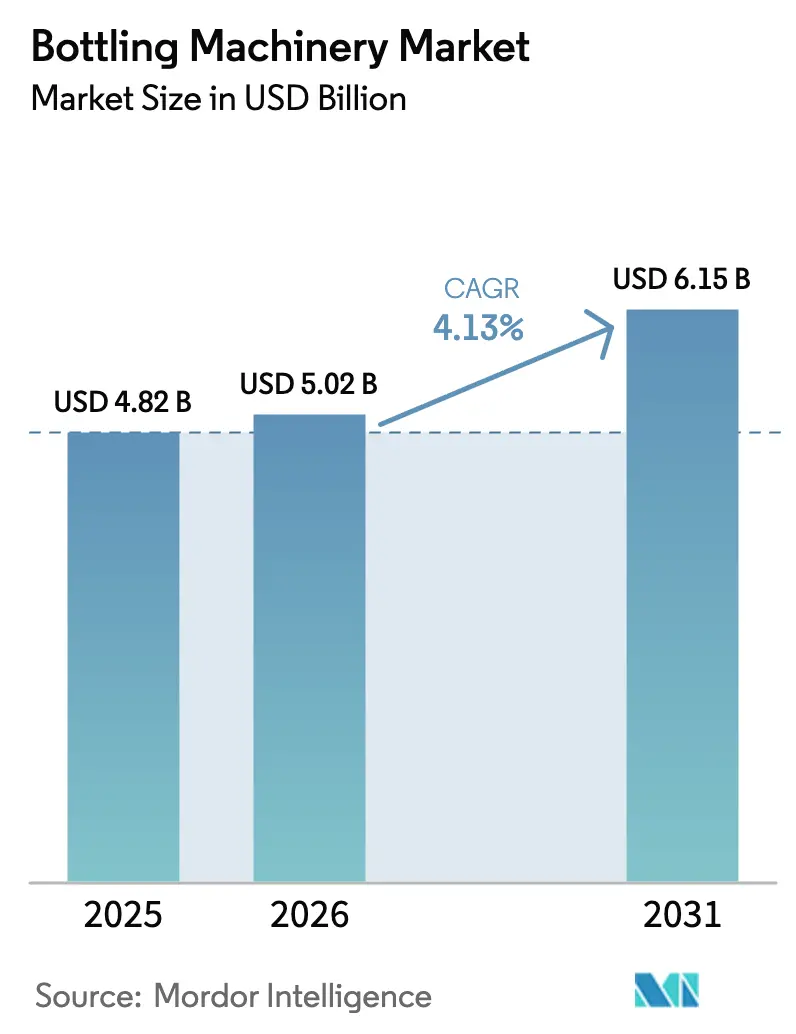
| Market Size (2026) | USD 5.02 Billion |
| Market Size (2031) | USD 6.15 Billion |
| Growth Rate (2026 - 2031) | 4.13% CAGR |
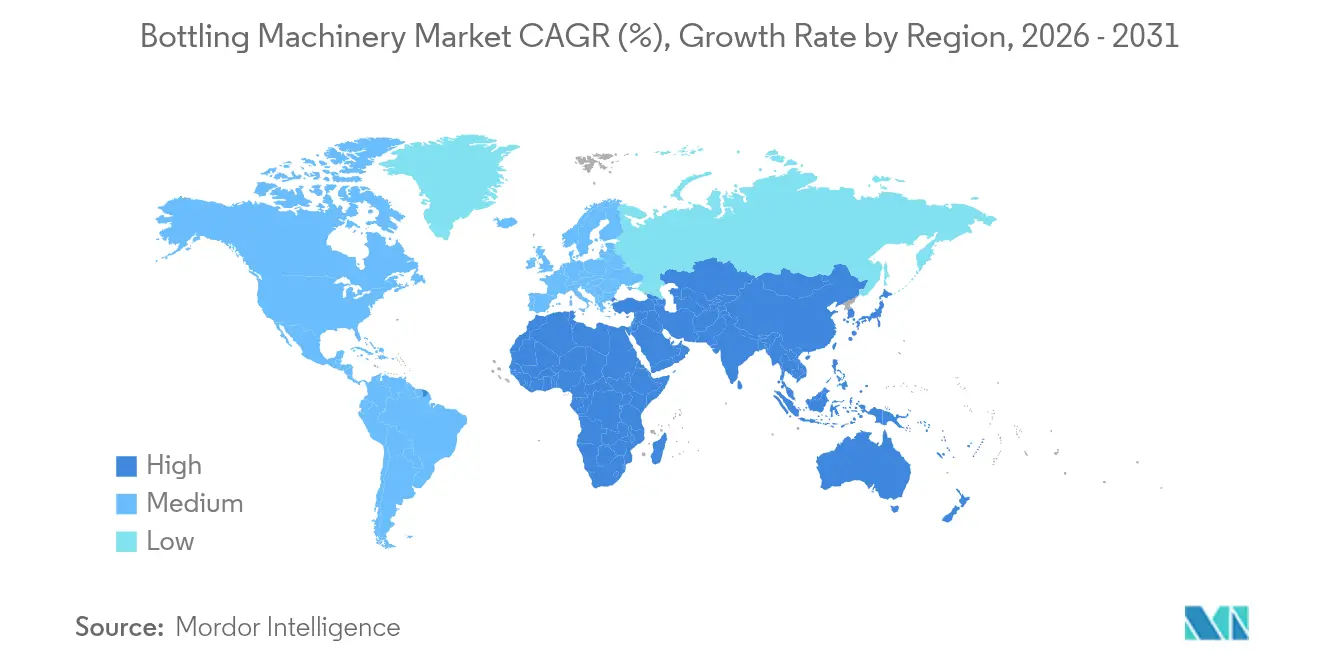
| Fastest Growing Market | Asia Pacific |
| Largest Market | Asia Pacific |
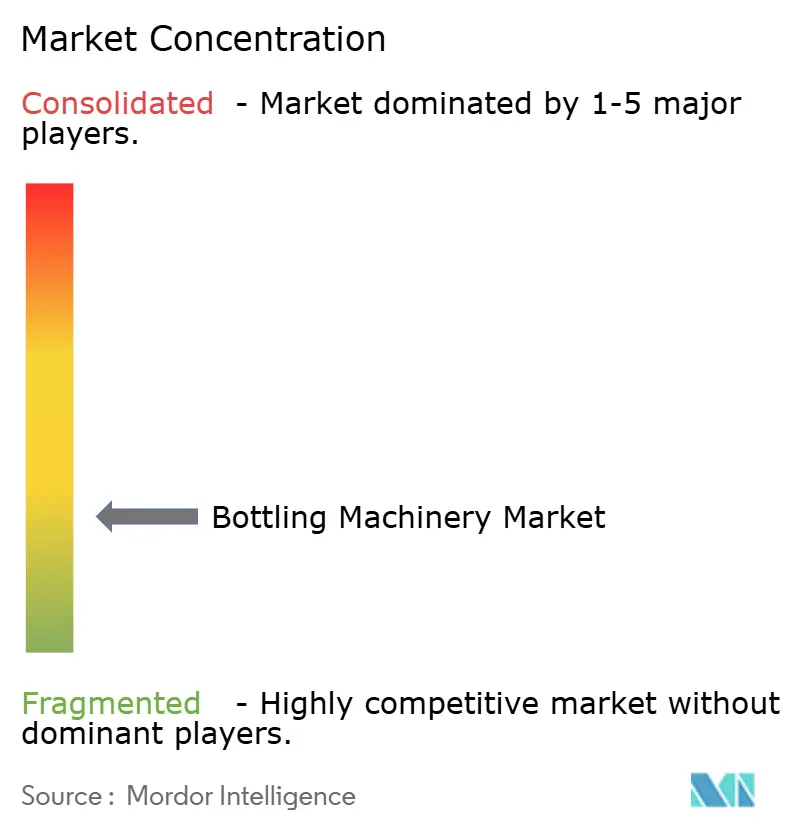
| Market Concentration | Low |
Major Players
*Disclaimer: Major Players sorted in no particular order Image © Mordor Intelligence. Reuse requires attribution under CC BY 4.0. |
|
Bottling Machinery Market Analysis by Mordor Intelligence
The bottling machinery market size is expected to grow from USD 4.82 billion in 2025 to USD 5.02 billion in 2026 and is forecast to reach USD 6.15 billion by 2031 at 4.13% CAGR over 2026-2031. The upward trajectory mirrors manufacturers’ rapid migration toward smart-factory architectures that join Internet of Things (IoT) sensors, artificial intelligence, and predictive analytics with core filling, capping, and labelling equipment. Across beverages, pharmaceuticals, and cosmetics, producers are modernizing plants to counter labor shortages, keep pace with SKU multiplication, and comply with tightening sustainability mandates. Filling technology remains at the heart of most buying decisions, yet fastest growth is now anchored in labelling solutions and semi-automatic lines that enable mid-sized firms to automate step-by-step without overextending capital budgets. Asia-Pacific leads demand on both size and growth, a dual status powered by aggressive industrialization in China and India and by a deepening cold-chain footprint that brings chilled and functional drinks to previously unreachable districts. At the same time, premium beverage makers in Europe and North America are reviving glass containers to signal quality and eco-credentials, a shift that forces original equipment manufacturers (OEMs) to deliver lines able to swap seamlessly between PET, lightweight glass, and recycled inputs.
Key Report Takeaways
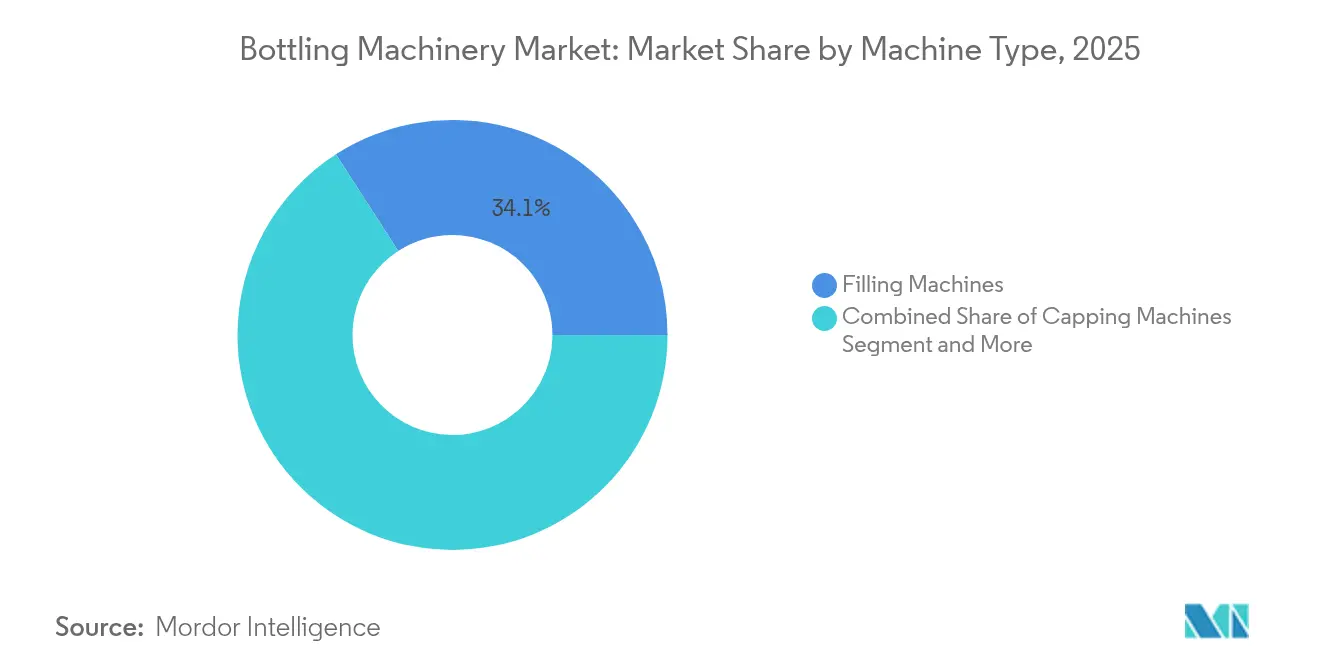
- By machine type, filling equipment secured 34.12% of bottling machinery market share in 2025, while labelling machines are set to grow the fastest at a 7.22% CAGR to 2031.
- By automation level, fully automatic solutions held 65.05% of the bottling machinery market size in 2025; semi-automatic equipment is projected to expand at 6.21% CAGR through 2031.
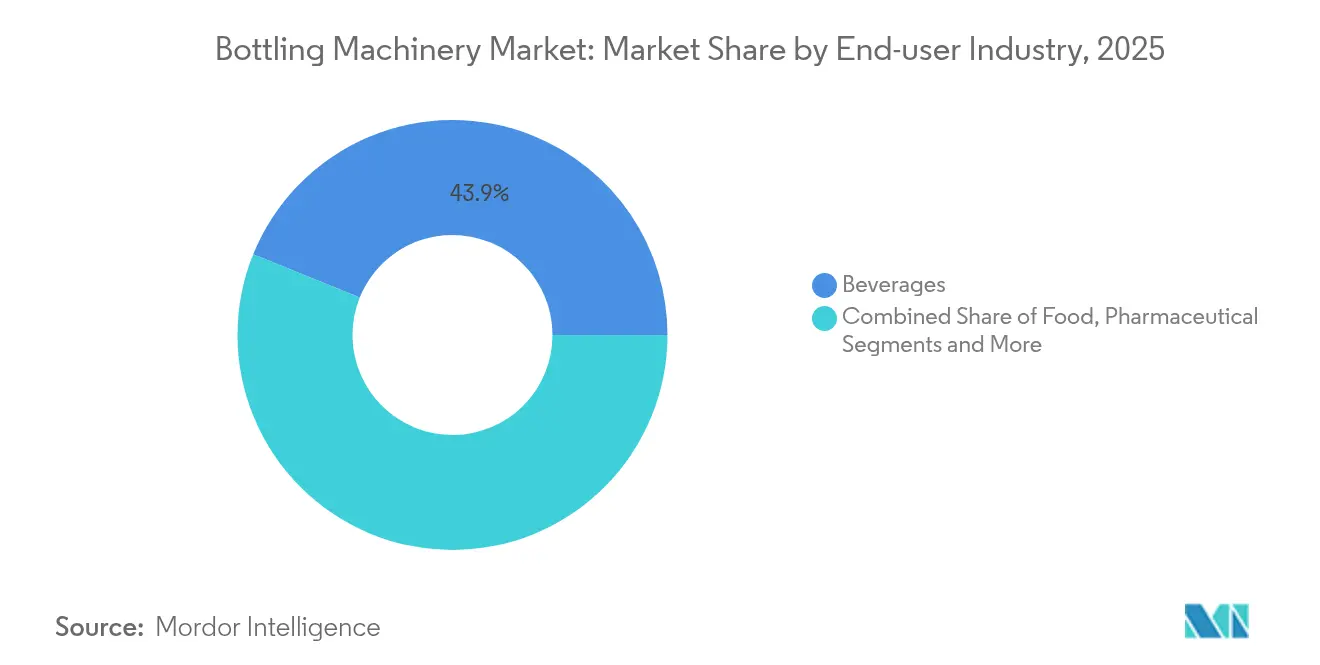
- By end-user industry, the beverage segment led with a 43.88% revenue share in 2025, whereas pharmaceuticals are forecast to rise at an 8.05% CAGR between 2026 and 2031.
- By container material, PET accounted for 58.12% share of the bottling machinery market size in 2025, yet glass formats are advancing at a 5.95% CAGR over the same period.
- By geography, Asia-Pacific commanded 38.10% of 2025 sales and is predicted to accelerate at 6.98% CAGR through 2031.
Note: Market size and forecast figures in this report are generated using Mordor Intelligence’s proprietary estimation framework, updated with the latest available data and insights as of 2026.
Global Bottling Machinery Market Trends and Insights
Drivers Impact Analysis*
| Driver | (~) % Impact on CAGR Forecast | Geographic Relevance | Impact Timeline |
|---|---|---|---|
| Smart-factory and IoT-enabled bottling lines | +0.8% | Global, with early adoption in North America and EU | Medium term (2-4 years) |
| SKU-flexible machinery for craft and functional beverages | +0.6% | North America and EU core, expanding to Asia-Pacific | Short term (≤ 2 years) |
| Sustainability mandates (light-weighting and refillables) | +0.7% | EU leading, North America following, Asia-Pacific emerging | Long term (≥ 4 years) |
| Cold-chain beverage expansion in emerging markets | +0.5% | Asia-Pacific core, spill-over to MEA and Latin America | Medium term (2-4 years) |
| Labor-scarcity-driven automation adoption | +0.9% | Global, most acute in North America and EU | Short term (≤ 2 years) |
| Aseptic/clean-fill uptake in nutraceutical and dairy drinks | +0.4% | Global, with pharmaceutical focus in North America and EU | Long term (≥ 4 years) |
| Source: Mordor Intelligence | |||
Smart-factory and IoT-enabled bottling lines
Digitized bottling plants now embed PLCs, edge gateways, and cloud dashboards that capture run-time data in real time, pushing overall equipment effectiveness (OEE) toward the 85% benchmark achieved in flagship installations. AI-enhanced vision systems inspect fill levels and cap integrity in milliseconds, curbing rework and product waste. Governments also nurture adoption; Malaysia’s Industry4WRD, for example, offers tax incentives that shorten payback periods for U.S. automation vendors active in the country. [1]U.S. Commercial Service, “Malaysia Smart Manufacturing Opportunities,” trade.gov As SKU counts climb and label requirements diversify, producers increasingly regard line-level analytics and predictive maintenance as prerequisites for uptime rather than optional add-ons.
SKU-flexible machinery accommodates craft and functional beverages
Craft brewers and functional drink start-ups often juggle hundreds of SKUs, container shapes, and carbonation profiles. New quick-change filling heads, servo-driven guides, and digital recipes have cut monthly changeover downtime from 7 hours to 2 hours in some deployments, unlocking savings of about USD 9,000 per line. A single Sidel EvoFill Can Compact platform now handles up to 40,000 cph with ±1 mL precision and finishes changeovers in under 25 minutes. Such agility lets smaller brands bring seasonal flavors to market without dedicating entire lines to one product.
Sustainability mandates reshape packaging and equipment design
The EU’s Packaging & Packaging Waste Regulation requires every pack to be recyclable by 2028 and sets a 30% recycled-PET threshold for food-grade bottles by 2030. California’s SB 54 mirrors that intent, prompting OEMs to engineer fillers, stretch-blow molders, and cappers that cope with 100% rPET preforms as well as tethered caps now mandatory across Europe. Vetropack’s 30% lighter glass and Berry Global’s 400 million tethered lids already on shelf prove that process equipment must evolve as quickly as policy.
Cold-chain beverage expansion unlocks emerging-market potential
Improved logistics in India, Indonesia, and West Africa are opening sales channels for temperature-sensitive drinks that rely on on-site bottling to minimize spoilage. Twellium’s Kumasi facility, featuring Africa’s fastest PET water line at 80,000 bph, shows how advanced rinsers, heaters, and blow-molders combine with in-house water treatment to offset infrastructure gaps. India’s packaging-machinery outlay, worth USD 5.5 billion in 2023 and growing at 9.33%, further illustrates how cold-chain investment spurs local equipment demand. As chilled distribution spreads, mid-tier brands adopt compact tunnel pasteurizers and wrap-around case packers tailored for long-haul transport, lifting equipment orders across APAC, the Middle East, and parts of Latin America.
Restraints Impact Analysis*
| Restraint | (~) % Impact on CAGR Forecast | Geographic Relevance | Impact Timeline |
|---|---|---|---|
| Capex inflation from metal and servo shortages | -0.6% | Global, most acute in North America and EU | Short term (≤ 2 years) |
| Cyber-security risks in connected equipment | -0.3% | Global, with highest concern in North America and EU | Medium term (2-4 years) |
| Plastic-ban regulatory uncertainty | -0.4% | EU leading, North America and Asia-Pacific following | Long term (≥ 4 years) |
| Scarcity of multi-disciplinary maintenance talent | -0.5% | Global, most critical in developed markets | Medium term (2-4 years) |
| Source: Mordor Intelligence | |||
Capex inflation from metal and servo shortages
Extended lead times for stainless steel, aluminum extrusions, and servo drives have inflated project quotes and forced some buyers to postpone upgrades.[2]John Sprovieri, “Is Inflation Hurting Investment in Capital Equipment?” Assembly Magazine, assemblymag.com New U.S. tariffs of 10% on most automation imports, plus surcharge layers on Chinese and Mexican parts, further elevate delivered prices. As a result, several bottlers are phasing projects, opting for semi-automatic modules first and deferring full line replacement until costs stabilize.
Cyber-security risks in connected equipment
Manufacturing accounted for 68% of industrial ransomware incidents in Q1 2025, with average shutdowns lasting 21 days. Converged IT/OT networks open gateways for adversaries to hijack HMIs or exfiltrate proprietary formulas. Following the high-profile Petya attack that disrupted global snack and confectionery operations, beverage firms now budget for network segmentation, zero-trust authentication, and real-time threat analytics before approving any further IoT roll-outs.[3]Maria Pérez, “Cybersecurity for Industry 5.0: Trends and Gaps,” Frontiers in Computer Science, frontiersin.org
*Our forecasts treat driver/restraint impacts as directional, not additive. The impact forecasts reflect baseline growth, mix effects, and variable interactions.
Segment Analysis
By Machine Type: Filling Equipment Underpins Line Throughput
Filling machines retained 34.12% bottling machinery market share in 2025, confirming their status as the production bottleneck that dictates overall line speed. Innovations such as vacuum-assisted foam control and AI-driven level sensors are trimming product giveaway while lifting per-nozzle accuracy to ±0.2 g. Meanwhile, labelling units, boosted by traceability laws and brand-owner demand for decorative sleeves, are set to grow at 7.22% CAGR, the quickest in the equipment mix. Capping systems stay resilient thanks to tethered-closure legislation, and integrated monoblocks gain favor where floor space is tight and contamination risk is high. Inspection benches, propelled by deep-learning cameras able to analyze 4,000 bph, add a quality firewall that beverage, pharma, and cosmetics players now consider non-negotiable.
Lightweight PET adoption also pulls through stretch-blow molders with higher neck-finish precision, while premium spirits lines invest in robotic case packers to handle embossed glass without scuffing. The consolidation trend is clear: buyers increasingly prefer single-vendor turnkey packages rather than piecemeal machine sourcing, widening the addressable scope for top-tier OEMs.


By Automation Level: Semi-Automatic Pathways Ease Capital Pressure
Fully automatic equipment captured 65.05% of the bottling machinery market size in 2025 and remains the default pick for high-volume beverage plants. Yet demand for semi-automatic configurations is climbing 6.21% annually because they let mid-tier producers automate specific pain points—typically filling or capping—while keeping manual oversight for low-volume SKUs. One color-cosmetics line cut headcount from 14 to 2 operators after installing a semi-automatic filler-capper block and still achieved 60-70% uptime.
Modern semi-automatic skids now ship with touchscreen HMIs, OEE dashboards, and remote diagnostics, narrowing the feature gap with fully automatic peers. That capability blend makes them viable stepping-stones: once volumes justify the spend, modules can often be upgraded to continuous motion via software keys and additional servos. Manual bench-top fillers continue serving test kitchens and seasonal production, where flexibility trumps speed.
By End-User Industry: Pharmaceuticals Lead Aseptic Upswing
Beverages still dominate revenue at 43.88%, but aseptic drug filling is registering the sharpest climb at 8.05% CAGR through 2031. Biologics and ready-to-use syringes demand class-A laminar flow, vapor-phase H₂O₂ sterilization, and gravimetric in-process checks that assure micro-dose accuracy within ±2%. Syntegon’s MLD Advanced, for instance, delivers 400 syringes per minute with validated electronic batch records, a requirement sweeping injectable markets.
In contrast, dairy, pasta sauce, and nutraceutical lines integrate ultra-clean or ESL modules to secure 90-day chilled life without preservatives. Personal care fillers pivot toward high-viscosity plungers that handle mascara and creams at up to 50 cpm while limiting product aeration. Chemicals and household goods segments inject further diversity, ordering corrosion-resistant valves and explosion-proof drives for bleach or solvent lines.
By Container Material: Premium Glass Challenges PET Supremacy
PET bottles claimed 58.12% of shipments in 2025 thanks to light weight and cost-efficiency, yet the premium end of the bottling machinery market is swinging back to glass, which is growing 5.95% yearly. Vetropack’s 30% lighter flint bottles illustrate how weight reductions narrow freight cost gaps while preserving the tactile cues valued by craft spirits and cold-brew coffee brands.
OEMs thus tweak depalletizers, washers, and fillers to tackle recycled-content PET, featherweight glass, and metal cans all on one line. Sidel’s Super Combi, for example, combines stretch-blow molding, inspection, and filling in one block and now handles 100% rPET preforms without sacrificing cycle time. Biodegradable and paper-based bottles remain niche but attract R&D spend as plastic-ban deadlines approach in Europe and several U.S. states.
Geography Analysis
Asia-Pacific retained 38.10% bottling machinery market share in 2025 and rides a 6.98% CAGR to 2031 on the back of unprecedented industrial build-out in China, India, Vietnam, and Indonesia. Investment incentives—ranging from land-lease discounts to power-tariff rebates—have spawned greenfield beverage and pharma plants that specify high-speed PET fillers up to 80,000 bph. India’s packaging-machinery spend, which reached USD 5.5 billion in 2023, now grows at 9.33% as e-commerce drives demand for diversified pack formats
North America acts as technology test-bed, rolling out predictive-maintenance analytics and 120,000 cph canning lines for co-packers such as DrinkPAK in Nevada. Liquor and beyond-beer segments see “spirits RTD” in slim cans becoming the fastest value pool, steering line upgrades toward nitrogen dosing, double-seam inspection, and high-definition sleeve application. The United States also fields the most acute labor shortages, which pushes return-on-investment models for robotics below 24 months.
Europe enforces the strictest sustainability codes, compelling bottle light-weighting, refillables, and tethered closures. Germany alone logged three Coca-Cola Europacific Partners upgrades in 2025, including a 60,000 bph glass line in Lüneburg and a 30,000 large-container block in Genshagen. OEMs thus position EU installations as reference sites showcasing lower carbon footprints via energy-recuperation servos and reduced water usage in rinsers.
Middle East and Africa benefit from logistics catch-up: Twellium’s Ghana site, Africa’s fastest PET water line at 80,000 bph, proves that high-output lines are viable once grid stability and chilled storage improve. Latin America sees steady but cautious modernization; Coca-Cola FEMSA’s PET conversion program in Brazil underscores how regional bottlers balance capex with volatile macroeconomics.

Competitive Landscape
Global suppliers pursue end-to-end integration to lock in lifecycle revenues and differentiate against niche challengers. Krones closed its EUR 200 million move for injection-molding specialist Netstal, creating a preform-to-pallet portfolio that crosses beverages, medical devices, and thin-wall food packaging. Omnia Technologies followed suit, scooping up Sacmi Beverage and Labelling plus Acmi to birth an architecture offering stretch-blow, filling, capping, and sleeving under a single umbrella.
OEMs also layer software subscriptions on hardware: real-time OEE dashboards, spare-parts e-commerce, and predictive-service alerts extend margin pools long after the initial sale. Niche players thrive by solving discrete pain points—Balluff’s guided changeover kits, for instance, shave monthly downtime and attract craft brewers averse to six-figure automation spends. For high-value biologics, Syntegon, Coesia’s FlexLink, and AST pivot toward isolator-based fillers with nested-syringe compatibility, a domain less exposed to mainstream beverage cycles.
Regional assemblers in Southeast Asia and South America generally license European designs but localize frames, electrics, and after-sales crews to cut cost. Nevertheless, any supplier lacking digital-twin or sustainability credentials risks exclusion from Europe’s and North America’s capex pipelines, where boardrooms now benchmark Scope-3 emissions for equipment procurement.
Bottling Machinery Industry Leaders
-
Krones AG
-
Sacmi Imola S.C.
-
Coesia S.p.A.
-
GEA Group
-
KHS Group
- *Disclaimer: Major Players sorted in no particular order

Recent Industry Developments
- June 2025: Heineken opened a EUR 45 million R&D center in the Netherlands, and Danone invested USD 65 million in a Florida line that trims bottle loss 30%
- May 2025: Krones reported 12.1% 2024 revenue growth to EUR 5.29 billion and guided 7%-9% growth for 2025.
- May 2025: Sidel unveiled EvoFill Can Compact, delivering 40,000 cph with ±1 mL accuracy and <0.1% product loss.
- April 2025: Syntegon launched the MLD Advanced syringe filler at 400 units/min with full in-process control.


Global Bottling Machinery Market Report Scope
Bottling machinery is utilized for packaging various liquids in different industries, including beverages, food, pharmaceuticals, cosmetics, and chemicals. This machinery is designed to automate and streamline the process, from filling bottles with the desired liquid to capping and labeling them for distribution.
The bottling machinery market is segmented by technology (automatic, semi-automatic), end-user industry (beverage, food, pharmaceutical, cosmetics, personal care, and other end-user industries), and geography (North America [United States and Canada], Europe [Germany, United Kingdom, France, Italy, and Rest of Europe], Asia [China, Japan, India, Australia & New Zealand, and Rest of Asia], Latin America, and Middle East and Africa). The market sizes and forecasts are provided in terms of value for all the above segments.
| Filling Machines |
| Capping Machines |
| Labelling Machines |
| Rinsing and Cleaning Machines |
| Inspection and Quality-Control Equipment |
| Integrated Monoblock Systems |
| Fully Automatic |
| Semi-automatic |
| Manual / Bench-top |
| Beverage | Alcoholic Beverages |
| Non-alcoholic Beverages | |
| Food | |
| Pharmaceutical | |
| Cosmetics and Personal Care | |
| Other End-user Industry |
| Polyethylene terephthalate (PET) |
| Glass |
| Metal / Aluminium |
| Other Container Material |
| North America | United States | |
| Canada | ||
| Mexico | ||
| Europe | Germany | |
| United Kingdom | ||
| France | ||
| Italy | ||
| Russia | ||
| Rest of Europe | ||
| Asia-Pacific | China | |
| Japan | ||
| India | ||
| South Korea | ||
| Southeast Asia | ||
| Australia and New Zealand | ||
| Rest of Asia-Pacific | ||
| Middle East and Africa | Middle East | Saudi Arabia |
| United Arab Emirates | ||
| Turkey | ||
| Rest of Middle East | ||
| Africa | South Africa | |
| Nigeria | ||
| Egypt | ||
| Rest of Africa | ||
| South America | Brazil | |
| Argentina | ||
| Rest of South America | ||
| By Machine Type | Filling Machines | ||
| Capping Machines | |||
| Labelling Machines | |||
| Rinsing and Cleaning Machines | |||
| Inspection and Quality-Control Equipment | |||
| Integrated Monoblock Systems | |||
| By Automation Level | Fully Automatic | ||
| Semi-automatic | |||
| Manual / Bench-top | |||
| By End-user Industry | Beverage | Alcoholic Beverages | |
| Non-alcoholic Beverages | |||
| Food | |||
| Pharmaceutical | |||
| Cosmetics and Personal Care | |||
| Other End-user Industry | |||
| By Container Material | Polyethylene terephthalate (PET) | ||
| Glass | |||
| Metal / Aluminium | |||
| Other Container Material | |||
| By Geography | North America | United States | |
| Canada | |||
| Mexico | |||
| Europe | Germany | ||
| United Kingdom | |||
| France | |||
| Italy | |||
| Russia | |||
| Rest of Europe | |||
| Asia-Pacific | China | ||
| Japan | |||
| India | |||
| South Korea | |||
| Southeast Asia | |||
| Australia and New Zealand | |||
| Rest of Asia-Pacific | |||
| Middle East and Africa | Middle East | Saudi Arabia | |
| United Arab Emirates | |||
| Turkey | |||
| Rest of Middle East | |||
| Africa | South Africa | ||
| Nigeria | |||
| Egypt | |||
| Rest of Africa | |||
| South America | Brazil | ||
| Argentina | |||
| Rest of South America | |||


Key Questions Answered in the Report
What is the current value of the bottling machinery market?
The bottling machinery market is worth USD 5.02 billion in 2026 and is forecast to hit USD 6.15 billion by 2031 at a 4.13% CAGR.
Which region leads the bottling machinery market?
Asia-Pacific holds the lead with 38.10% share in 2025 and is also the fastest-growing geography at 6.98% CAGR through 2031.
Which machine type generates the highest revenue?
Filling machines command the largest share at 34.12%, driven by their pivotal role in determining line throughput and product quality.
What end-user industry is expanding the fastest?
Pharmaceutical applications are projected to grow at 8.05% CAGR to 2031 due to rising aseptic and ready-to-use syringe demand.
Page last updated on:


