
Size and Share of Paper Industry Machinery Market
Market Overview
| Study Period | 2020 - 2031 |
|---|---|
| Market Size (2026) | USD 118.93 Billion |
| Market Size (2031) | USD 148.59 Billion |
| Growth Rate (2026 - 2031) | 4.55 % |
| Fastest Growing Market | Asia Pacific |
| Largest Market | Asia Pacific |
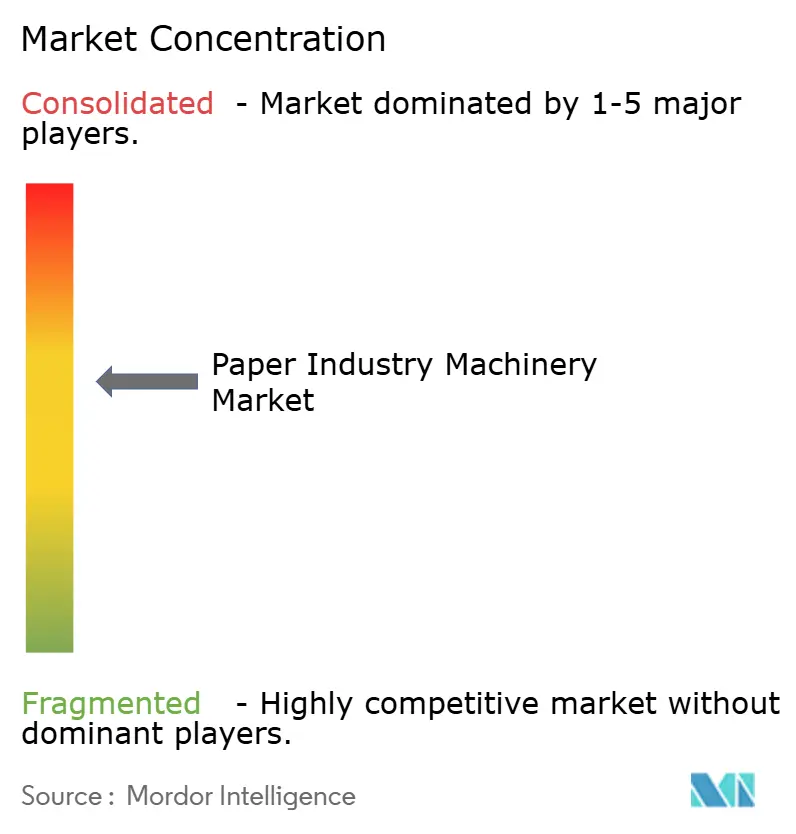
| Market Concentration | Medium |
Major Players *Disclaimer: Major Players sorted in no particular order Image © Mordor Intelligence. Reuse requires attribution under CC BY 4.0. | |

Analysis of Paper Industry Machinery Market by Mordor Intelligence
The paper industry machinery market size is projected to be USD 114.31 billion in 2025, USD 118.93 billion in 2026, and reach USD 148.59 billion by 2031, growing at a CAGR of 4.55% from 2026 to 2031. Production managers are prioritizing retrofits that lower energy and water use per tonne, reflecting tighter emission limits and volatile pulp costs. Semi-automatic lines still dominate, yet fully automatic systems are gaining favor in high-wage regions where predictive maintenance and real-time quality control justify higher capital outlays. Mills in Asia-Pacific continue to ramp up tissue and containerboard capacity to serve e-commerce packaging demand, while North American and European mills rebuild existing machines to cut steam consumption and comply with nitrogen-oxide limits. Competitive strategies now revolve around bundling hardware with digital-twin software, locking in long-term service revenue and raising switching costs for mills.
Key Report Takeaways
- By operation mode, semi-automatic machinery led the paper industry machinery market with 48.89% share in 2025, while fully automatic systems are advancing at a 5.84% CAGR through 2031.
- By machinery type, paper production equipment accounted for 42.35% of the paper industry machinery market size in 2025, whereas pulp-molding machinery is projected to expand at a 5.35% CAGR to 2031.
- By paper type, packaging and kraft paper machines captured 45.62% of the paper industry machinery market share in 2025, yet tissue and hygiene equipment is forecast to grow at a 5.63% CAGR during 2026-2031.
- By end user, pulp and paper mills represented 70.84% of market share in 2025, but tissue producers are expected to post a 6.02% CAGR through 2031.
- By geography, Asia-Pacific held 40.16% of in 2025 and is anticipated to grow at a 5.71% CAGR over the forecast period.
Note: Market size and forecast figures in this report are generated using Mordor Intelligence’s proprietary estimation framework, updated with the latest available data and insights as of January 2026.
Market Trends and Insights
Drivers Impact Analysis of Paper Industry Machinery Market*
| Driver | (~) % Impact on CAGR Forecast | Geographic Relevance | Impact Timeline |
|---|---|---|---|
| E-Commerce-Led Surge in Corrugated and Packaging Demand | +1.2% | Global, concentrated in North America, Europe and Asia-Pacific | Medium term (2-4 years) |
| Expansion of Pulp-Molded Sustainable Packaging Lines | +0.9% | Global, led by Europe and North America, expanding in Asia-Pacific | Medium term (2-4 years) |
| Mill Upgrades for Energy and Water-Efficient Production | +0.8% | Global, strongest in Europe and North America, spreading to Asia-Pacific | Long term (≥ 4 years) |
| Government Bans on Single-Use Plastics | +0.7% | Europe, India, Southeast Asia, select U.S. states | Short term (≤ 2 years) |
| Rapid Automation and Industry 4.0 Retrofits in Mills | +0.6% | North America, Europe, China, Japan, South Korea | Medium term (2-4 years) |
| Near-Shoring of Paper-Product Supply Chains | +0.4% | North America and Europe with spillover to Mexico, Eastern Europe, Turkey | Long term (≥ 4 years) |
| Source: Mordor Intelligence | |||
E-Commerce-Led Surge in Corrugated and Packaging Demand
Online retail continues to grow faster than GDP, pushing converters to install high-speed corrugators that handle variable order sizes without lengthy changeovers.[1] Producers such as Graphic Packaging allocated USD 1.2 billion in 2024 for a recycled-containerboard mill in Texas to capture direct-to-consumer box demand. Mondi’s EUR 400 million (USD 440 million) kraft-paper machine in the Czech Republic added 330,000 tpy and relieved supply tightness in Central Europe. Digital printing and inline die-cut attachments are now standard on new lines, shrinking setup time and enabling 24-hour turnaround for custom packs. Converters delaying automation risk contract losses to rivals offering rapid, low-waste production.
Expansion of Pulp-Molded Sustainable Packaging Lines
Brand owners switching from foam clamshells to molded fiber are fueling a global build-out of pulp-molding machines. PulPac’s dry-molded-fiber technology, commercialized with ANDRITZ and Valmet, eliminates water-intensive drying ovens and reaches plastic-grade cycle times.[2] Huhtamaki is enlarging molded-fiber capacity across Europe and North America to supply bans on single-use plastics. Toscotec’s tissue machine for Saudi Paper Group shows Middle Eastern mills diversifying into fiber-formed food packaging. Once virgin-pulp stays below USD 1,200 per tonne, the total cost of molded fiber undercuts plastic, especially when converters amortize tooling over long runs. Mills that colocate pulp-molding with tissue lines cut fiber logistics and raise asset utilization.
Mill Upgrades for Energy and Water-Efficient Production
Energy and water account for up to a quarter of mill cash costs, so payback on efficiency retrofits is short. Voith’s XcelLine rebuild at Stora Enso’s PM6 cut steam use 20% and water intake 30%. Valmet’s AI platform trims dryer-section steam and compressed-air leaks, with sub-18-month returns. ANDRITZ’s SulfoLoop recovers sulfuric acid from liquor, helping mills in Germany avoid million-euro discharge penalties. Closed-loop water systems matter in drought-prone Spain and parts of Asia-Pacific where freshwater allocation is restricted. Mills lacking such upgrades risk forced output cuts during water shortages.
Government Bans on Single-Use Plastics
The European Union’s 2024 directive eliminated plastic cutlery and straws, spurring a 12% jump in specialty-paper machinery orders. India’s phased ban raised imports of kraft-bag and paper-straw machines by 14% in fiscal 2026. Heinzelpaper’s PM11 rebuild in Austria lifted kraft-paper capacity to meet food-service packaging demand. U.S. regulation is patchy, so producers are installing flexible lines that switch among straw, bag and cutlery grades to hedge policy shifts. Mills fixed on a single grade face under-utilization if local rules change.
Restraints Impact Analysis of Paper Industry Machinery Market*
| Restraint | (~) % Impact on CAGR Forecast | Geographic Relevance | Impact Timeline |
|---|---|---|---|
| Volatility in Pulp and Recycled-Fiber Prices | -0.9% | Global, acute in North America and Europe | Short term (≤ 2 years) |
| High CAPEX of Next-Gen Automated Machines | -0.7% | Global, steeper impact in emerging markets | Medium term (2-4 years) |
| Skilled-Labor Shortages for Smart-Machine Operation | -0.5% | North America, Europe, Japan, South Korea, Australia | Long term (≥ 4 years) |
| Emission-Compliance Costs in Energy-Intensive Mills | -0.4% | Europe, California, Northeast U.S., select Asia-Pacific | Medium term (2-4 years) |
| Source: Mordor Intelligence | |||
Volatility in Pulp and Recycled-Fiber Prices
Old corrugated container prices in the United States spiked 117% year-on-year in Q1 2024, then retreated as Chinese import curbs relaxed collection pressures. The Federal Reserve’s pulp and paper Producer Price Index swung between 105 and 115 in 2024, squeezing mill margins.[3] Capacity additions of 16 million tpy in Asia-Pacific and retirements in North America deepened regional fiber price gaps. Small mills facing thin margins defer machinery upgrades when fiber costs jump, causing uneven order pipelines for OEMs. Long-term fiber contracts or backward integration help stabilize input costs but demand large capital that many independents lack.
High CAPEX of Next-Gen Automated Machines
A premium through-air-drying tissue line can exceed USD 600 million, limiting buyers to integrated majors. Valmet’s TAD supply to Irving Consumer Products in Georgia required that scale of outlay for 75,000 tpy of capacity. Sappi spent USD 500 million on its Somerset PM2 rebuild to capture high-margin paperboard sales. Emerging-market producers often pick semi-automatic lines priced 40-60% lower, accepting higher labor dependency. Modular designs that add automation in phases ease the burden but still require scarce project finance in Africa and parts of South America.
*Our forecasts treat driver/restraint impacts as directional, not additive. The impact forecasts reflect baseline growth, mix effects, and variable interactions.
Paper Industry Machinery Market Segment Analysis
By Operation Mode:
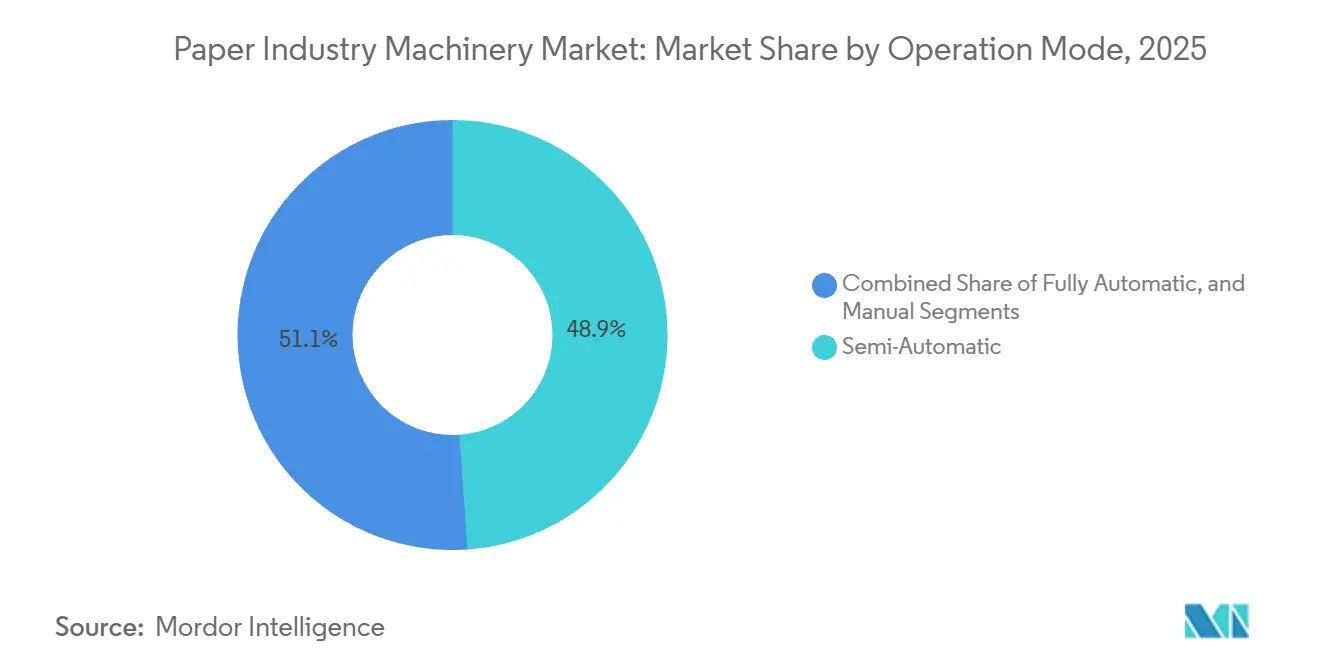
Automation Gains Traction Despite Semi-Automatic DominanceSemi-automatic equipment held 48.89% of the paper industry machinery market in 2025, mirroring its capital-efficient appeal for mills in Asia-Pacific and Africa. Fully automatic systems, forecast to grow at 5.84% annually, entice high-wage mills with predictive maintenance and autonomous quality control that cut downtime. Manual machines linger in R&D or specialty niches but keep losing ground. Voith’s MillOne digital-twin suite delivers up to 10% throughput gains and 20% downtime cuts, validating the value proposition. Georgia-Pacific achieved sub-year payback after linking dataPARC analytics to steam optimization. Chinese and Indian OEMs now ship mid-tier lines with PLC controls that offer 70-80% of European functionality at half the cost, narrowing the gap. As retirement of older technicians accelerates, the calculus tilts further toward automation since skilled labor premiums keep climbing. Over the forecast horizon, mills upgrading to fully automatic platforms will underpin efficiency benchmarks demanded by brand owners and regulators.
Despite the momentum, the paper industry machinery market size tied to semi-automatic lines will remain substantial because many mid-scale mills lack financing for end-to-end autonomy. Credit constraints and volatile pulp margins encourage staged upgrades, often beginning with automated reel handling before moving into AI quality loops. Vendors able to retrofit smart modules onto existing frames gain an advantage by stretching buyer cash flows. The coexistence of both modes creates a bifurcated servicing landscape, with OEMs offering long-term digital contracts to fully automated sites while component suppliers cater to semi-automatic installations needing periodic mechanical overhauls.

By Machinery Type:
Pulp-Molding Lines Accelerate as Core Paper Machines Keep Leading SharePaper production machinery accounted for 42.35% of market share in 2025, anchored by large tissue and containerboard lines that drive base-sheet output. Pulp-molding machinery, expanding at 5.35% annually, addresses plastic-replacement mandates through dry-molded-fiber technology co-developed by ANDRITZ and Valmet. Converting equipment rides the same e-commerce wave as corrugators, whereas demand for conventional pulp digesters softens as recycled furnish grows in share. ANDRITZ’s EUR 70 million (USD 77 million) purchase of A. Celli strengthened its tissue offering. Ancillary systems that capture waste heat or treat effluent are becoming mandatory in Europe, altering the sales mix toward integrated packages.
The paper industry machinery market for core paper machines will still dwarf pulp-molding gear, but the growth differential favors molded-fiber lines. OEMs now bundle forming modules, deflashing robots, and quality scanners into plug-and-play cells, allowing converters to scale output in 10,000-unit increments rather than traditional 100,000-unit steps. Mills are adding pulp-molding adjacent to tissue production, recycling broke and edge trim internally, cutting fiber loss and truck miles. Those synergies raise internal rates of return and justify premium pricing for integrated lines. Vendors that treat molding as an adjunct to traditional machines are best placed to win mill-wide CAPEX budgets.
By Paper Type:
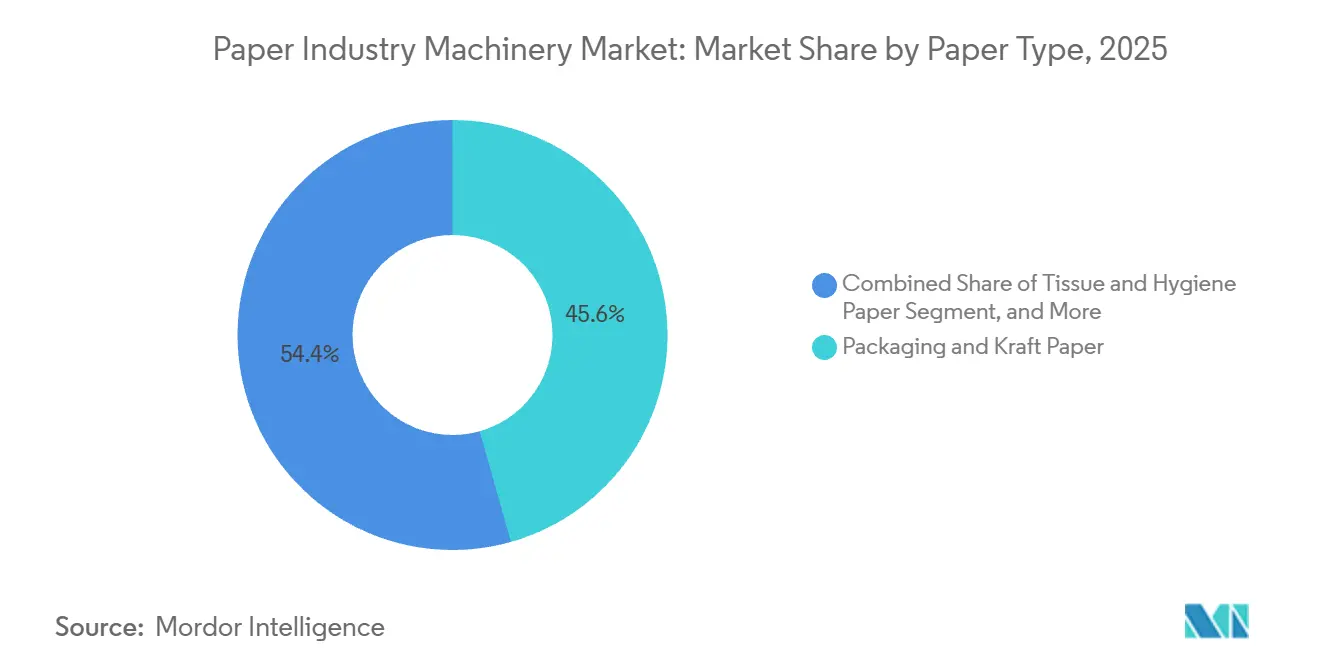
Tissue and Hygiene Outpace Packaging, Graphic Grades RetreatPackaging and kraft machines commanded 45.62% of market share in 2025, reflecting corrugated demand for fulfillment boxes and industrial wraps. Tissue machinery is set to expand at 5.63% annually as rising incomes boost per-capita usage and retailers demand premium softness. Graphic and printing paper machines face secular decline, accelerating mill conversions to linerboard. Metsä Tissue doubled capacity at Mariestad with a USD 407 million Valmet DCT line that targets premium away-from-home towels. Kruger Products’ CAD 240 million (USD 181 million) light-dry-crepe line in Quebec underscores North America’s pivot to domestic supply.
The paper industry machinery market share influence of packaging will persist, yet tissue’s faster CAGR bolsters supplier order books. High-bulk TAD and DCT machines yield better margins, encouraging European and U.S. mills to decommission outdated newsprint lines for tissue conversions. Specialty paper machinery, though small, captures resilient niches such as medical packaging and currency security where digital substitution is minimal. OEMs able to provide multi-grade flexibility help mills hedge demand cycles, strengthening long-term service contracts.
By End-User:
Tissue Producers Expand Faster Than Integrated MillsIntegrated pulp and paper mills purchased 70.84% of the market share in 2025, reflecting their need for large-format machines and ancillary balance-of-plant systems. Tissue-only producers will, however, post a 6.02% CAGR as demographic growth and premiumization lift demand for soft, absorbent products. Sofidel’s Duluth, Georgia, expansion features an automated warehouse that optimizes logistics throughput. Essity’s AI partnership with Accenture and Microsoft shows hygiene players treating digital twins as competitive weapons.
While packaging converters invest mainly in corrugators, some are integrating upstream into containerboard mills as Graphic Packaging did, narrowing merchant sales channels. Multisegment producers smooth revenue swings and secure better bargaining power with OEMs by bundling orders. Still, complexity in operating diverse product mixes raises skill and maintenance requirements, reinforcing demand for sophisticated automation platforms.
Geography Analysis
APAC Paper Industry Machinery Market
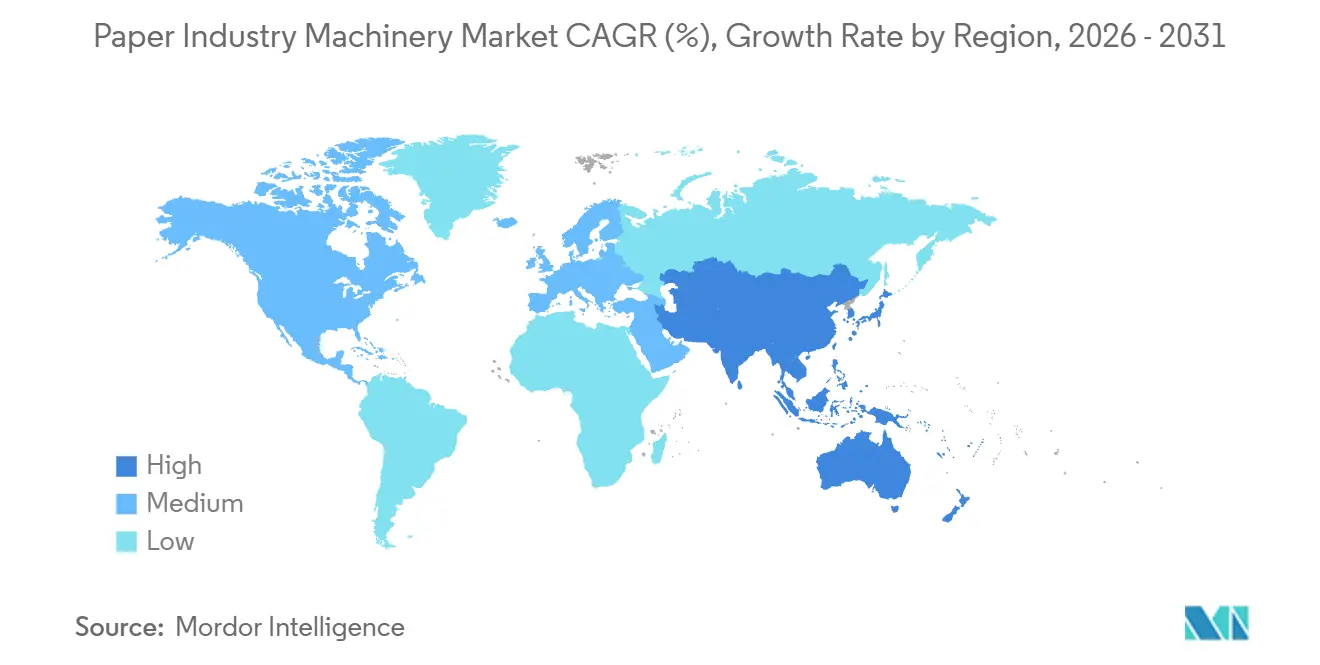
Asia-Pacific generated 40.16% of market share in 2025 and is projected to post a 5.71% CAGR through 2031. China produced 158.469 million t of paper in 2024, up 8.6%, and continues ordering 11-meter-wide containerboard machines that rival Europe’s largest lines. India operates roughly 550 mills yet consumes only 16 kg per capita, leaving ample growth headroom and spurring fresh investment in mid-scale semi-automatic tissue lines. Vietnam and Indonesia are fast followers as e-commerce adoption pushes box demand.
North America Paper Industry Machinery Market
North America focuses on modernization rather than greenfield builds. The U.S. operating rate reached 87.5% in 2024 as older machines were scrapped, a dynamic that sustains pricing power. Valmet’s tissue order for Irving Consumer Products in Georgia and Georgia-Pacific’s USD 150 million rebuild in Oregon highlight the trend toward premium grades and energy-efficient configurations. Canadian producers upgrade machines to lock in supply security and cut currency exposure.
Europe Paper Industry Machinery Market
Europe balances strict emission rules with competitiveness. Voith’s XcelLine rebuilds in Sweden and Austria cut steam and water inputs, meeting carbon targets while raising output. Mondi’s USD 440 million Štětí kraft-paper machine and heinzelpaper’s capacity jump to 470,000 tpy exemplify selective investment in high-margin niches. Eastern Europe benefits from near-shoring as converters serving Western Europe shorten lead times.
MEA and South America Paper Industry Machinery Market
South America leverages low-cost eucalyptus pulp and renewable energy. Suzano’s USD 2.8 billion single-line mill generates surplus power and cements Brazil’s position as a global pulp exporter. Brazilian machinery imports soared 172.7% in 2024, with Finland accounting for 43.3% of shipments. Middle East and Africa remain small but are installing tissue lines in Saudi Arabia and the UAE to cut imports and meet population growth.
Regulatory Landscape
Paper industry machinery demand is being shaped by packaging sustainability rules and tighter mill emissions and effluent compliance, which steer investments toward recycled-fiber capability, resource efficiency, and traceability-ready automation. A key anchor is the EU Packaging and Packaging Waste Regulation, Regulation (EU) 2025/40. It entered into force on February 11, 2025, applies from August 12, 2026, and its implementing acts on harmonized labels and specifications are scheduled for adoption by August 12, 2026. These timelines influence equipment specifications for packaging and kraft grades, and they are already pushing upgrades in stock preparation, forming, and converting to meet recyclability and minimization requirements.
In parallel, compliance economics increasingly reward energy- and water-saving rebuilds and modern control systems. EU standardization activity around packaging minimization and recyclability assessment (including requests to European standardization bodies due by February 12, 2027) supports demand for equipment that can document performance and material efficiency. This reinforces OEM offerings that pair machines with automation and lifecycle services, helping mills demonstrate compliance and reduce the risk of discharge and air-emission nonconformance.
Value Chain Analysis
The paper industry machinery value chain runs from raw materials and key components (steel structures, rolls, drives, motors, instrumentation, valves, and actuators) to engineering and fabrication by OEMs. It then moves through project execution and installation via EPC and mill contractors, followed by commissioning, with a large aftermarket that spans wear parts, rolls, and felts, plus automation upgrades and lifecycle service agreements. Recent market behavior shows OEMs emphasizing service-led models and automation bundles to monetize the installed base as mills prioritize rebuilds and efficiency retrofits alongside selective greenfield projects. This direction aligns with the strategies highlighted among providers such as Valmet, ABB, and ANDRITZ.
On the demand side, buyers cluster among integrated pulp and paper producers and packaging-focused converters that increasingly look for turnkey lines, digital diagnostics, and performance guarantees. With regulatory-driven transparency and traceability requirements, especially for packaging placed on the market in Europe from August 2026 under Regulation (EU) 2025/40, documentation needs increase across the chain. That raises the value of integrated control, quality, and reporting layers delivered with new machines and rebuild packages.
Competitive Landscape
The market is moderately concentrated with players like Voith, Valmet and others. Established OEMs differentiate through bundled digital-twin software, predictive-maintenance platforms and 10-year service contracts that lock in aftermarket revenue. ANDRITZ’s EUR 100 million (USD 110 million) acquisition of Diamond Power added boiler-cleaning and ash-handling to its mill-wide offering.
White-space innovation centers on retrofit kits enabling higher recycled-fiber ratios without tensile loss, pulp-molding lines for food-service disposables and waste-heat recovery turbines that export electricity. Toscotec and Bellmer specialize in customized tissue machines with faster commissioning, appealing to family-owned converters needing short payback periods. Digital twins optimizing dryer steam, refiner gaps and chemical dosing lift throughput 5-10% and energy savings 10-15% after installation.
Chinese OEMs compete aggressively on price, offering semi-automatic lines 30-40% below European equivalents and delivering within six months. Their presence forces incumbents to offer stripped-down variants or regional assembly. Japanese suppliers conserve niche share by focusing on super-calendar technology for premium coated grades. Overall, competitive intensity is moderate with clear stratification by technology depth and service wrap.
Leaders of Paper Industry Machinery Market
-
Valmet Oyj
-
ANDRITZ AG
-
ABB Ltd.
-
Bellmer GmbH
-
Barry-Wehmiller Group
- *Disclaimer: Major Players sorted in no particular order
Paper Industry Machinery Market Companies Covered in this Report
- Voith GmbH & Co. KGaA
- Valmet Oyj
- ANDRITZ AG
- ABB Ltd.
- Bellmer GmbH
- Barry-Wehmiller Group
- Toscotec S.p.A.
- Kadant Inc.
- Mitsubishi Heavy Industries Machinery Systems, Ltd.
- IHI Corporation
- A.Celli Group
- Kawanoe Zoki Co., Ltd.
- Parason Machinery India Pvt. Ltd.
- Beston Group Co., Ltd.
- HOBEMA Maschinenfabrik GmbH
- Popp Maschinenbau GmbH
- Baosuo Paper Machinery Manufacture Co., Ltd.
- Recard S.p.A.
- Cellwood Machinery AB
Market Opportunities and Future Outlook
Compliance-led packaging transformation and recycled-fiber capability upgrades remain a central whitespace for machinery suppliers, particularly where regulations specify recyclability, minimization, and labeling obligations on packaging placed on the market. The EU Packaging and Packaging Waste Regulation (EU) 2025/40, applying from August 12, 2026, creates a clear timing signal for investment in board, kraft, and converting assets that can run higher recycled content with stable quality. It also strengthens demand for automation and inline measurement that supports documentation.
Named projects and supplier moves show where spending is concentrating. Valmet’s July 2026 order to deliver a full board making line with automation and lifecycle support to Sun Paper in Nanning, China points to continued scale investment in packaging grades with service wrap. ANDRITZ’s recycling and stock-preparation wins in 2026, including OCC systems and large pulping references, support the opportunity around recovered-fiber processing. Vendor portfolio expansion also enlarges the installed-base service opportunity, consistent with ABB’s July 2026 announced recommended cash offer for Rotork plc, which is tied to deepening flow-control and actuation capabilities that feed into mill reliability, energy management, and process-optimization programs.
Recent Industry Developments in Paper Industry Machinery Market
- July 2026: Valmet Oyj delivers a full board making line with automation and lifecycle support to Sun Paper's Nanning mill in China; start-up scheduled for fall 2027. The board-making machinery upgrade supports Sun Paper's packaging capability and energy efficiency outcomes, while Valmet expands its bundled offering in Asia-Pacific.
- July 2026: ANDRITZ AG DS Smith starts up a stock preparation line at its Porcari mill in Italy, featuring Europe’s largest FibreFlow drum pulper. The capacity addition improves recycling efficiency for consumer packaging conversions and expands ANDRITZ’s reference in Europe.
- July 2026: ANDRITZ AG Minhan Paper Joint Stock Company orders a complete OCC recycling line for its mill in Hung Yen province, Vietnam; start-up scheduled for H1 2027. The expansion increases local recycling capacity and feedstock flexibility, broadening ANDRITZ's footprint in emerging packaging markets.
Paper Industry Machinery Market Report Scope and Research Methodology
Market Definition and Coverage
This market covers machinery and systems used to convert fiber into paper and board products, including key equipment across pulping, stock preparation, paper production, and related finishing stages. Revenue is measured as equipment sales globally.
Scope exclusions: Used equipment resale and purely on-site civil construction work are excluded unless they are bundled as part of an equipment delivery contract.
Segments Covered in This Report
- By Operation Mode
- Fully Automatic
- Semi-automatic
- Manual
- By Machinery Type
- Wood Preparation and Pulp Mill Machinery
- Paper Production Machines
- Converting and Finishing Machines
- Pulp-Moulding Machines
- Ancillary Systems
- By End-user Industry
- Packaging
- Pulp and Paper Producers
- Print and Publishing
- Food and Beverage
- Other End-user Industries
- By Paper Grade
- Packaging and Kraft Paper Lines
- Tissue and Hygiene Paper Lines
- Graphic and Printing Paper Lines
- Specialty and Security Paper Lines
- By Geography
- North America
- United States
- Canada
- Mexico
- South America
- Brazil
- Argentina
- Chile
- Rest of South America
- Europe
- United Kingdom
- Germany
- France
- Italy
- Spain
- Rest of Europe
- Asia-Pacific
- China
- India
- Japan
- South Korea
- Australia
- Rest of Asia-Pacific
- Middle East and Africa
- Middle East
- Saudi Arabia
- United Arab Emirates
- Turkey
- Rest of Middle East
- Africa
- South Africa
- Nigeria
- Rest of Africa
- Middle East
- North America
Data Sources, Market Sizing, and Validation
Desk Research
Desk research was used to build the base structure of the market model and to separate machinery revenue from wider mill project spending. Public statistics and technical references were reviewed to understand paper and paperboard output trends, trade flows, and investment signals that usually pull machinery demand.
Sources included non-paywalled or official references such as FAO forestry and paper statistics, UN Comtrade trade data for relevant machinery categories, World Bank macro indicators, IEA industrial energy datasets, and association or institute publications such as those from TAPPI or CEPI. We also reviewed company annual reports, investor presentations, and credible news coverage for capacity additions, rebuild cycles, and order timing. Where needed, paid subscriptions were used for company financials and news screening, contract and tender tracking, import and export shipment-level checks, and patent databases to sense technology upgrade direction. The sources listed here are illustrative only, and additional public and paid references were used for data collection, validation, and clarification.
Primary Interviews and Surveys
Primary work focused on validating what buyers typically purchase in a rebuild versus a greenfield line, and how quotes translate into recognized equipment revenue by year. We spoke with a mix of machinery-side and mill-side experts across major regions to pressure test assumptions on line configuration, retrofit frequency, lead times, and regional pricing. Any conflicting inputs were re-checked before the model was finalized.
Distribution of primary research fieldwork respondents
| Company type | Respondent position | Region |
|---|---|---|
| Top tier: 36% | CXOs: 15% | APAC: 43% |
| Mid tier: 49% | Functional/Unit leaders: 37% | EMEA: 35% |
| Smaller Players: 15% | Managers: 48% | Americas: 22% |
Market-Sizing & Forecasting
Sizing used a mix of top-down and bottom-up checks so totals remain tied to real mill activity and procurement patterns. In the top-down build, paper and board production and trade signals were translated into machinery demand using replacement cycles, capacity expansion timing, and investment intensity by paper grade, then adjusted by region.
To keep the model practical, inputs included announced capacity additions and closures, rebuild versus new machine mix, typical equipment scope by machine section (stock preparation and pulping, forming, press, drying, winding and finishing), lead-time patterns, and average selling price ranges that move with steel and energy costs. Select bottom-up approximations were then used to corroborate the totals, including roll-ups from a sample of supplier revenues, channel checks on order pipelines, and ASP times estimated unit shipments for a few machinery categories. When gaps existed, especially for smaller projects and service-heavy contracts, assumptions were filled using regional mix and project-count proxies that were validated through interviews.
Forecasting relied on scenario analysis anchored to a base case, since investment cycles can swing with packaging demand, tissue consumption, and mill cash flow. Variables such as containerboard demand growth, tissue capacity utilization, energy prices, recovered fiber availability, and compliance-driven rebuild timing were used to shape the outlook, and the final path was aligned to expert views on budget behavior by region.
Data Validation & Update Cycle
Outputs were checked against independent signals so the model stayed aligned with real market behavior, including paper production trends, equipment import patterns, and the pace of mill project announcements. Large variances were reviewed in a second pass, followed by another check on currency timing and outlier pricing assumptions before sign-off.
If an input shifted materially, such as a major mill delay, a policy change affecting fiber sourcing, or a sharp move in energy costs, the related assumptions were revisited and revalidated with experts. Reports are refreshed annually, with interim updates when market events are significant. Before delivery, a final analyst pass is completed so clients receive the most current view available at the time.
Mordor Intelligence's Global Paper Industry Machinery Market Sizing Compared With Other Published Estimates
Published market values often differ because the scope line can shift between full mill equipment packages, narrower paper-machine-only definitions, and adjacent items like installation and services, which changes what gets counted as revenue. Differences also come from how rebuild projects are allocated into annual revenue, which year is chosen for currency conversion, and whether the numbers were refreshed after major capacity plans changed.
The table shows a spread that mainly comes from what equipment stages are included and how rebuild intensity is treated. Under Mordor Intelligence's scope, the value counts major machinery across pulping, stock preparation, paper production, and finishing purchased by mills and packaging producers, rather than limiting totals to only paper making machines.
Benchmark comparison
| Source | Market Size | Gaps in Research Methodology |
|---|---|---|
| Mordor Intelligence | USD 114.31 B (2025) | |
| Trade Journal A | USD 24.26 B (2024) | Uses a tighter definition centered on pulp and paper making equipment line items, which can exclude broader machinery packages across multiple process stages and some finishing scope, thereby compressing the revenue pool. |
| Regional Consultancy B | USD 30.30 B (2025) | Leans toward a machinery-only view with conservative replacement assumptions and a longer cycle outlook, which tends to undercount rebuild frequency and makes results more sensitive to the chosen base year and price progression. |
Taken together, the spread is mostly explained by scope inclusions across the process line and by how project timing is converted into yearly revenue. Our approach keeps the steps repeatable by tying demand to production and investment signals, then checking outputs against expert feedback and observable trade and project activity.
Key Questions Answered in the Report
How large will paper industry machinery market size be in 2031?
It is forecast to reach USD 148.59 billion by 2031, advancing at a 4.55% CAGR from 2026.
Which operation mode is growing fastest?
Fully automatic systems are projected to expand at a 5.84% CAGR through 2031, driven by labor-cost inflation and digital-twin adoption.
Why is Asia-Pacific leading demand growth?
The region adds new tissue and containerboard capacity to serve rising per-capita consumption and e-commerce packaging, posting a 5.71% CAGR through 2031.
What is the top restraint on new equipment investment?
High capital expenditure for next-generation automated machines, often exceeding USD 500 million per line, discourages smaller mills from upgrading.
Which machinery type shows the strongest growth?
Pulp-molding equipment is expected to grow at 5.35% annually as brand owners replace plastic packaging with molded fiber solutions.
How are OEMs differentiating their offerings?
Leading suppliers bundle hardware with digital-twin software and long-term service contracts that cut downtime and lock in aftermarket revenue.