Frequency Meter Market Size and Share
Market Overview
| Study Period | 2020 - 2031 |
|---|---|
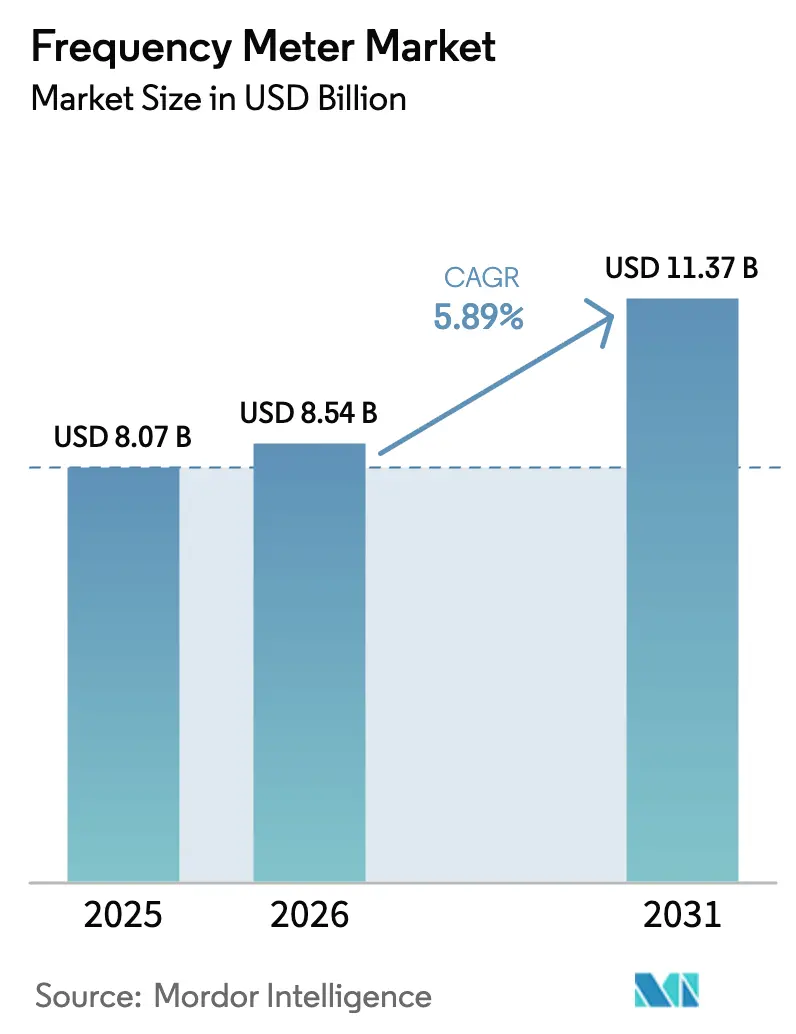
| Market Size (2026) | USD 8.54 Billion |
| Market Size (2031) | USD 11.37 Billion |
| Growth Rate (2026 - 2031) | 5.89% CAGR |
| Fastest Growing Market | Asia Pacific |
| Largest Market | Asia Pacific |
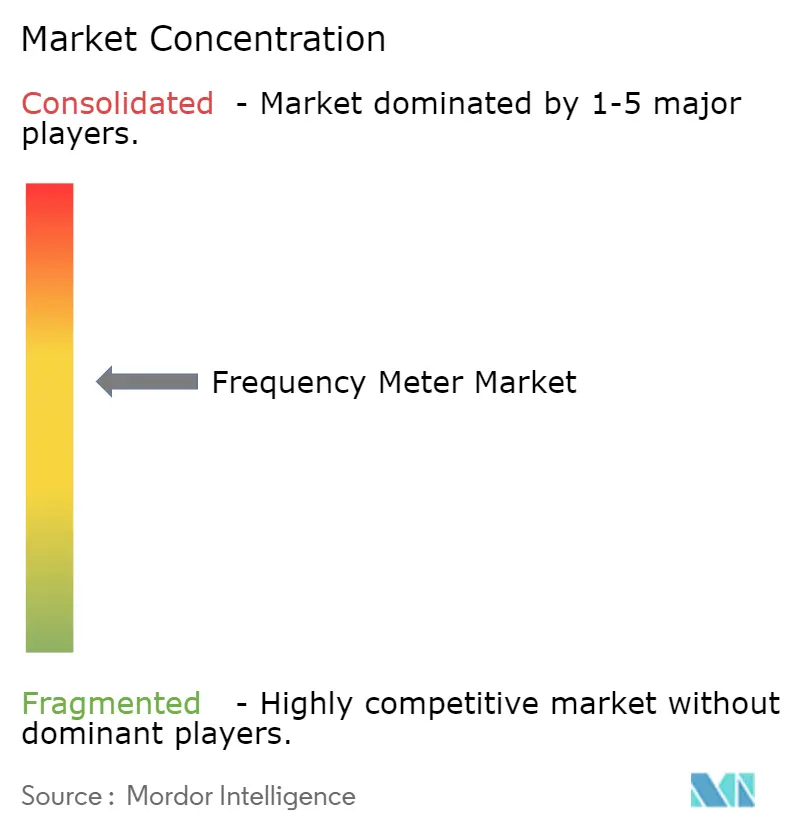
| Market Concentration | Medium |
Major Players*Disclaimer: Major Players sorted in no particular order Image © Mordor Intelligence. Reuse requires attribution under CC BY 4.0. |
|
Frequency Meter Market Analysis by Mordor Intelligence
The frequency meter market size was valued at USD 8.07 billion in 2025 and estimated to grow from USD 8.54 billion in 2026 to reach USD 11.37 billion by 2031, at a CAGR of 5.89% during the forecast period (2026-2031). Digital transformation across telecommunications, automotive electrification, and advanced industrial automation fuels this steady climb as organizations replace legacy analog counters with software-defined, precision digital instruments capable of sub-milli-hertz resolution. Rapid 5G and early 6G rollouts require tight frequency tolerance testing from 100 kHz to above 100 GHz, while smart-grid upgrades demand continuous frequency monitoring to accommodate intermittent renewable inputs.[1]European Commission, “Grids, the Missing Link—An EU Action Plan for Grids,” eur-lex.europa.eu Government-backed investments in quantum computing and photonics laboratories layer in new ultra-high-frequency requirements, and rising electric-vehicle (EV) volumes call for sophisticated frequency domain analysis of power-electronics noise. At the same time, semiconductor capital expenditure for test equipment, projected to lift global test sales 13.8% to USD 7.1 billion in 2024, cascades into fresh demand for high-speed frequency counters.[2]SEMI, “Global Total Semiconductor Equipment Sales Forecast to Reach a Record of $139 Billion in 2026,” semi.org
Key Report Takeaways
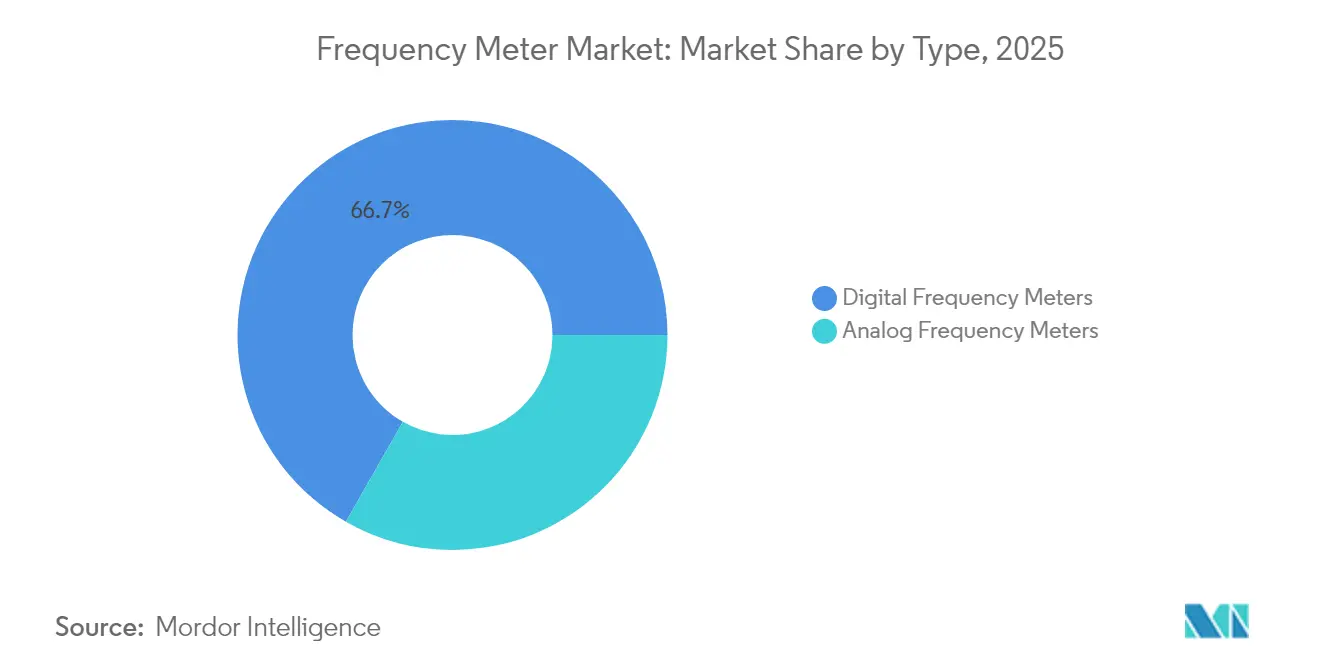
- By type, digital instruments led with 66.74% of frequency meter market share in 2025, and the segment expands at a 6.11% CAGR to 2031.
- By frequency range, the medium band (100 kHz–1 GHz) captured 53.05% share of the frequency meter market size in 2025, whereas the high-frequency band (> 1 GHz) records the briskest 6.94% CAGR through 2031.
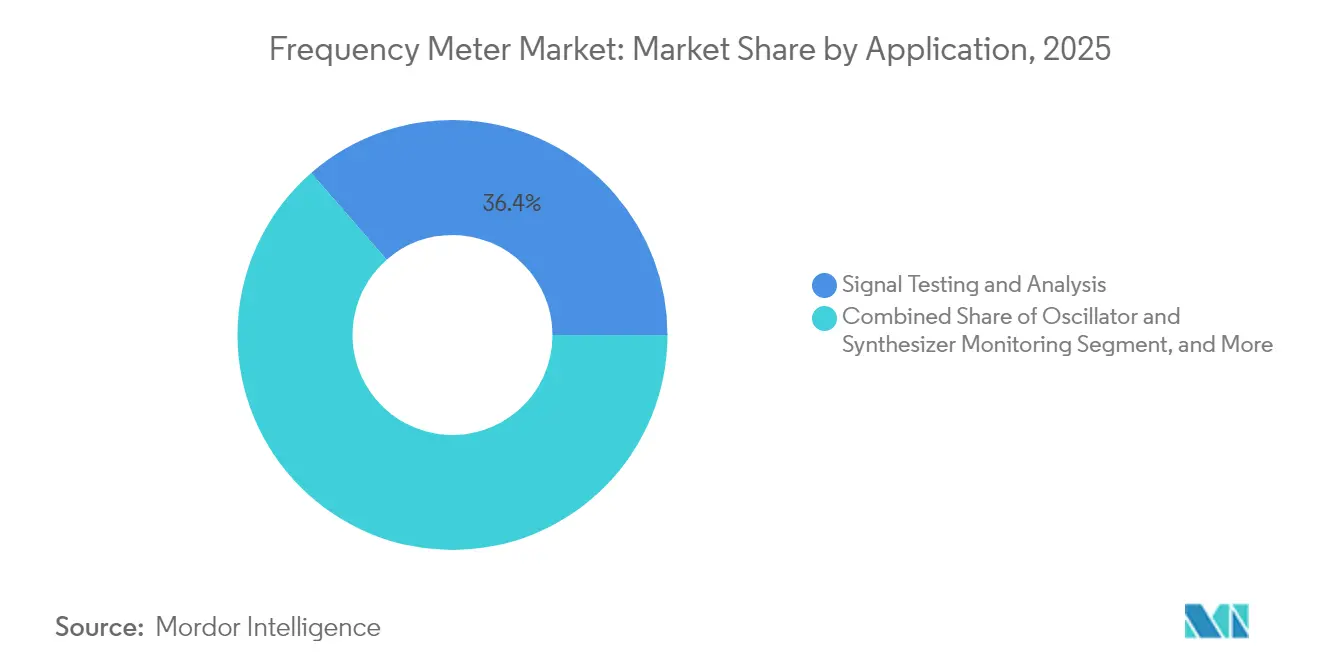
- By application, signal testing and analysis dominated at 36.42% revenue in 2025, while calibration and metrology grows fastest at 6.28% CAGR.
- By end-use, telecommunications held 41.12% of the frequency meter market in 2025; automotive and e-mobility log the strongest 7.62% CAGR to 2031.
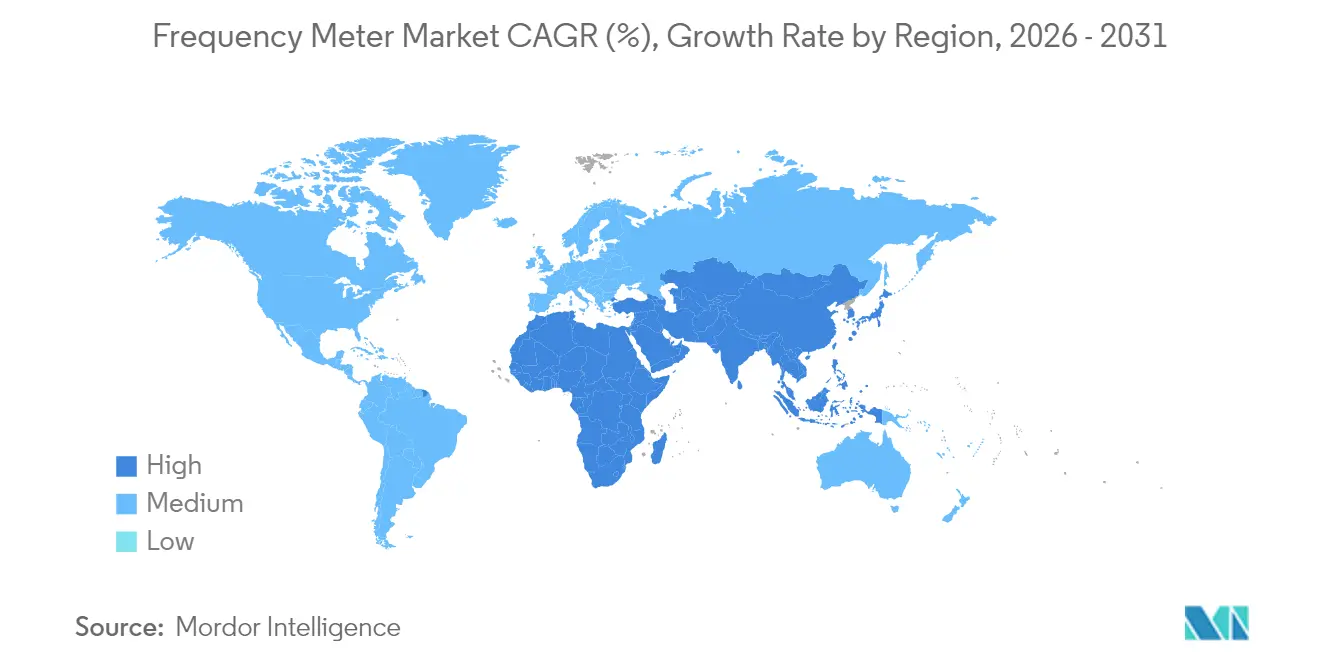
- By geography, Asia-Pacific commanded 33.48% of the frequency meter market size in 2025 and leads regional growth at a 6.18% CAGR.
Note: Market size and forecast figures in this report are generated using Mordor Intelligence’s proprietary estimation framework, updated with the latest available data and insights as of 2026.
Global Frequency Meter Market Trends and Insights
Drivers Impact Analysis*
| Driver | (~) % Impact on CAGR Forecast | Geographic Relevance | Impact Timeline |
|---|---|---|---|
| Expansion of smart-grid frequency monitoring | +1.2% | Europe, North America, spill-over to APAC | Medium term (2-4 years) |
| Surging precision-test demand in 5G and mmWave networks | +0.8% | APAC core, global spill-over | Short term (≤ 2 years) |
| Accelerating R&D spend in quantum and photonics labs | +0.9% | North America & EU, emerging APAC | Long term (≥ 4 years) |
| Safety compliance mandates for EV power-electronics | +0.6% | China, expanding globally | Medium term (2-4 years) |
| Defense modernization requiring wide-band test sets | +0.4% | Middle East, North America, Europe | Long term (≥ 4 years) |
| Source: Mordor Intelligence | |||
Expansion of Smart-Grid Frequency Monitoring, Led by Europe
Europe has earmarked EUR 584 billion for grid upgrades by 2030, with frequency stability a top priority to integrate 60% more consumption and high renewable inputsu. Transmission system operators enforce ±10 mHz dead-bands that analog meters struggle to track consistently. Digital frequency meters therefore find accelerated adoption as CEN-CENELEC standardization harmonizes accuracy classes, and similar technical rules migrate to North America and parts of APAC. Utilities also require continuous logging and cloud APIs to support grid-edge analytics, further boosting the frequency meter market.
Surging Precision-Test Demand in 5G and mmWave Networks (Asia)
Widespread 5G rollouts across China, South Korea, India, and Japan push operators to certify carrier aggregation and mmWave backhaul in the 24-44 GHz ranges under stringent emissions rules. Leading vendors released vector-signal-analyzer platforms with phase-noise floors below -140 dBc/Hz to meet new compliance thresholds. The GSMA reports 1.8 billion APAC subscribers underpinning USD 880 billion in economic value, producing large-scale purchase orders for high-frequency counters-. Continuous mmWave densification sustains 0.8% uplift to the forecast CAGR of the frequency meter market.
Accelerating R&D Spend in Quantum and Photonics Labs (US, Germany)
Quantum computing prototypes rely on sub-hertz resolution at microwave and optical harmonics above 100 GHz to characterize qubit coherence. NIST’s facility upgrade request of USD 6.6 billion over 12 years underscores escalating infrastructure needs for precision metrology. Germany’s funding of photonics-based terahertz synthesizers extends these demands to 500 GHz carriers.[3]Rohde & Schwarz, “Photonics-Based Ultra-Stable Tunable THz System for 6G,” rohde-schwarz.com The frequency meter market benefits as laboratories purchase ultra-wide-band counters with self-calibrating references.
Safety Compliance Mandates for EV Power-Electronics (China)
China’s EV safety code now requires inverter frequency-domain characterization, driving procurement of wide-band counters capable of capturing PWM harmonics up to 150 kHz and radio noise above 30 MHz. Research shows partial-discharge tests under realistic PWM stress improve insulation lifetime modeling. Tektronix’s acquisition of Elektro-Automatik added regenerative power supplies with embedded frequency meters to address these mandates. Regulatory enforcement therefore adds 0.6 percentage points to frequency meter market growth.
Restraints Impact Analysis*
| Restraint | (~) % Impact on CAGR Forecast | Geographic Relevance | Impact Timeline |
|---|---|---|---|
| Capital-Intensive Transition from Analog to High-Res Digital Counters | -0.7% | Global, particularly emerging markets | Short term (≤ 2 years) |
| Scarcity of Metrology-Grade Calibration Facilities in South America | -0.5% | South America, expanding to Africa | Medium term (2-4 years) |
| RF-Interference Issues Limiting Field-Deployable Units | -0.4% | Global, acute in urban/industrial areas | Short term (≤ 2 years) |
| Semiconductor Supply Constraints for Ultra-Fast ASICs | -0.3% | Global, concentrated in Asia supply chains | Medium term (2-4 years) |
| Source: Mordor Intelligence | |||
Capital-Intensive Transition from Analog to High-Res Digital Counters
High-performance digital frequency meters can cost 2–3 times more than analog units, and organizations must budget for staff retraining and dual-running of legacy equipment during cut-over periods. This upfront burden slows adoption across small laboratories and factories, trimming 0.7 percentage points from the CAGR of the frequency meter market.
RF-Interference Issues Limiting Field-Deployable Units
Industrial sites and densely populated cities exhibit transient electromagnetic bursts that can desensitize portable counters. LTE-A and 5G-NR link studies reveal notable throughput losses from 2.2 GHz interference, demonstrating the measurement challenges engineers face on site. Vendors must invest in advanced shielding and adaptive algorithms, which elevate production costs.
*Our forecasts treat driver/restraint impacts as directional, not additive. The impact forecasts reflect baseline growth, mix effects, and variable interactions.
Segment Analysis
By Type: Digital Dominance Accelerates Analog Displacement
Digital instruments registered 66.74% of the frequency meter market in 2025 and will expand at 6.11% CAGR through 2031. Rising demand for automated data logging, remote diagnostics, and software-defined calibration cements their position, while analog variants persist mainly for low-budget visual readout tasks. Integrated FFT engines, AI-driven anomaly detection, and SCPI APIs help digital counters interface seamlessly with enterprise resource planning systems. The frequency meter market size for digital devices is forecast to rise from USD 5.39 billion in 2025 to USD 7.69 billion by 2031, underscoring their outsized influence. Analog units lose momentum as procurement teams prioritize accuracy repeatability and network-based firmware upgrade support. Even so, analog meters remain viable in harsh environments where their mechanical robustness offsets lower resolution.
Cost parity inches closer as silicon integration shrinks bill-of-material counts, encouraging price-sensitive laboratories to migrate. Vendors also embed real-time self-calibration using oven-controlled crystal references, cutting annual recalibration trips by up to 40% and widening the digital value proposition. Predictive maintenance modules notify users when jitter trends exceed thresholds, minimizing unplanned downtime for production test lines. Consequently, the frequency meter market continues its structural pivot toward digital, reinforcing supplier R&D around high-resolution time-interval analysis and open-source driver support.


By Frequency Range: High-Frequency Segment Drives Innovation
Medium-band products (100 kHz–1 GHz) held 53.05% of the frequency meter market share in 2025, reflecting backbone use in cellular base-station verification and industrial electronics. Nevertheless, counters above 1 GHz chart the fastest 6.94% CAGR thanks to mmWave infrastructure, satellite backhaul, and emerging terahertz imaging. The frequency meter market size for high-band instruments climbs alongside 6G R&D, reaching an expected USD 2.63 billion in 2031. Vendors now integrate direct-sampling front-ends clocked at 110 GS/s to minimize down-conversion errors, a breakthrough useful for frequency agile radar evaluation and quantum photonics.
Low-frequency (< 100 kHz) models satisfy power-system and transformer diagnostics, enjoying stable volume but limited growth. Meanwhile, mid-band products secure recurring revenue from audio analyzers, motor-drive testers, and digital-predistortion verification in 4G/5G infrastructure. High-frequency innovation spills back into the mid-band through firmware upgrades, allowing a single hardware platform to span 100 kHz–20 GHz via plug-in heads, cutting lifetime ownership costs. Enterprises thus rationalize fleets around multi-band chassis, pushing the frequency meter market toward modular ecosystems.
By Application: Calibration and Metrology Gains Momentum
Signal testing and analysis applications represented 36.42% of 2025 demand, riding on constant telecom network tuning and electronic product compliance. Yet calibration and metrology sees the steepest 6.28% CAGR as regulators enforce tighter uncertainty budgets in medical, aerospace, and energy devices. Laboratories invest in counters offering ±5 ppb accuracy and auto-traceable calibration certificates generated through digital signatures. The resulting frequency meter market size within calibration circles is projected to hit USD 1.22 billion by 2031.
Oscillator monitoring, including oven-controlled and rubidium references, continues to require low-phase-noise counters for factory characterization. Research & development gains support from quantum-bit validation and photonic integrated-circuit testing. Cloud-based calibration services reduce logistic overhead, and Six Sigma-based diagnostics for transformer windings create fresh industrial use cases. Together these forces ensure sustained demand diversity across the frequency meter market.
By End-Use Industry: Automotive Electrification Transforms Demand
Telecommunications retained 41.12% revenue in 2025 and remains the anchor vertical. However, the automotive and e-mobility segment logs a 7.62% CAGR through 2031 as global EV output accelerates. Wide-bandgap inverters, onboard chargers, and battery swapping stations must comply with strict EMC norms, prompting OEMs to specify counters with 500 MS/s capability and 0.01 ppm stability. The frequency meter market responds with regenerative test benches that recycle energy during 800 V drive-cycle simulations.
Aerospace and defense uphold steady expenditure through spectrum-dominance projects, whereas consumer electronics drive volume for mid-range counters during high-speed USB-C and HDMI certification. Industrial automation adopts Industry 4.0 solutions, embedding frequency monitoring in predictive-maintenance dashboards. The cumulative effect sustains multi-industry resilience across the frequency meter market, sheltering suppliers from cyclic slowdowns in any single sector.
Geography Analysis
Asia-Pacific held 33.48% of 2025 revenue and grows at 6.18% CAGR on the back of record 5G base-station densification, EV volume leadership, and concentrated semiconductor foundry investment. China’s dual-credit policy elevates EV market penetration beyond 40%, demanding continuous frequency diagnosis of high-power traction inverters. India’s Production-Linked Incentive scheme accelerates telecommunications equipment fabrication, requiring mid-band counters for RF factory tests. Japanese and South Korean fabs adopt sub-3 nm process nodes, purchasing ultra-fast time-interval analyzers. Regional universities commit to 6G research, widening adoption of counters above 100 GHz, further driving the frequency meter market.
Europe contributes steady demand anchored in grid modernization and automotive innovation. The EUR 584 billion grid plan injects capital into frequency sensing at distribution substations, and Germany’s engineering base specifies precision metrology for EV drivetrain validation. Nordic operators deploy 26 GHz point-to-point links and terahertz feasibility pilots, pushing local uptake of high-frequency counters. Aerospace primes in France and the United Kingdom integrate frequency agile radar test sets, supporting a solid foothold for the frequency meter market.
North America retains a large installed base in defense, semiconductor, and photonics research. U.S. Quantum Information Science initiatives allocate multi-billion funding for cryogenic probe stations requiring hertz-level stability at microwave bands. The United States Air Force aims to shorten spectrum-certification cycles, purchasing wide-band counters with automated signal-classification software. Canada’s EV battery corridor and Mexico’s growth as an automotive export hub add further frequency test demand. The cumulative 2026-2031 CAGR in North America reaches 5.29%, slightly below APAC but on a larger revenue base, reinforcing the global balance of the frequency meter market.

Competitive Landscape
The frequency meter market is moderately concentrated, with Keysight Technologies, Rohde & Schwarz, Tektronix, and Anritsu controlling a combined share approaching 55%. Continuous platform refreshes, firmware-delivered feature unlocks, and service-level guarantees underpin competitive stickiness. Keysight’s 1.6 T optical transceiver oscilloscope release extends bandwidth to 240 Gbps per lane, complementing its high-frequency counter lineage and locking in datacenter customers. Rohde & Schwarz positions its MXO series oscilloscopes and THz synthesizers for 6G research, pairing them with frequency counters offering 0.3 fs time-base jitter.
Tektronix fortified its power-electronics footprint by acquiring Elektro-Automatik, embedding bidirectional DC sources with real-time frequency analysis to serve EV drivetrains. Emerson’s earlier purchase of National Instruments broadens system-level integration capabilities, though NI’s frequency counter portfolio remains intact within PXI test racks. Smaller vendors target niche segments such as portable interference-hardened meters for field surveillance or calibration-free modules for embedded IoT devices.
Technology differentiation increasingly rests on AI-assisted trigger engines, open-protocol cloud APIs, and dual-GNSS disciplined oscillators that deliver hold-over below 10 ns for 24 hours. Suppliers file patents on machine-learning-based waveform classification, spectrum-sharing conflict detection, and thermo-optic stabilization in photonic front-ends. Partnerships between instrument makers and chipset vendors accelerate conformance test bundle rollouts, with joint application notes easing customer validation tasks. This mix of innovation, selective consolidation, and ecosystem collaboration keeps the frequency meter market dynamic yet disciplined.
Frequency Meter Industry Leaders
-
Keysight Technologies, Inc.
-
Tektronix, Inc.
-
Rohde & Schwarz GmbH & Co. KG
-
Fluke Corporation
-
National Instruments Corporation
- *Disclaimer: Major Players sorted in no particular order

Recent Industry Developments
- March 2025: Keysight Technologies introduced DCA-M sampling oscilloscopes for 1.6 T optical transceiver testing, offering < 15 µW optical noise and < 90 fs intrinsic jitter, aimed at AI datacenter interconnects.
- December 2024: SEMI projected global semiconductor equipment sales hitting USD 139 billion by 2026, with 13.8% test-equipment growth in 2024, reinforcing frequency counter demand.
- September 2024: Rohde & Schwarz unveiled a photonics-based tunable THz system enabling carriers beyond 500 GHz, funded by Germany’s Federal Ministry of Education and Research.
- June 2024: Rohde & Schwarz and VIAVI Solutions expanded joint offerings for Open RAN radio-unit compliance using the R&S SMW200A vector generator and TM500 testers.


Global Frequency Meter Market Report Scope
The frequency meter market refers to the industry focused on the production and supply of instruments used to measure the frequency of oscillating signals in various applications. These devices are critical in sectors such as telecommunications, electronics, aerospace, and energy for precise frequency testing and monitoring. The market is driven by advancements in communication technologies, industrial automation, and the growing demand for high-accuracy measurement tools.
The Frequency Meter Market is segmented by type (analog frequency meters, digital frequency meters), frequency range (low-frequency meters, medium frequency meters, high-frequency meters)application (signal testing, oscillator monitoring, system calibration, research & development, other applications), end-use industry (telecommunications, automotive, aerospace & defense, electronics, industrial, other end-use industry), and Geography (North America, Europe, Asia Pacific, Latin America, and Middle East and Africa). The market sizes and forecasts are provided in terms of value (USD) for all the above segments.
| Analog Frequency Meters |
| Digital Frequency Meters |
| Low-Frequency (Less than 100 kHz) |
| Medium-Frequency (100 kHz-1 GHz) |
| High-Frequency (Above 1 GHz) |
| Signal Testing and Analysis |
| Oscillator and Synthesizer Monitoring |
| Calibration and Metrology |
| Research and Development |
| Telecommunications |
| Automotive and E-Mobility |
| Aerospace and Defense |
| Consumer and Industrial Electronics |
| Manufacturing and Process Industries |
| North America | United States | |
| Canada | ||
| Mexico | ||
| Europe | Germany | |
| United Kingdom | ||
| France | ||
| Nordics | ||
| Rest of Europe | ||
| South America | Brazil | |
| Rest of South America | ||
| Asia-Pacific | China | |
| Japan | ||
| India | ||
| South-East Asia | ||
| Rest of Asia-Pacific | ||
| Middle East and Africa | Middle East | Gulf Cooperation Council Countries |
| Turkey | ||
| Rest of Middle East | ||
| Africa | South Africa | |
| Rest of Africa | ||
| By Type | Analog Frequency Meters | ||
| Digital Frequency Meters | |||
| By Frequency Range | Low-Frequency (Less than 100 kHz) | ||
| Medium-Frequency (100 kHz-1 GHz) | |||
| High-Frequency (Above 1 GHz) | |||
| By Application | Signal Testing and Analysis | ||
| Oscillator and Synthesizer Monitoring | |||
| Calibration and Metrology | |||
| Research and Development | |||
| By End-Use Industry | Telecommunications | ||
| Automotive and E-Mobility | |||
| Aerospace and Defense | |||
| Consumer and Industrial Electronics | |||
| Manufacturing and Process Industries | |||
| By Geography | North America | United States | |
| Canada | |||
| Mexico | |||
| Europe | Germany | ||
| United Kingdom | |||
| France | |||
| Nordics | |||
| Rest of Europe | |||
| South America | Brazil | ||
| Rest of South America | |||
| Asia-Pacific | China | ||
| Japan | |||
| India | |||
| South-East Asia | |||
| Rest of Asia-Pacific | |||
| Middle East and Africa | Middle East | Gulf Cooperation Council Countries | |
| Turkey | |||
| Rest of Middle East | |||
| Africa | South Africa | ||
| Rest of Africa | |||


Key Questions Answered in the Report
What is the current value of the frequency meter market?
USD 8.54 billion in 2026, and projected to reach USD 11.37 billion by 2031 at a 5.89% CAGR during 2026-2031.
Which product type is growing fastest?
High-frequency (> 1 GHz) digital frequency meters grow at 6.94% CAGR, driven by 5G mmWave and early 6G test needs
Why is Asia-Pacific dominant in frequency meter sales?
High 5G base-station density, EV manufacturing leadership, and concentrated semiconductor fabs together give Asia-Pacific 33.48% revenue share and a 6.18% regional CAGR.
How do smart-grid investments influence demand?
European and North American grid modernization programs require continuous frequency monitoring, adding an estimated +1.2 percentage points to overall market CAGR.
What challenges could slow market growth?
Upfront cost of digital counters, limited calibration labs in South America, RF-interference for portable units, and ongoing semiconductor supply constraints exert downward pressure on adoption rates.
Which companies lead the frequency meter market?
Keysight Technologies, Rohde & Schwarz, Tektronix, and Anritsu collectively control about 55% of global revenue, supported by continuous product innovation and strategic acquisitions.
Page last updated on:


