Optical Spectrum Analyzer (OSA) Market Size and Share
Market Overview
| Study Period | 2020 - 2031 |
|---|---|
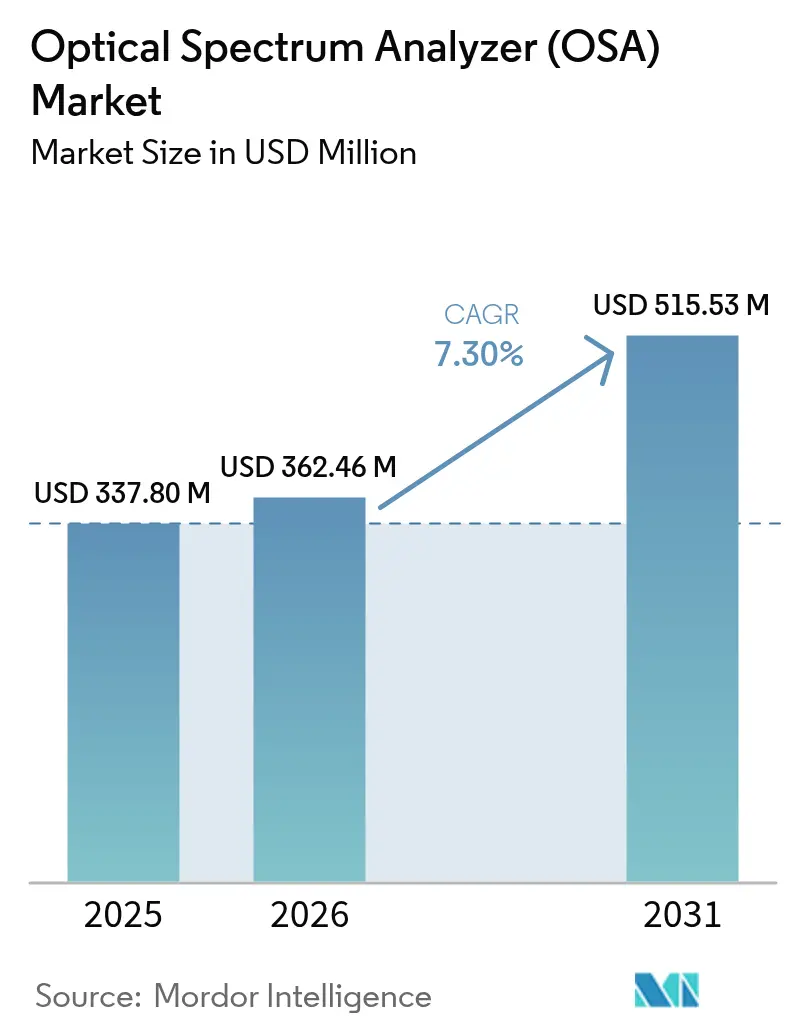
| Market Size (2026) | USD 362.46 Million |
| Market Size (2031) | USD 515.53 Million |
| Growth Rate (2026 - 2031) | 7.30% CAGR |
| Fastest Growing Market | Asia Pacific |
| Largest Market | North America |
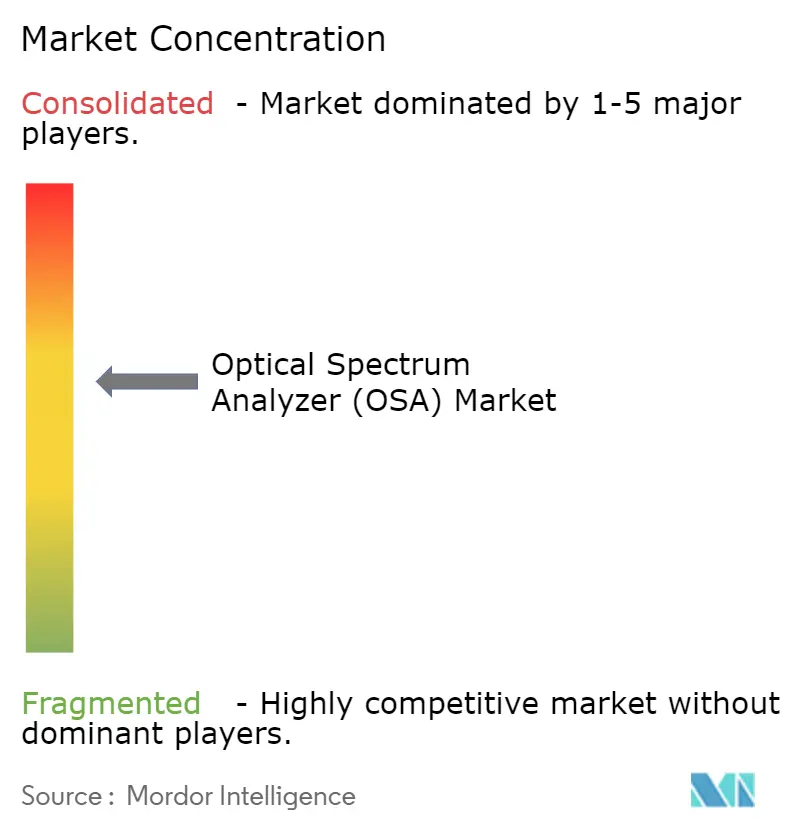
| Market Concentration | Medium |
Major Players
*Disclaimer: Major Players sorted in no particular order Image © Mordor Intelligence. Reuse requires attribution under CC BY 4.0. |
|
Optical Spectrum Analyzer (OSA) Market Analysis by Mordor Intelligence
The optical spectrum analyzer market size is expected to grow from USD 337.8 million in 2025 to USD 362.46 million in 2026 and is forecast to reach USD 515.53 million by 2031 at 7.30% CAGR over 2026-2031. Uptake is accelerating as operators roll out 400 G and 800 G coherent links, data-center owners push toward tighter spectral margins, and 5G backhaul shifts to dense wavelength division multiplexing (DWDM). Field engineers now expect laboratory-grade resolution in the field, which is spurring rapid advances in miniaturization. Supply-chain volatility around gallium and germanium continues to squeeze component lead times, yet stricter optical-layer compliance rules in the United States and the European Union are compelling fresh test-equipment investment. Research funding in quantum optics and silicon photonics is widening the application base, encouraging vendors to blend high precision with AI-assisted analytics.
Key Report Takeaways
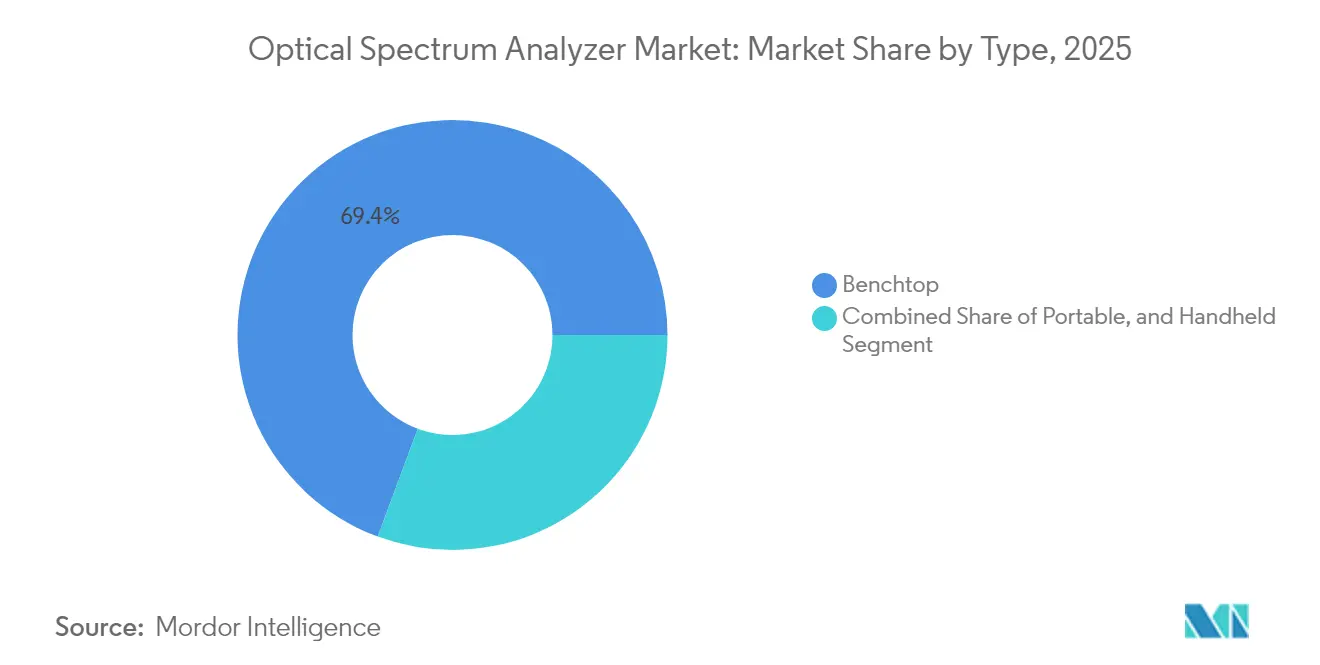
- By type, benchtop instruments led with 69.35% of the optical spectrum analyzer market share in 2025; the handheld segment is projected to expand at a 10.05% CAGR to 2031.
- By mode, spectrometer units held 64.40% revenue in 2025, while wavelength-meter units show the fastest growth at a 8.95% CAGR through 2031.
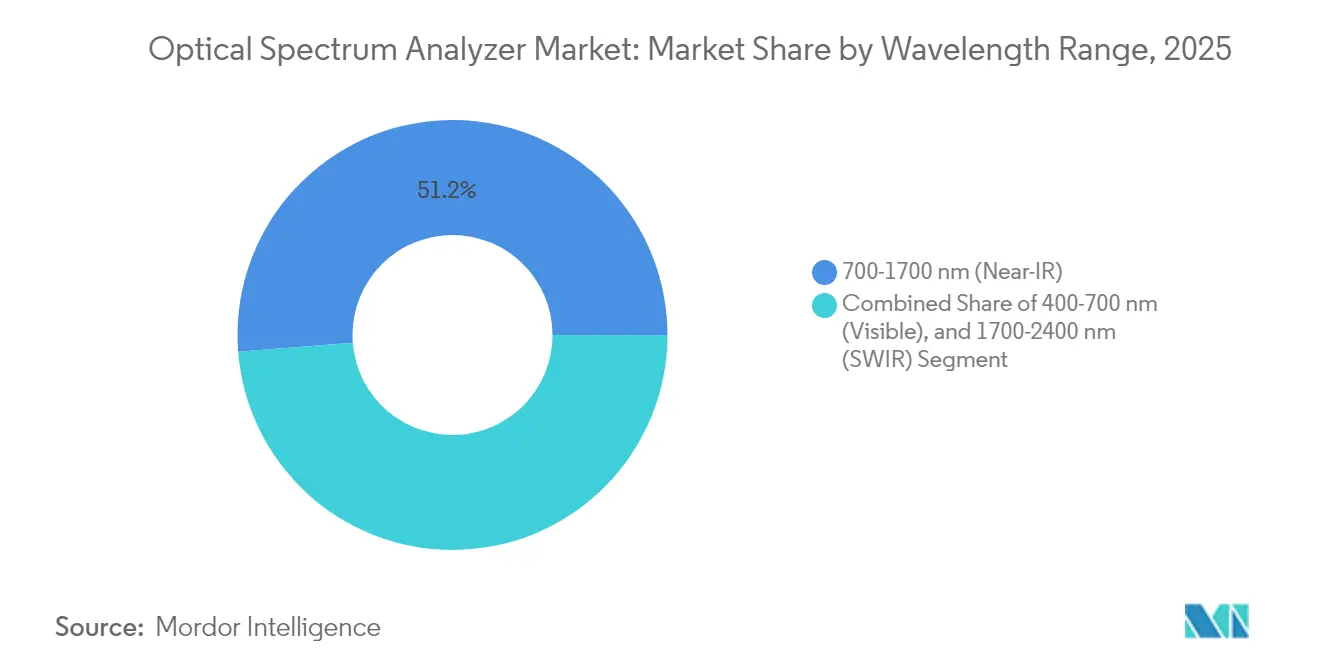
- By wavelength range, Near-IR (700-1700 nm) captured 51.25% of the optical spectrum analyzer market size in 2025; the SWIR range is forecast to grow at 9.15% annually to 2031.
- By end-user, telecommunications operators and OEMs held 45.30% share of the optical spectrum analyzer market size in 2025, whereas healthcare instrumentation is advancing at an 8.58% CAGR.
- By geography, North America led with 32.70% of the optical spectrum analyzer market share in 2025; Asia Pacific records the quickest regional CAGR at 8.78% through 2031.
Note: Market size and forecast figures in this report are generated using Mordor Intelligence’s proprietary estimation framework, updated with the latest available data and insights as of 2026.
Global Optical Spectrum Analyzer (OSA) Market Trends and Insights
Drivers Impact Analysis*
| Driver | (~) % Impact on CAGR Forecast | Geographic Relevance | Impact Timeline |
|---|---|---|---|
| Expansion of 400/800 G Coherent Optical Networks | +1.5% | North America, Europe, Asia Pacific | Medium term (2-4 years) |
| Roll-out of 5G/6G Fronthaul & Backhaul DWDM Links | +1.8% | Global, with early gains in Asia Pacific | Short term (≤ 2 years) |
| Miniaturisation Enabling Field-Deployable OSAs | +1.1% | Global | Medium term (2-4 years) |
| Silicon Photonics & Quantum Optics R&D Funding Upsurge | +0.7% | North America, Europe | Long term (≥ 4 years) |
| Mandatory Optical-Layer Compliance in Data-Centre Transceivers (US and EU) | +1.1% | North America, Europe | Short term (≤ 2 years) |
| Source: Mordor Intelligence | |||
Expansion of 400/800 G Coherent Optical Networks
Installations of 400 G and 800 G coherent ports are rising sharply as cloud operators extend datacenter-interconnect footprints. Cignal AI expects 400 G pluggable port deployments to peak in 2026, followed by 800 G adoption.[1]Lightwave Staff, “RETN Conducts Large-Scale 400GbE Coherent Pluggable Optics Build,” Lightwave, lightwaveonline.comThese higher-order modulation formats require sub-picometer resolution and low polarization-dependent loss, driving renewed demand for high-accuracy OSAs. Vendors are embedding faster coherent receivers, automated dispersion-compensation analytics, and broader sweep bandwidths to keep pace. As networks migrate toward 1.6 T interfaces, continuous-sweep instruments with real-time digital signal processing (DSP) become indispensable for validating optical signal-to-noise ratio (OSNR) under tighter channel spacing.
Roll-out of 5G/6G Fronthaul & Backhaul DWDM Links
DWDM now underpins 5G fronthaul in dense urban clusters, and early 6G field trials already demand channel granularity below 50 GHz. Research predicts mobile backhaul and fronthaul revenue to reach USD 56.34 billion by 2030, implying unprecedented optical-testing volume.[2].Fayad, Abdulhalim, Tibor Cinkler, and Jacek Rak."Toward 6G Optical Fronthaul: A Survey on Enabling Technologies and Research Perspectives."arxiv.orgOSAs calibrated for 1550 nm C-band channels are being supplemented with extended-range units that cover 1310 nm P2P fiber and free-space optics feeds. Operators favor handheld designs that integrate remote cloud dashboards, enabling immediate spectral snapshots during tower turn-ups. The optical spectrum analyzer market is seeing increased bundling with passive optical network (PON) power meters, creating one-stop diagnostic kits.
Miniaturisation Enabling Field-Deployable OSAs
Microelectromechanical systems (MEMS) gratings, compact diode-laser arrays, and computational spectrometry algorithms are shrinking instrument footprints without sacrificing fidelity. Solid-state devices that once filled half a rack now slip into a technician’s vest pocket, maintaining 0.05 nm resolution in harsh outdoor conditions onlinelibrary.wiley.com. Battery-operated units with multi-hour runtime enable continuous monitoring of long-haul links, reducing truck rolls. Portable analyzers are increasingly coupled with AI-based anomaly detection, automatically flagging out-of-spec power ripple or filter drift. These enhancements support the optical spectrum analyzer market as fiber build-outs penetrate rural zones where bench instruments are impractical.
Silicon Photonics and Quantum Optics R&D Funding Upsurge
Government programs, led by a USD 998 million allocation under the National Quantum Initiative for FY 2025, are accelerating work on integrated photonics and quantum key distribution.[3]National Quantum Initiative. "NQI-Annual-Report-FY2025.pdf." quantum.govResearchers need OSAs that measure faint entangled-photon signatures and broad-bandwidth photonic-integrated circuits (PICs). Innovations such as wideband vector spectrum analyzers deliver 55.1 THz windows with 471 kHz frequency resolution, enabling complete characterization of on-chip modulators. This fusion of quantum-grade sensitivity and telecom-grade robustness is extending the optical spectrum analyzer market into defense sensing, secure communications, and ultrafast computing.
Restraints Impact Analysis*
| Restraint | (~) % Impact on CAGR Forecast | Geographic Relevance | Impact Timeline |
|---|---|---|---|
| High Capital & Calibration Cost of Sub-pm Resolution OSAs | -0.7% | Global, with higher impact in emerging markets | Short term (≤ 2 years) |
| Performance Limits of Handheld Units for Coherent Systems | -0.4% | Global | Medium term (2-4 years) |
| Alternative Real-time Spectrum Monitoring (SWI-based) Solutions | -1.1% | North America, Europe | Medium term (2-4 years) |
| Tariff-Driven Photonic Component Supply-Chain Volatility | -0.7% | Global, with higher impact in Asia Pacific | Short term (≤ 2 years) |
| Source: Mordor Intelligence | |||
High capital and calibration cost of sub-pm resolution OSAs
Sub-picometer instruments often exceed USD 100,000 per unit and demand periodic factory calibration to maintain ±0.03 nm absolute accuracy. These recurring expenses deter smaller labs and network operators in price-sensitive regions. EXFO notes that maintaining ±0.5 dB power accuracy typically requires specialist recalibration services. Vendors are experimenting with subscription-based calibration programs and modular optics cartridges to lower ownership cost, yet adoption remains constrained among cost-conscious buyers, tempering growth in segments below 100 GHz channel spacing.
Alternative real-time spectrum monitoring (software-defined) solutions
DSP-based optical channel monitors (OCMs) and in-band telemetry embedded in modern coherent transceivers provide continuous OSNR feedback without discrete test gear. Lightwave reports that OCM firmware upgrades can now resolve ±0.1 nm drift within line cards. While these embedded tools lack the full dynamic range of an OSA, they satisfy many in-service monitoring tasks. As operators strive for lower opex, software-only telemetry could squeeze the optical spectrum analyzer market on routine maintenance tasks, restricting demand to complex troubleshooting and R&D.
*Our forecasts treat driver/restraint impacts as directional, not additive. The impact forecasts reflect baseline growth, mix effects, and variable interactions.
Segment Analysis
By Type: Handheld Instruments Move from Niche to Mainstream
Benchtop units contributed to 69.35% of total revenue, in 2025, thanks to unmatched dynamic range and sweep resolution. High-end coherent network rollouts continue to rely on these laboratory-grade platforms for pre-deployment characterization and manufacturing QC. Yet the handheld segment is expanding at a 10.05% CAGR, nearly three percentage points above the overall optical spectrum analyzer market. The optical spectrum analyzer market size for handheld models is forecast to register a CAGR of 10,05%, propelled by MEMS-based gratings and GPU-accelerated signal reconstruction.
Portable designs integrate cloud-native dashboards, Wi-Fi backhaul, and AI-powered event annotation, letting field technicians upload traces directly into trouble-ticket systems. Computational spectrometers using pattern-encoded apertures now achieve 0.1 nm resolution in chassis weighing under 1 kg.Vendors also push hybrid “portable-bench” instruments delivering benchtop-level accuracy in a rugged case, widening mid-tier adoption. These shifts indicate a long-run balancing act between resolution, budget, and mobility across the optical spectrum analyzer market.


By Mode Type: Wavelength Accuracy Gains Priority
Spectrometer mode generated 64.40% of revenue, because it delivers a full view of power spectral density across C- and L-bands. As DWDM channel counts rise, engineers increasingly pair spectrometer sweeps with real-time wavelength-meter snapshots to catch drift under load. Wavelength-meter products, now growing at 8.95% annually, combine stabilized Fabry-Pérot references with fast photodiode arrays, producing ±0.01 nm accuracy within 200 ms.
Optical channel turn-up often begins with a wavelength-meter check before deeper spectrometer analysis, a workflow that is fostering dual-mode instruments. Keysight’s recent tester embeds both measurement paths, adding AI-driven pass-fail analytics that trim certification time. The optical spectrum analyzer industry is likely to see further convergence, as algorithmic techniques compensate for missing detector elements, compressing cost while maintaining precision.
By Wavelength Range: SWIR and Mid-IR Applications Expand
The 700-1700 nm Near-IR band, core to telecom C-band operation, held 51.25% of revenue. Growth stays healthy as carriers migrate to 400 G ZR optics and data-center operators refresh transceiver fleets. Nevertheless, emerging environmental, medical, and industrial use cases are lifting demand in the 1700-2400 nm SWIR band. Yokogawa’s AQ6377E extends coverage to 3200 nm, meeting gas-sensing requirements. The optical spectrum analyzer market size for SWIR-capable units is predicted to register a 9.15% CAGR.
Advances in silicon-nitride waveguide amplifiers now provide 330 nm continuous-wave gain, enabling broadband sources that straddle NIR and SWIR regions. Instruments must therefore calibrate both InGaAs and extended-InGaAs detectors, supporting wider sweep ranges in a single enclosure. Cross-band flexibility improves laboratory ROI and shortens prototype cycles for next-generation sensors. The visible band remains niche but vital for display metrology and fluorescence studies, keeping tri-band modularity on vendor roadmaps.
By End-user Industry: Healthcare Tests Extend Beyond Ophthalmology
Telecommunications operators and optical OEMs retained 45.30% of revenue in 2025, as OSAs remain indispensable for line qualification, chromatic-dispersion mapping, and filter validation. Yet healthcare and life-science laboratories register the highest expansion, growing 8.58% yearly. Optical coherence tomography (OCT), Raman spectroscopy, and photodynamic therapy all require precise spectral control, drawing upon compact, high-sensitivity OSAs. A recent OCT design using an NVIDIA Jetson Nano achieved fivefold processing gains while cutting system size by two-thirds, highlighting the crossover between medical devices and edge computing.
Industrial quality-control lines adopt OSAs for in-process monitoring of fiber-laser welding and additive manufacturing, whereas aerospace programs deploy them for LIDAR calibration under vibration stress. Academic laboratories remain a cradle of innovation, evidenced by PIC-testing breakthroughs in quantum transceivers backed by the National Quantum Initiative. Collectively these forces diversify the optical spectrum analyzer market, cushioning it against single-sector downturns.
Geography Analysis
North America contributed 32.70% of revenue in 2025, anchored by dense hyperscale datacenter clusters and federally backed quantum-research hubs. Regulatory mandates that embed optical-layer compliance in 800 G transceivers reinforce procurement momentum, while Ciena’s 8192 coherent router launch further stimulates demand for inline spectral verification. Regional manufacturers also benefit from reshoring incentives designed to de-risk component supply.
Asia Pacific shows the fastest trajectory, advancing at an 8.78% CAGR to 2031. Massive 5G rollouts, rising photonic-chip foundry capacity, and national programs such as “Made in China 2025” are propelling local spending on high-precision test gear. The optical spectrum analyzer market size for Asia Pacific is projected to grow rapidly by 2031 as carriers densify backhaul networks and universities escalate PIC research.
Europe maintains strong standing through concerted R&D funding, eco-design regulations, and integrated photonics clusters in the Netherlands and Germany. Strict carbon-reduction goals push operators to adopt energy-efficient coherent optics, a move that requires meticulous spectral balancing during deployment. Momentum also builds in the Middle East, Africa, and South America, where greenfield fiber projects leapfrog older copper infrastructure. While spending is smaller, high initial equipment orders accompany each network phase, expanding the global optical spectrum analyzer market footprint.


Competitive Landscape
Five suppliers-Yokogawa, Keysight, VIAVI, EXFO, and Anritsu-account for roughly 65% of worldwide revenue, confirming a moderately concentrated field. Barriers stem from patented diffraction-grating designs, proprietary detector arrays, and long-validated calibration chains. Benchtop units in the sub-picometer class remain dominated by Japanese and U.S. incumbents, while Chinese and European challengers target handheld niches with aggressive pricing.
Strategic focus centers on layered differentiation. Yokogawa advances coherence-tracking algorithms, VIAVI tunes OSAs to pair with its optical channel monitors, and Keysight blends AI to automate pass-fail logic. Teradyne’s 2025 purchase of Quantifi Photonics adds grating-based technology that stretches to 5.5 µm, widening access to mid-IR measurement. Meanwhile, Anritsu co-develops 5G testing suites with Tier-1 operators, embedding OSA options into transport analyzers.
Emerging technologies threaten to realign positioning. Vector spectrum analyzers covering 55 THz with sub-MHz resolution present a leap in bandwidth, potentially unseating legacy scanning techniques. Also, modular plug-ins that snap into cloud-linked handheld frames promise recurring subscription revenue. Alliance building between instrument makers and PIC fabs is intensifying, aiming to deliver factory-calibrated wafers bundled with test micro-APIs. As a result, the optical spectrum analyzer market shows fertile ground for both incremental refinements and disruptive form factors.
Optical Spectrum Analyzer (OSA) Industry Leaders
-
Yokogawa Test & Measurement Corporation
-
Thorlabs Inc.
-
VIAVI Solutions
-
EXFO Inc.
-
Anritsu Corporation
- *Disclaimer: Major Players sorted in no particular order

Recent Industry Developments
- April 2025: Yokogawa released the AQ6380 OSA with extended dynamic range.
- April 2025: Anritsu debuted the MS9740B OSA offering faster sweep speeds.
- March 2025: Teradyne acquired Quantifi Photonics, adding a grating-based OSA platform with 5.5 µm reach.
- March 2025: Ciena unveiled the 8192 coherent router with integrated WaveLogic 6 Nano 800 G optics, raising demand for high-bandwidth OSAs.
- March 2025: Coherent Corp. launched pluggable transceivers optimized for AI data-center networks.
- February 2025: Keysight launched a portable OSA featuring secure cloud analytics for immediate field trace sharing.
- February 2025: EXFO introduced the FTB-5240S/BP OSA featuring Pol-Mux OSNR measurement compliant with IEC 61282-12 and ITU-T G.697.
- January 2025: Thorlabs purchased Praevium Research to bolster tunable VCSEL design for precision spectroscopy .


Research Methodology Framework and Report Scope
Market Definitions and Key Coverage
Our study defines the optical spectrum analyzer (OSA) market as revenue generated from purpose-built instruments, benchtop, portable, and handheld, designed to display optical power distribution across 400 nm to roughly 2,400 nm, whether sold as stand-alone units or integrated test modules.
Install-base service contracts, software-only post-processing tools, and multifunction RF plus optical platforms are outside the numerical baseline.
Segmentation Overview
-
By Type
- Portable
- Handheld
- Benchtop
-
By Mode Type
- Spectrometer Mode
- Wavelength Meter Mode
-
By Wavelength Range
- 400-700 nm (Visible)
- 700-1700 nm (Near-IR)
- 1700-2400 nm (SWIR)
-
By End-user Industry
- Telecommunication Operators and OEMs
- Healthcare and Life-Sciences Instrumentation
- Consumer Electronics and Photonics Devices
- Industrial and Manufacturing QA/QC
- Aerospace and Defence Optoelectronics
- Academic and Government Research Labs
-
By Geography
-
North America
- United States
- Canada
- Mexico
-
Europe
- Germany
- United Kingdom
- France
- Italy
- Spain
- Rest of Europe
-
Asia-Pacific
- China
- Japan
- South Korea
- India
- South East Asia
- Rest of Asia-Pacific
-
South America
- Brazil
- Rest of South America
-
Middle East and Africa
-
Middle East
- United Arab Emirates
- Saudi Arabia
- Rest of Middle East
-
Africa
- South Africa
- Rest of Africa
-
Middle East
-
North America
Detailed Research Methodology and Data Validation
Primary Research
Mordor analysts conducted interviews with optical design engineers at telecom operators, instrumentation product managers, calibration-lab owners, and photonics professors across North America, Europe, and Asia. These conversations clarified typical replacement cycles, field-deployment preferences, and emerging wavelength-range demands, letting us refine model assumptions and fill data voids surfaced during desk work.
Desk Research
We began with trade data and shipment statistics from sources such as UN Comtrade, China Customs, and the U.S. International Trade Commission, which help our team map export flows of HS codes covering optical test equipment. Industry-specific associations, including the Optical Fiber Communication Conference (OFC) digest and the European Photonics Industry Consortium, offered peer-reviewed papers on emerging 800 G coherent links that set reference growth rates. Government telecom regulators, notably the FCC and Japan's MIC, provided 5 G/6 G backbone rollout timelines that anchor demand inflection points. Company 10-Ks and product catalogs supplied average selling price ranges, while D&B Hoovers and Dow Jones Factiva filled financial gaps for privately held vendors. This list is illustrative; many additional secondary sources were reviewed for context and validation.
Market-Sizing & Forecasting
A top-down demand pool was first built from global fiber-kilometer additions and coherent-channel upgrades, then multiplied by OSA penetration ratios by form factor. Select bottom-up checks, supplier revenue roll-ups and sampled ASP times unit volumes, were layered to calibrate totals. Key variables in the model include: 1) annual 400/800 G port shipments, 2) new 5Gmid-haul DWDM nodes, 3) average calibration interval in months, 4) benchtop-to-handheld ASP spread, and 5) funded silicon-photonics R&D projects. A multivariate regression with lagged telecom capex indicators underpins the 2025-2030 forecast, while scenario analysis adjusts for price erosion or rapid miniaturization shocks.
Data Validation & Update Cycle
Outputs pass three stages, algorithmic variance scans, senior analyst peer review, and final reconciliation against customs values and vendor filings. Our models refresh each year, with interim updates triggered by material events such as a major technology node shift or a merger announcement.
Why Mordor's Optical Spectrum Analyzer Baseline Commands Confidence
Published estimates often diverge because firms pick different product mixes, price stacks, and update cadences. We acknowledge these gaps upfront and then detail how a disciplined scope definition plus dual-path modeling keeps our figure dependable for planners.
Key gap drivers include rivals focusing only on telecom-grade benchtop units, counting OEM embedded modules as stand-alone revenue, or projecting price erosion linearly without cross-checking against R&D cost floors. Faster refreshes by Mordor, annual, versus biennial cycles elsewhere also widen deltas in high-velocity segments.
Benchmark comparison
| Market Size | Anonymized source | Primary gap driver |
|---|---|---|
| USD 337.8 Mn | Mordor Intelligence | - |
| USD 378.0 Mn | Global Consultancy A | excludes handheld testers; narrower geographic cut |
| USD 436.5 Mn | Industry Association B | applies uniform ASP, ignores premium IR models |
| USD 549.4 Mn | Regional Consultancy C | bundles OEM modules and broader fiber test sets |
In sum, aligning the right scope, validating with practitioners, and updating briskly allow Mordor Intelligence to offer a balanced, transparent baseline that decision-makers can trace back to clear variables and repeatable steps.


Key Questions Answered in the Report
What is driving the current growth of the optical spectrum analyzer market?
Strong deployment of 400 G / 800 G coherent links, 5G backhaul densification, and stricter optical-layer compliance standards are pushing up demand for precise spectral measurement tools.
How large will the optical spectrum analyzer market be in 2031?
The optical spectrum analyzer market size is projected to hit USD 515.53 million by 2031, up from USD 362.46 million in 2026.
Which product type is expanding the fastest?
Handheld analyzers, aided by MEMS gratings and computational spectrometry, are forecast to grow at a 10.05% CAGR between 2026 and 2031.
Why are healthcare applications gaining traction?
Optical coherence tomography, advanced imaging, and spectroscopic diagnostics require compact, high-sensitivity OSAs, propelling an 8.58% CAGR in healthcare demand.
What regional market is growing the quickest?
Asia Pacific leads with an 8.78% CAGR through 2031, fueled by large-scale 5G rollouts and rising photonic-chip manufacturing capacity.
Are software-based monitors replacing traditional OSAs?
Embedded optical channel monitors handle routine in-service checks, yet high-resolution OSAs remain essential for coherent-system troubleshooting, R&D, and regulatory compliance.
Page last updated on:


