Organic Peroxide Market Size and Share
Market Overview
| Study Period | 2020 - 2031 |
|---|---|
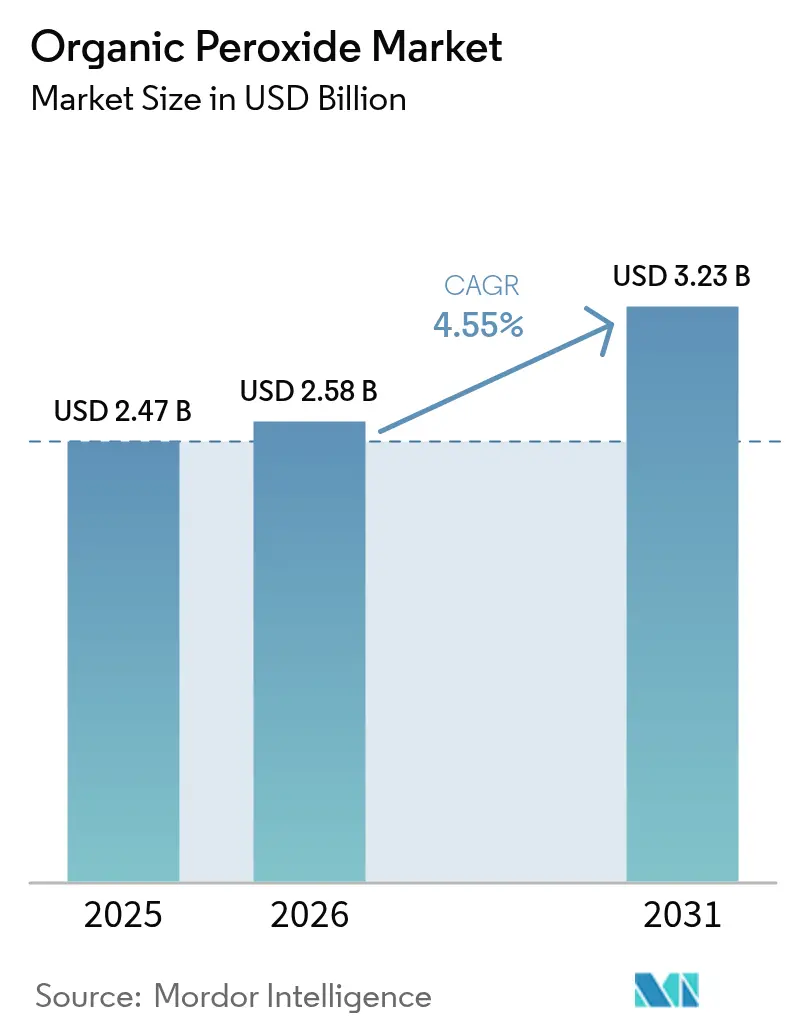
| Market Size (2026) | USD 2.58 Billion |
| Market Size (2031) | USD 3.23 Billion |
| Growth Rate (2026 - 2031) | 4.55% CAGR |
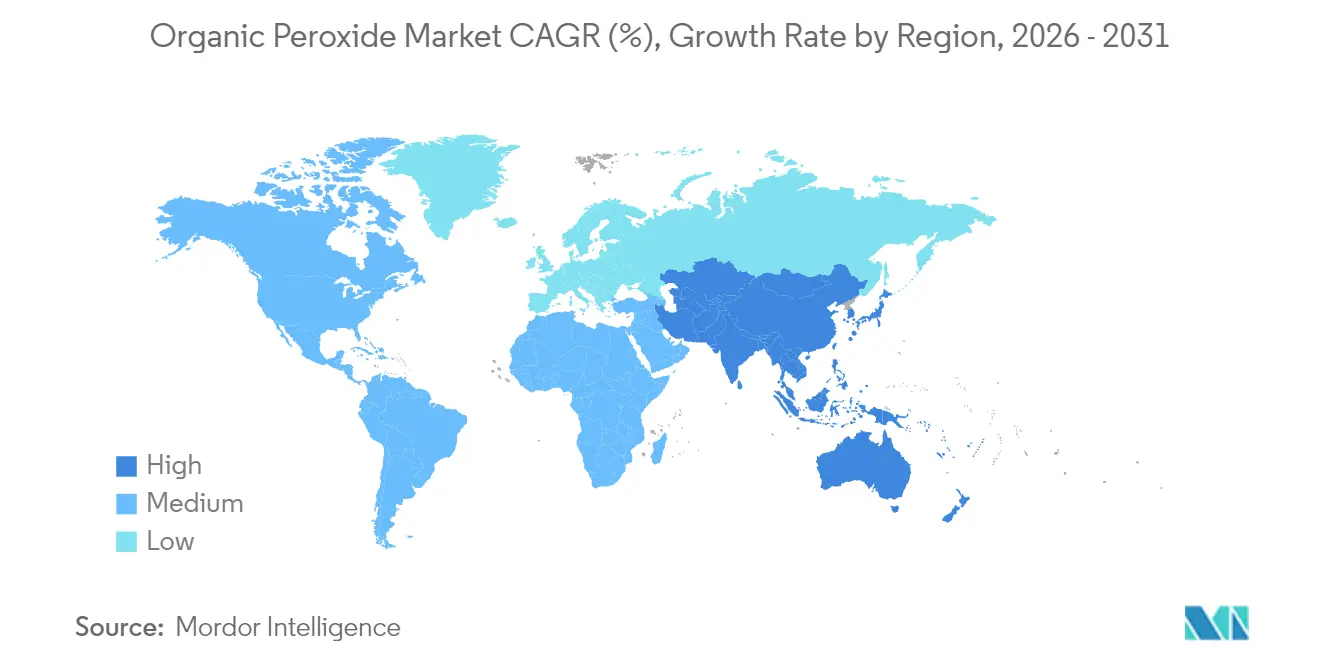
| Fastest Growing Market | Asia Pacific |
| Largest Market | Asia Pacific |
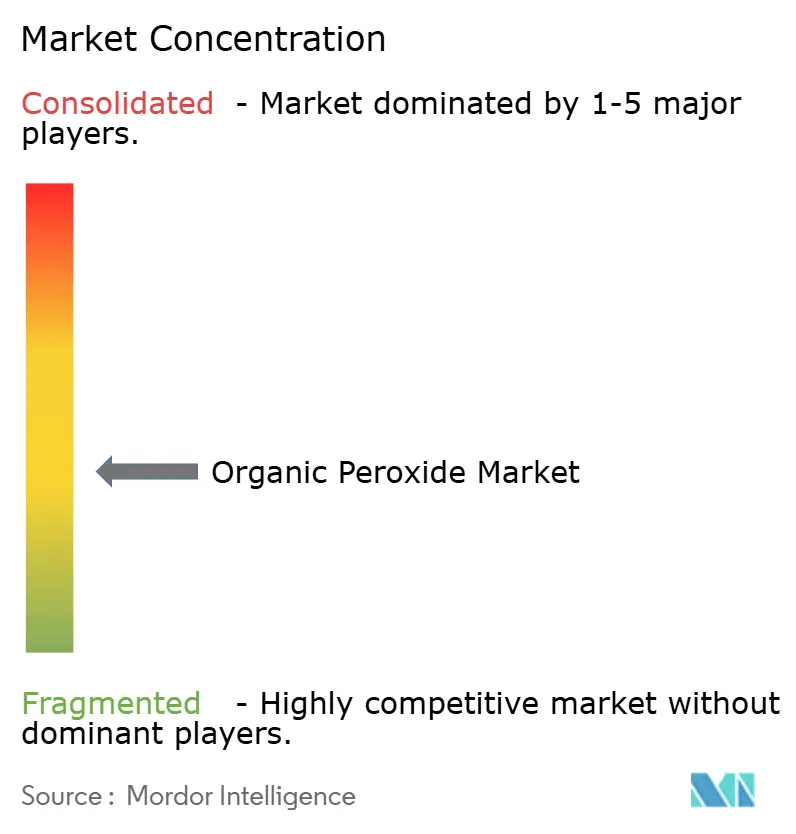
| Market Concentration | Medium |
Major Players *Disclaimer: Major Players sorted in no particular order Image © Mordor Intelligence. Reuse requires attribution under CC BY 4.0. | |
Organic Peroxide Market Analysis by Mordor Intelligence
The Organic Peroxide market size is expected to grow from USD 2.47 billion in 2025 to USD 2.58 billion in 2026 and is forecast to reach USD 3.23 billion by 2031 at 4.55% CAGR over 2026-2031. The rising use of advanced polyethylene and polypropylene grades, rapid uptake of EVA solar encapsulants, and the shift toward VOC-free powder coating systems underpin demand growth. Producers are scaling capacity in Asia Pacific to serve polymer and composites customers that require tight specification control, while safety-focused paste and emulsion formats gain wider acceptance. At the same time, volatile feedstock pricing and higher insurance premiums for storage facilities continue to pressure margins, steering manufacturers toward renewable feedstocks and safer handling solutions. Asia Pacific anchors both volume and incremental demand, followed by steady but more specialized growth in North America and Europe, where sustainability regulations accelerate product substitution.
Key Report Takeaways
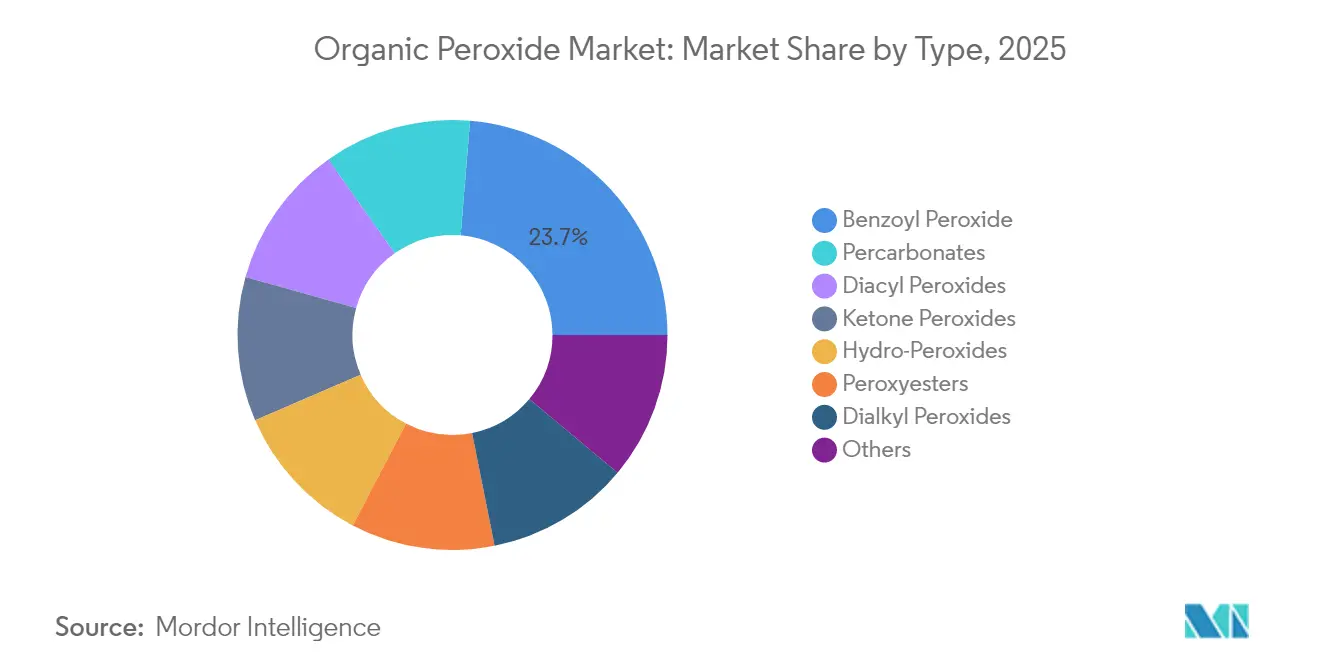
- By type, benzoyl peroxide led with a 23.70% revenue share in 2025; percarbonates are projected to grow at a 4.68% CAGR to 2031.
- By function, polymerization initiators accounted for 64.45% of the organic peroxide market size in 2025, while the same segment records the highest projected CAGR at 5.14% between 2026-2031.
- By form, liquid grades held 59.55% share of the organic peroxide market size in 2025; paste/emulsion formats are set to expand at a 5.41% CAGR to 2031.
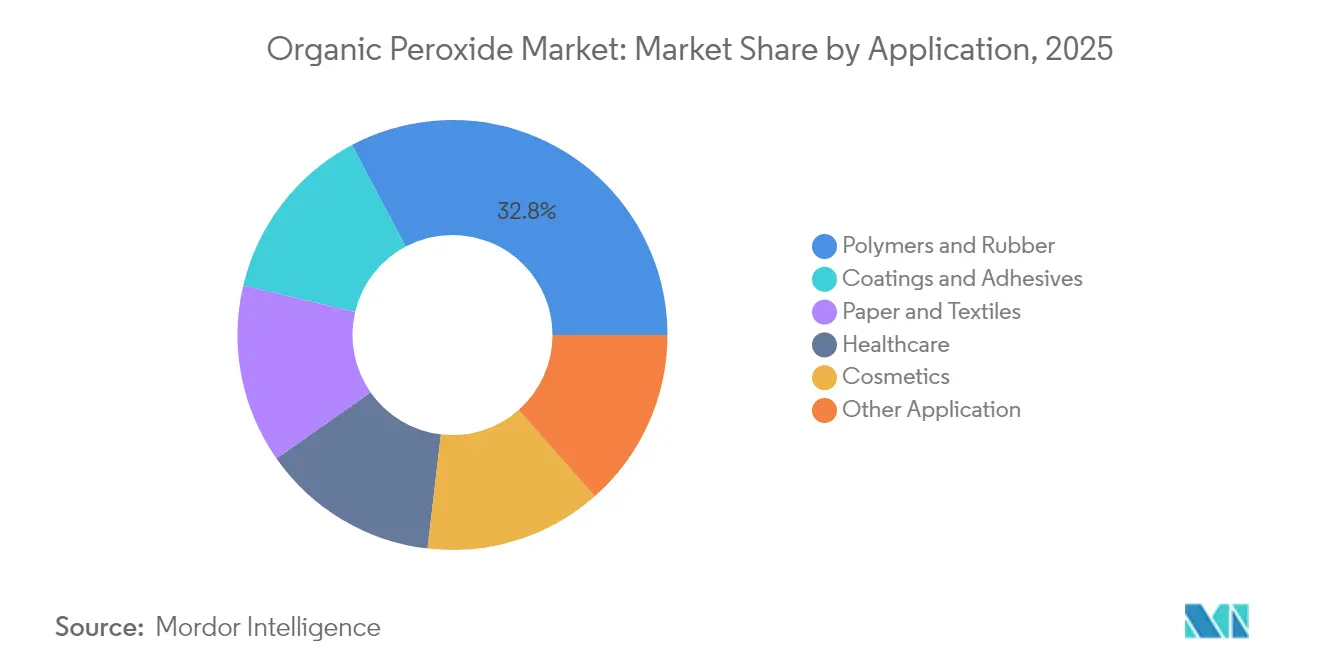
- By application, polymers and rubber commanded 32.75% of the organic peroxide market share in 2025 and are advancing at a 4.55% CAGR through 2031.
- By geography, Asia Pacific captured 38.85% of the organic peroxide market share in 2025 and is forecast to rise at a 4.83% CAGR through 2031.
Note: Market size and forecast figures in this report are generated using Mordor Intelligence’s proprietary estimation framework, updated with the latest available data and insights as of 2026.
Global Organic Peroxide Market Trends and Insights
Driver Impact Analysis*
| Drivers | (~) % Impact on CAGR Forecast | Geographic Relevance | Impact Timeline |
|---|---|---|---|
| Shift toward advanced PE and PP grades | +1.2% | Asia Pacific, Europe | Medium term (2-4 years) |
| Adoption in EVA solar encapsulants | +0.8% | China, Europe, Global | Short term (≤ 2 years) |
| Growth of VOC-free powder coatings | +0.7% | Europe, North America | Medium term (2-4 years) |
| Automotive lightweighting composites | +1.0% | Europe, North America, Global | Medium term (2-4 years) |
| Utilization in coating applications | +0.6% | Global | Short term (≤2 yrs) |
| Source: Mordor Intelligence | |||
Shift Toward Advanced PE and PP Grades
Rising requirements for controlled rheology polypropylene and high-melt-strength PP in packaging and automotive parts lift organic peroxide consumption across Asia Pacific. LyondellBasell raised recycled and renewable-based polymer output by 65% in 2024 to more than 200,000 t, with a target of 2 million t annually by 2030, increasing the need for organic peroxides that fine-tune molecular weight and branching. Processors report an 18% jump in PP processing efficiency when dicumyl peroxide is applied as a chain breaker, while branched PP made with Perkadox and Trigonox® grades delivers 30% better foam properties. As regional resin producers expand specialty capacity, the organic peroxide market gains a stable demand base.
Adoption of Organic Peroxides in EVA Solar Encapsulants
Fast-growing photovoltaic installations rely on EVA encapsulation sheets cross-linked with peroxides such as Luperox TBEC to reach gel contents above 75%, thereby enhancing module durability. China dominates EVA sheet output, and European module makers are also upgrading to higher-purity peroxide systems to curb power loss. These trends translate into steady incremental volumes for the organic peroxide market in the near term, especially for high-pressure polymerization grades that offer narrow decomposition profiles.
Growth of VOC-Free Powder Coatings in Europe
Bio-based UV-curable powder coatings that replace solvent-borne systems are gathering pace under tightening emission rules. New binder chemistries, including bio-alkyd and poly(limonene carbonate) resins, cure at lower oven temperatures and leverage peroxide initiators to build robust networks. As coaters pivot to energy-efficient processes, peroxide producers benefit from new, differentiated demand beyond traditional thermosets.
Automotive Lightweighting Drives Composite Applications
OEMs reinforce bumpers, pillars, and interior panels with fiber-reinforced plastics that require peroxide curing to achieve fast cycle times and superior mechanical properties. Studies show that dicumyl peroxide and 2,5-dimethyl-2,5-di(tert-butyl-peroxy)hexane raise composite tensile strength and modulus by up to 30%. As electric-vehicle platforms proliferate, demand for peroxide-cured composites supports robust growth across Europe and North America.
Restraint Impact Analysis*
| Restraints | (~) % Impact on CAGR Forecast | Geographic Relevance | Impact Timeline |
|---|---|---|---|
| Rising insurance premiums for storage | -0.5% | Europe, Global spillover | Short term (≤ 2 years) |
| Feedstock supply tightness | -0.8% | Asia, Global | Short term (≤ 2 years) |
| Rising cost of inhibitors for transit | -0.3% | Global, particularly affecting international trade routes | Medium term (≈3-4 yrs) |
| Source: Mordor Intelligence | |||
Insurance Premiums for Storage Facilities
Implementation of the revised ADR framework on 1 January 2025 elevates classification and inspection rigor for organic peroxide warehousing. European underwriters have lifted premiums for large-volume sites, raising operating costs and delaying expansion projects[1]United Nations UNECE, “ADR 2025 Framework,” unece.org. Producers are responding by optimizing inventory levels and investing in smaller satellite depots, yet higher fixed costs constrain margin expansion for the organic peroxide market.
Feedstock Supply Tightness
Prices for propylene oxide, a key precursor, slid 17% between October 2024 and May 2025 amid new capacity startups but weak downstream demand, increasing cost volatility for certain peroxide families. Concurrently, logistics bottlenecks in Asia limit raw-material availability, prompting sporadic production curtailments. This imbalance lifts inventory risk and tempers near-term growth expectations for the organic peroxide market.
*Our forecasts treat driver/restraint impacts as directional, not additive. The impact forecasts reflect baseline growth, mix effects, and variable interactions.
Segment Analysis
By Type: Benzoyl Peroxide Holds Lead as Percarbonates Gain Steam
Benzoyl peroxide retained a 23.70% revenue share of the organic peroxide market in 2025, reflecting its dual usage in polymer initiation and topical dermatology. Industrial grade volumes dominate because free-radical polymerization remains a high-throughput route for styrenics and acrylics. Nevertheless, concerns over benzene contamination in certain consumer products have raised scrutiny, spurring product reformulation.
Percarbonates, propelled by eco-friendly credentials and broad cleaning-agent appeal, are the fastest-growing sub-segment at a 4.68% CAGR. Commercialization of percarbonate-based advanced oxidation processes for wastewater remediation broadens the customer mix and supports future share gains.


By Function: Polymerization Initiators Dominate, Cross-Linkers Follow
Polymerization initiators captured 64.45% of the organic peroxide market share in 2025 and are forecast to post a 5.14% CAGR to 2031. High throughput LDPE and PP facilities favor well-characterized initiators such as tert-butyl peroxy-2-ethylhexanoate owing to predictable decomposition kinetics. Cross-linking agents are the next-largest category, used in wire-and-cable jacketing, foam insulation, and composite parts that need dimensional stability at elevated temperatures. Curing and hardening agents, though smaller in volume, gain importance in advanced resin chemistries for 3D printing and high-pressure RTM composites.
By Form: Liquids Lead, Paste/Emulsion Formats Accelerate
Liquid grades held 59.55% of the organic peroxide market in 2025 thanks to simple pumping, quick dissolution, and broad compatibility with continuous polymer reactors. Nonetheless, paste and emulsion forms represent the fastest-growing category at 5.41% CAGR because they mitigate shipping and handling hazards. Nouryon’s Perkadox 16-40XPS illustrates how pumpable pastes reduce worker exposure and deliver uniform dispersion in bulk polyester resin formulations.
Growth in pultrusion, filament winding, and closed-mold composite processes accentuates demand for low-volatility pastes that allow precise metering at ambient temperatures. Liquid products will retain relevance in high-volume polymerization, but regulatory momentum favoring safer transport categories gives paste and emulsion suppliers a strategic opening to expand their share in the organic peroxide market.
By Application: Polymers and Rubber Remain Cornerstone of Demand
Polymer and rubber processing accounted for 32.75% of the organic peroxide market size in 2025 and is projected to grow at 4.55% through 2031. Cross-linking of thermoplastics with dicumyl peroxide is widely adopted to improve heat resistance in piping and cable insulation. Coatings and adhesives form the second-largest application group, where UV-curable formulations and powder coatings benefit from low-temperature peroxide initiators compatible with bio-based resins. Healthcare volumes, mostly benzoyl peroxide acne treatments, remain steady but could be influenced by ongoing toxicology reviews
Geography Analysis
Asia Pacific held 38.85% of the organic peroxide market in 2025 and is growing at a 4.83% CAGR, supported by robust downstream plastics and elastomer capacity additions. China dominates regional demand, and Nouryon’s November 2024 expansion in Ningbo doubled the output of Perkadox 14 and Trigonox 101 to 6,000 tons, underscoring local appetite for controlled rheology modifiers.
North America is characterized by mature but value-added demand in automotive composites, healthcare, and high-purity semiconductor polymers. Producers emphasize safer formulations, and several have introduced emulsion-based initiators that align with stricter Department of Transportation guidelines on bulk peroxide transport.
Europe trails closely, with growth driven by environmental legislation that restricts VOC emissions and mandates safer carriage of dangerous goods. The ADR update, effective in 2025, imposes tighter storage segregation and training requirements, increasing operating costs but encouraging the adoption of paste and polymer-bound forms.

Competitive Landscape
The organic peroxide market is moderately fragmented, with Nouryon, Arkema, United Initiators, and NOF Corporation holding a meaningful combined share. These players emphasize capacity builds in high-growth geographies. Strategic priorities center on safer, more sustainable formulations. Leading suppliers commercialize water-based emulsions and pumpable pastes that meet stricter transport classifications while improving dosing accuracy.
Organic Peroxide Industry Leaders
Nouryon
Arkema
NOF CORPORATION
PERGAN GmbH
United Initiators GmbH
- *Disclaimer: Major Players sorted in no particular order

Recent Industry Developments
- November 2024: Nouryon completed a significant capacity expansion for organic peroxides at its Ningbo, China facility, doubling production to 6,000 t for Perkadox 14 and Trigonox 101 brands
- September 2023: Arkema expanded its organic peroxides site in China to meet growing demand in the region, strengthening its position in the Asian market.


Global Organic Peroxide Market Report Scope
Organic peroxides are derivatives of hydrogen peroxide. Organic peroxides are generally used to initiate a process called polymerization, which creates plastic polymers. The organic peroxide market is segmented by type, application, and geography. By type, the market is segmented into diacyl peroxides, ketone peroxides, percarbonates, benzoyl peroxide, dialkyl peroxides, hydro-peroxides, Peroxyester, and other types. By application, the market is segmented into polymers and rubber, coatings and adhesives, paper and textiles, cosmetics, healthcare, and other applications. The report also covers the market size and forecasts for the organic peroxide market in 16 countries across major regions. For each segment, the market sizing and forecasts have been done based on revenue (USD million).
| Diacyl Peroxides |
| Dialkyl Peroxides |
| Ketone Peroxides |
| Hydro-Peroxides |
| Percarbonates |
| Benzoyl Peroxide |
| Peroxyesters |
| Others |
| Polymerization Initiators |
| Cross-Linking Agents |
| Curing/Hardening Agents |
| Liquid |
| Solid |
| Paste/Emulsion |
| Polymers and Rubber |
| Coatings and Adhesives |
| Paper and Textiles |
| Cosmetics |
| Healthcare |
| Other Application |
| Asia-Pacific | China |
| India | |
| Japan | |
| South Korea | |
| ASEAN | |
| Rest of Asia-Pacific | |
| North America | United States |
| Canada | |
| Mexico | |
| Europe | Germany |
| United Kingdom | |
| France | |
| Italy | |
| Spain | |
| Nordics | |
| Rest of Europe | |
| South America | Brazil |
| Argentina | |
| Rest of South America | |
| Middle-East and Africa | Saudi Arabia |
| South Africa | |
| Rest of Middle-East and Africa |
| By Type | Diacyl Peroxides | |
| Dialkyl Peroxides | ||
| Ketone Peroxides | ||
| Hydro-Peroxides | ||
| Percarbonates | ||
| Benzoyl Peroxide | ||
| Peroxyesters | ||
| Others | ||
| By Function | Polymerization Initiators | |
| Cross-Linking Agents | ||
| Curing/Hardening Agents | ||
| By Form | Liquid | |
| Solid | ||
| Paste/Emulsion | ||
| By Application | Polymers and Rubber | |
| Coatings and Adhesives | ||
| Paper and Textiles | ||
| Cosmetics | ||
| Healthcare | ||
| Other Application | ||
| By Geography | Asia-Pacific | China |
| India | ||
| Japan | ||
| South Korea | ||
| ASEAN | ||
| Rest of Asia-Pacific | ||
| North America | United States | |
| Canada | ||
| Mexico | ||
| Europe | Germany | |
| United Kingdom | ||
| France | ||
| Italy | ||
| Spain | ||
| Nordics | ||
| Rest of Europe | ||
| South America | Brazil | |
| Argentina | ||
| Rest of South America | ||
| Middle-East and Africa | Saudi Arabia | |
| South Africa | ||
| Rest of Middle-East and Africa | ||


Key Questions Answered in the Report
What is driving growth in the organic peroxide market?
Steady expansion of advanced polyolefin production, rising use of composites in automotive lightweighting, and the need for high-performance solar encapsulants underpin demand.
Which region holds the largest organic peroxide market share?
Asia Pacific leads owing to substantial polymer manufacturing capacity and ongoing investments in local peroxide plants.
Why are paste and emulsion peroxide formulations gaining popularity?
They offer improved storage stability and lower handling hazards, aligning with stricter global safety regulations.
How do organic peroxides support sustainability goals?
They enable recycling-friendly polymer modification, facilitate low-VOC coatings, and assist in wastewater treatment via advanced oxidation processes.
What challenges does the organic peroxide industry face?
Feedstock price volatility, rising insurance premiums for hazardous-chemical storage in Europe, and evolving safety standards increase cost and compliance complexity.
What is the current size of the organic peroxide market?
The Organic Peroxide Market size is estimated at USD 2.58 billion in 2026, and is expected to reach USD 3.23 billion by 2031, at a CAGR of 4.55% during the forecast period (2026-2031).
Page last updated on:


