Hydrogen Peroxide Market Size and Share
Market Overview
| Study Period | 2021 - 2031 |
|---|---|
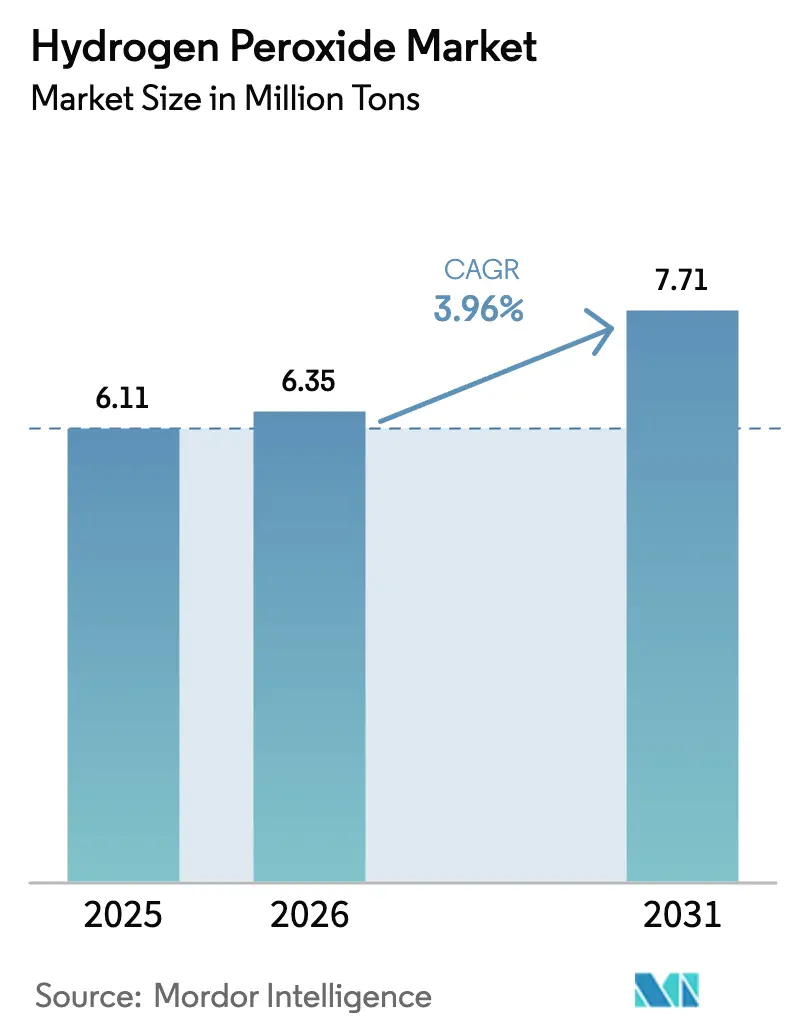
| Market Volume (2026) | 6.35 Million tons |
| Market Volume (2031) | 7.71 Million tons |
| Growth Rate (2026 - 2031) | 3.96% CAGR |
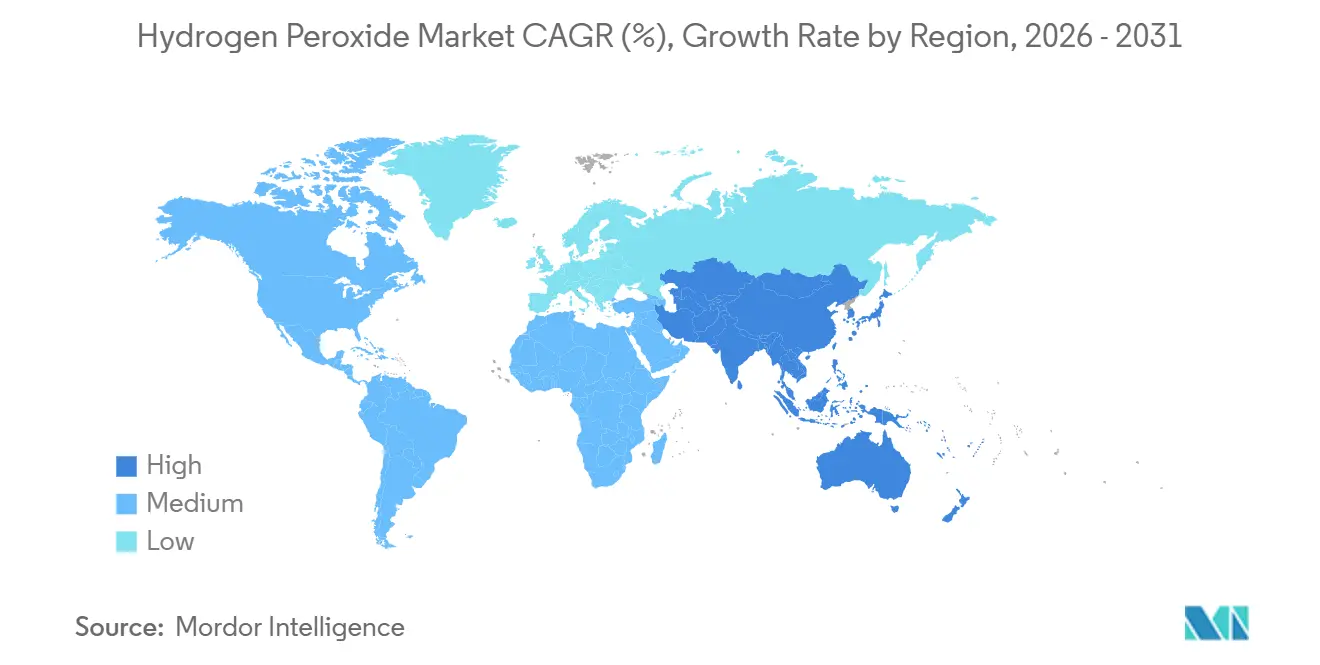
| Fastest Growing Market | Asia Pacific |
| Largest Market | Asia Pacific |
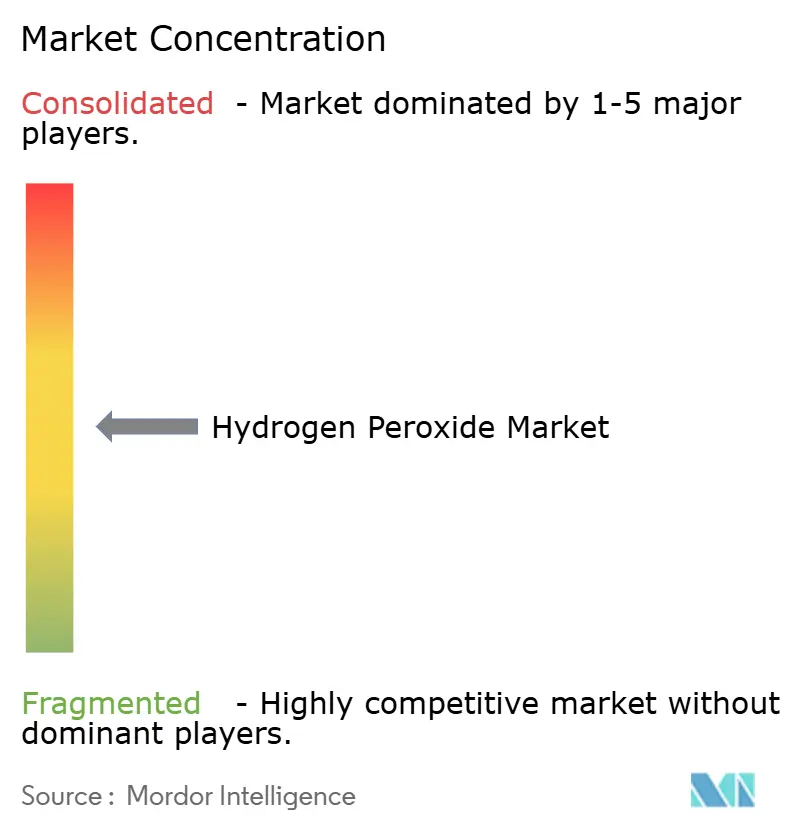
| Market Concentration | Medium |
Major Players
*Disclaimer: Major Players sorted in no particular order Image © Mordor Intelligence. Reuse requires attribution under CC BY 4.0. |
|
Hydrogen Peroxide Market Analysis by Mordor Intelligence
The Hydrogen Peroxide Market size is expected to increase from 6.11 Million tons in 2025 to 6.35 Million tons in 2026 and reach 7.71 Million tons by 2031, growing at a CAGR of 3.96% over 2026-2031. Momentum rests on four structural themes. First, semiconductor clean-room demand for ultra-high-purity grades commands price premiums that more than triple commodity bleaching prices, lifting average margins even as volume grows slowly. Second, on-site electro-oxidation systems allow water utilities to avoid hauling hazardous drums, cutting delivered cost by up to 30% and widening the hydrogen peroxide market into mid-tier municipalities. Third, hospitals are locking vaporized hydrogen-peroxide (VHP) devices into infection-control protocols, embedding predictable daily consumption. Fourth, producers able to validate low-carbon feedstocks secure premiums of 15%–20% from pulp mills and consumer-goods brands pursuing net-zero roadmaps. These shifts sit alongside legacy bleaching, which still supplies most tonnage but now grows below the market average because recycled fiber and enzyme pretreatments reduce dosage needs. Competitive intensity is moderate: five global suppliers control a little over 40% of capacity, yet more than 400 regional plants in Asia compete on freight advantage and low overhead.
Key Report Takeaways
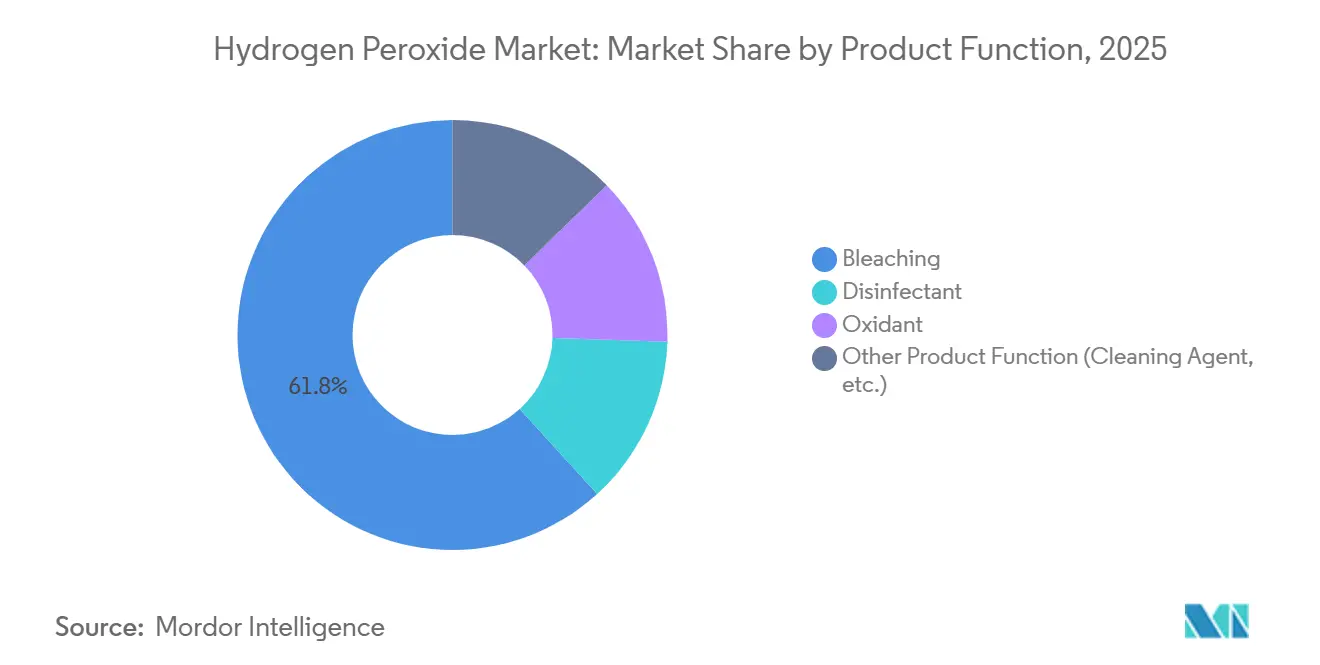
- By product function, bleaching led with 61.76% volume share in 2025, while disinfectants are forecast to expand at a 4.44% CAGR to 2031.
- By grade, the industrial segment held 42.27% of the hydrogen peroxide market share in 2025, while high-purity grades are advancing at a 5.31% CAGR through 2031.
- By concentration/form, aqueous solutions commanded 79.95% share of the hydrogen peroxide market size in 2025; powder and granular adducts are expected to rise at a 4.38% CAGR to 2031.
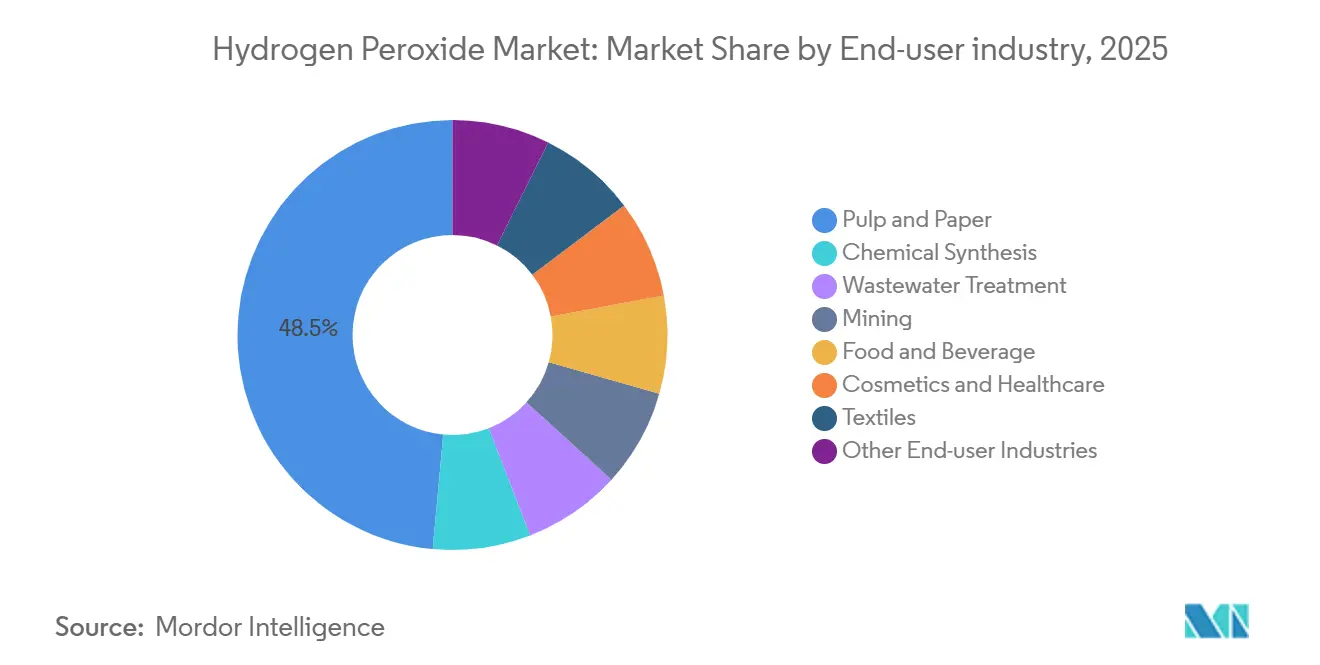
- By end-user industry, pulp and paper accounted for 48.54% share of the hydrogen peroxide market size in 2025, whereas wastewater treatment is growing the fastest at 4.29% CAGR.
- By geography, Asia-Pacific dominated with a 52.28% share of the hydrogen peroxide market in 2025 and is progressing at a 4.33% CAGR through 2031.
Note: Market size and forecast figures in this report are generated using Mordor Intelligence’s proprietary estimation framework, updated with the latest available data and insights as of January 2026.
Global Hydrogen Peroxide Market Trends and Insights
Drivers Impact Analysis*
| Driver | (~) % Impact on CAGR Forecast | Geographic Relevance | Impact Timeline |
|---|---|---|---|
| Surging ultra-high-purity H₂O₂ demand in sub-5 nm semiconductor fabs | +0.80% | Asia-Pacific (Taiwan, South Korea, Japan), spill-over to North America (Arizona, Texas) | Medium term (2-4 years) |
| Sharp rise in onsite electro-oxidation systems for decentralized wastewater treatment | +0.60% | Global, with early adoption in water-stressed APAC (India, Middle East) and EU municipalities | Short term (≤ 2 years) |
| Capacity expansion of recycled-fiber pulp mills in SE-Asia | +0.70% | Southeast Asia core (Indonesia, Vietnam, Thailand), spill-over to Malaysia | Medium term (2-4 years) |
| Growth of HPPO (hydrogen-peroxide-to-propylene-oxide) plants in Europe and China | +0.50% | China (Shandong, Jiangsu, Henan), Europe (Germany, Netherlands), North America (US Gulf Coast) | Medium term (2-4 years) |
| Healthcare infection-control mandates boosting VHP sterilization equipment sales | +0.50% | North America, Europe, Asia-Pacific hospital networks | Short term (≤ 2 years) |
| Low-carbon H₂O₂ routes (renewable H₂ and PEM electrolysis) gaining ESG premiums | +0.40% | Nordic countries, Germany, Netherlands; pilot projects in Australia | Long term (≥ 4 years) |
| Source: Mordor Intelligence | |||


Surging Ultra-High-Purity H₂O₂ Demand In Sub-5 nm Semiconductor Fabs
Leading chipmakers have tightened metal limits to below 10 parts-per-trillion for wafer cleaning, a ten-fold reduction from 7 nm nodes. Solvay doubled electronic-grade output at Zhenjiang in 2025 to meet this bar, while Mitsubishi Gas Chemical expanded in Japan to serve new lines in Arizona and Texas[1]Solvay, “High-Purity Hydrogen Peroxide Capacity Expansion in Zhenjiang,” solvay.com. Spot prices above USD 2.50 per kilogram, three times bleaching-grade levels, more than offset the niche’s sub-3% volume share. Evonik’s Leshan joint venture will come on stream in 2026, adding 30 kilotons of specialty capacity and securing the firm majority ownership for know-how control. Trade-tension risks linger because extreme-ultraviolet tool export restrictions could stall fabs outside Northeast Asia, concentrating demand geographically and raising supply-chain exposure. Suppliers that meet ISO 14644 Class 1 clean-room protocols enjoy switching-cost protection that discourages late entrants.
Sharp Rise In On-Site Electro-Oxidation For Decentralized Wastewater Treatment
Containerized units that make hydrogen peroxide from air and water at the treatment plant reduce transport risk and shorten supply chains. BASF put a 54 MW proton-exchange-membrane electrolyzer online in 2025 at Ludwigshafen, using green hydrogen for pilot advanced-oxidation reactors serving German industrial parks[2]BASF, “Launch of 54 MW Electrolyzer at Ludwigshafen,” basf.com. In India, textile clusters adopted the technology after the pollution regulator set micropollutant limits in 2025. Delivered cost falls 20%–30% when haulage exceeds 500 km, yet the capital of about USD 1.5 million for a 100 m³ h⁻¹ skid limits uptake to cities above 50,000 people. Electro-oxidation degrades pharmaceuticals, PFAS, and dye molecules that conventional biology cannot, giving operators a route to meet tighter discharge standards without major civil works.
Healthcare Infection-Control Mandates Boosting VHP Sterilization
The U.S. FDA formalized VHP room disinfection guidance in 2024, and the European Medicines Agency followed in 2025, translating clinical best practice into mandatory policy. Each 500-bed hospital now consumes 1.5–2.5 kilograms of 35% peroxide daily when protocols run continuously. Nouryon launched Eka HP Puroxide in 2025, offering a 40% lower carbon footprint and targeting hospital purchasers under Scope 3 pressure. Asian hospital construction, which will add 1.2 million beds between 2026 and 2030, embeds VHP piping at the design phase, locking demand for two decades. ISO 14937 validation requirements raise switching costs, making hydrogen peroxide the incumbent chemistry in terminal disinfection.
Low-Carbon H₂O₂ Routes Attracting ESG Premiums
Evonik partnered with VoltH2 in 2025 to install a 50 MW electrolyzer in the Netherlands, aiming for a product with carbon intensity below 0.5 kg CO₂-e kg⁻¹ and willing buyers paying 15%–20% premiums. The conventional anthraquinone route emits 1.8–2.2 kg CO₂-e kg⁻¹ owing to coal-tar feedstock and steam usage. Nordic tissue producers already hold offtake contracts for low-carbon grades, while Australia’s Hydrogen Headstart program offers production credits that could feed exports to Asia after 2028. Proton-exchange-membrane units cost roughly double alkaline cells per kilowatt but ramp faster, capturing negatively priced wind power during oversupply. Early adopters enjoy brand benefits and may pre-empt pending carbon-border taxes on high-emission imports.
Restraints Impact Analysis*
| Restraint | (~) % Impact on CAGR Forecast | Geographic Relevance | Impact Timeline |
|---|---|---|---|
| EU "explosives-precursor" tightening lifts distribution costs for >35% grades | -0.30% | Europe (EU27 + UK), cascading to Middle East and North Africa importers | Short term (≤ 2 years) |
| Anthraquinone feedstock volatility linked to coal-tar supply disruptions | -0.40% | Global, acute in China and India reliant on coal-chemical complexes | Medium term (2-4 years) |
| High-purity logistics (ppb metal limits) require costly single-use canisters | -0.20% | Global, concentrated in Asia-Pacific and North America electronics hubs | Medium term (2-4 years) |
| Process safety upgrades (LOPA/SIL) raising CAPEX for new ≥70% plants | -0.20% | Global, particularly affecting new-entrant projects in Asia-Pacific and Middle East | Long term (≥ 4 years) |
| Source: Mordor Intelligence | |||
EU Explosives-Precursor Tightening Lifts Distribution Costs For >35 wt% Grades
Regulation 2019/1148 requires end-user vetting, secure storage, and transaction reports for hydrogen peroxide above 35 wt%, lifting logistics cost by EUR 0.11–0.17 kg⁻¹. Arkema spent EUR 3.2 million on compliance upgrades at its Jarrie site, an outlay that trimmed book value by 18% in 2024. Many small textile and cosmetics buyers have downshifted to 35 wt% grades to avoid paperwork, eroding high-margin drum sales. Customs checks now delay re-exports via Antwerp and Rotterdam, prompting a 12% drop in European shipments of >35 wt% peroxide to North Africa and the Gulf since 2024. Asian producers exempt from the rule have gained share in these destinations.
Anthraquinone Feedstock Volatility Tied To Coal-Tar Disruptions
Anthracene prices rose 35% in 2025 after Shanxi and Inner Mongolia curtailed coking operations for winter air-quality targets, lifting variable costs by roughly 3 percentage points at plants lacking vertical integration. Gujarat Alkalies passed through a 6% price rise to Indian pulp mills in 2025, but smaller suppliers were squeezed when anthracene climbed above USD 1,800 t⁻¹. Evonik and BASF are partly insulated by captive feedstock, yet 400 independent Asian plants buy on spot terms and face profit swings. China’s dual-carbon roadmap foresees further coal-to-chemicals rationalization, implying structurally tighter anthracene supply to 2030. Research into lignin-based anthraquinone is underway, but no commercial demonstration plant has yet proven cost parity.
*Our forecasts treat driver/restraint impacts as directional, not additive. The impact forecasts reflect baseline growth, mix effects, and variable interactions.
Segment Analysis
By Product Function: Disinfectant Momentum Outpaces Legacy Bleaching
Bleaching still supplied 61.76% of 2025 volume, anchored in pulp mills that consume 8–12 kg per air-dried ton, yet growth trails as recycled fiber and enzyme pretreatments curb dosage. Disinfectant usage, by contrast, rises at a 4.44% CAGR because food processors, beverage fillers, and municipal water plants favor peroxide to avoid chlorinated by-products. Oxidants play a key role, particularly in HPPO propylene oxide synthesis, which aligns with polyurethane demand in insulation and automotive seating applications. Additionally, the use of oxidants in cleaning agents for semiconductor and pharmaceutical cleanrooms is influenced by purity requirements and pricing dynamics. The hydrogen peroxide market benefits from water-scarce regions opting for peroxide disinfection, which neither salts supply nor risks chlorate violation.
Disinfectant growth is most pronounced in South Asia and the Middle East, where desalinated water systems need a chlorine-free pathogen barrier. Bleaching remains robust in Southeast Asia, where 12 new recycled-fiber pulp mills started between 2024 and 2025. Textile mills pivot to enzymatic bleach bath setups that reduce peroxide input, trimming the hydrogen peroxide market share of fabric finishing. HPPO demand received a structural lift from LyondellBasell’s 470 kiloton plant in Houston, locking in 188 kilotons of contract offtake. Electronics cleaning gains modest volume but high value, as a single 5 nm fab can generate peroxide revenue equivalent to many pulp lines.


By Grade: High-Purity Formulations Capture Technology Premiums
Industrial Grade (35–50%) held a 42.27% share in 2025, serving pulp, textile, and wastewater. Chip fabs, pharma synthesis, and aerospace monopropellants support high-purity grades above 50 wt%'s growth. Standard grades below 35 wt% fill swimming-pool and household needs where metal tolerance is lenient, and the cost per kilogram is low. Solvay’s Zhenjiang expansion added 25 kilotons of photovoltaic-grade product with phosphorus and boron below 0.1 ppb, underscoring the margin available when contamination specs align with solar-cell efficiency targets.
Evonik’s Leshan project will add 30 kilotons of electronic-grade peroxide in 2026, confirming the hydrogen peroxide market size upside in the high-purity tier. Industrial-grade share erodes slowly as pulp mills install oxygen delignification, cutting usage per ton. Standard-grade growth is flat in mature economies but 6% in India and ASEAN, where household disinfection remains a growth habit post-pandemic. The cost barrier to enter the high-purity arena is steep: fluoropolymer-lined ISO containers and real-time ICP-MS monitoring add USD 0.10 kg⁻¹ to logistics, while clean-room bottling lines cost USD 8–12 million each.
By Concentration/Form: Powder Adducts Ride Cold-Water Detergent Trend
Aqueous Solution (less than or equal to 70%) commands 79.95% of shipments because the anthraquinone loop naturally yields 50%–70% peroxide, and transport rules tighten above 70%. Powder adducts—chiefly sodium percarbonate—advance at a 4.38% CAGR as detergent makers move to cold-wash formulations to cut household energy bills. Anhydrous peroxide above 90 wt% remains a micro-volume aerospace niche under military handling controls.
Evonik doubled granulation capacity in Ningbo in 2024 to feed Asian detergent plants that are phasing out borate-bearing sodium perborate. Aqueous growth levels off as large users install vacuum concentrators on-site, upgrading delivered 50 wt% to 70 wt% and saving freight. The hydrogen peroxide market sees tension between customers wanting higher active-oxygen content and insurers warning of escalating hazard classes over 70 wt%. For most industries, 70 wt% marks the economic and regulatory ceiling.
By End-User Industry: Wastewater Treatment Emerges As Growth Priority
Pulp and paper remained the top end-user at 48.54% of 2025 volume, yet wastewater plants led growth at 4.29% CAGR on the back of new micropollutant rules in India, the EU, and Gulf states. Chemical synthesis, centered on HPPO and epoxidation of vegetable oils, expands with polyurethane foam demand. Mining applications grow as peroxide replaces cyanide in gold leaching near sensitive watersheds. Food and beverage firms use dilute peroxide for aseptic pack sterilization and produce washing.
Textiles’ share slides as mills adopt ozone and enzymes, while cosmetics hold steady. Electronics punch above because ultra-pure pricing is three times commodity levels. The hydrogen peroxide market aligns with long-lived pulp mills whose bleaching sequences cost USD 40–60 million to overhaul, locking demand for decades, whereas wastewater and mining provide the next frontier for volume growth as regulations tighten.
Geography Analysis
Asia-Pacific controlled 52.28% of the 2025 volume and is forecast to post a 4.33% CAGR to 2031. China remains a leading producer, but increasing anthracene costs and coal-tar restrictions have significantly raised production expenses since early 2025. India is witnessing steady growth, driven by rising demand for pharmaceutical intermediates, textile bleaching, and compliance with new municipal standards. Japan and South Korea are supporting high-purity demand through the establishment of new semiconductor fabrication facilities, with local chemical suppliers already meeting stringent metal limit certifications. Meanwhile, Indonesia, Vietnam, and Thailand have introduced recycled-fiber pulp lines in recent years, reinforcing regional demand for bleaching applications.
In North America, LyondellBasell’s Houston HPPO unit and Dow’s Freeport plant together commit 250–280 kilotons of captive offtake, stabilizing merchant pricing. Ultra-pure supply chains now link Solvay’s Deer Park site with Arizona fabs by dedicated ISO tanks. Europe is shifting to low-carbon grades; BASF’s 54 MW electrolyzer at Ludwigshafen feeds renewable hydrogen into peroxide loops. EU Regulation 2019/1148 lifts logistics cost for >35 wt% strengths, prompting some customers to downgrade concentration or import from Asia.
South America sees annual growth, tied to Brazil’s eucalyptus-pulp expansions and Argentina’s mining projects that test cyanide-free peroxide leaching. The Middle East and Africa post growth albeit from a small base under 180 kilotons. Saudi wastewater upgrades and South African gold mines drive incremental demand. Overall, the hydrogen peroxide market sees Asia dominating volume, while Europe and North America host margin-rich niches in electronics and low-carbon supply.
Mordor Intelligence provides coverage of the hydrogen peroxide market across other key regional markets, including North America, Asia, and Europe, each with their regulatory frameworks and demand patterns. Detailed country-level analysis extends to India incorporating local coverage and market participation, as required.

Competitive Landscape
The Hydrogen Peroxide market is moderately consolidated. Vertical integration into anthraquinone and captive propylene-oxide shields these leaders from feedstock swings. Evonik’s contract with Pingmei Shenma for a 200-kiloton plant in 2025 and Solvay’s Huatai solar-grade venture exemplify technology licensing as a capital-light revenue stream. The hydrogen peroxide market values reliability and technical service. Suppliers with local tank farms and quick response teams win pulp and semiconductor contracts. Price competition is sharp in standard grades, where e-commerce channels broaden their reach.
Hydrogen Peroxide Industry Leaders
-
Evonik Industries AG
-
Mitsubishi Gas Chemical Company Inc.
-
Solvay
-
Arkema
-
Nouryon
- *Disclaimer: Major Players sorted in no particular order

Recent Industry Developments
- January 2025: Evonik Industries AG and Fuhua Tongda Chemicals formed Evonik Fuhua New Materials (Sichuan) to produce specialty hydrogen peroxide for solar cells, semiconductors, and food packaging; first output is scheduled for H1 2026.
- February 2025: Engro Polymer & Chemicals announced a PKR 12 billion (~USD 0.043 billion) investment in a new hydrogen peroxide plant to meet rising Asia-Pacific demand.
- April 2024: Evonik Industries AG introduced carbon-neutral hydrogen peroxide in Europe under its Way to GO2 certificate that supports customer Scope 3 emission cuts.


Research Methodology Framework and Report Scope
Market Definitions and Key Coverage
According to Mordor Intelligence, the hydrogen peroxide market covers merchant-grade solutions produced via the anthraquinone auto-oxidation route and traded in bulk for industrial bleaching, oxidizing, and disinfection uses. Volumes are expressed in metric tons at a delivered concentration of up to 70%.
Scope exclusion: this study omits captive hydrogen peroxide generated in-house for on-site propylene-oxide or caprolactam plants.
Segmentation Overview
-
By Product Function
- Disinfectant
- Bleaching
- Oxidant
- Other Product Function (Cleaning Agent, etc.)
-
By Grade
- Standard Grade (less than 35% w/w)
- Industrial Grade (35–50%)
- High-Purity Grade (more than 50%)
-
By Concentration / Form
- Aqueous Solution (less than or equal to 70%)
- Anhydrous (more than 90%)
- Powder/Granular Adducts (Perborate and Percarbonate)
-
By End-user Industry
- Pulp and Paper
- Chemical Synthesis
- Wastewater Treatment
- Mining
- Food and Beverage
- Cosmetics and Healthcare
- Textiles
- Other End-user Industries (Electronics and Semiconductors, Transportation, Aseptic Packaging, and Rocketry)
-
By Geography
-
Asia-Pacific
- China
- India
- Japan
- South Korea
- Malaysia
- Thailand
- Indonesia
- Vietnam
- Rest of Asia-Pacific
-
North America
- United States
- Canada
- Mexico
-
Europe
- Germany
- United Kingdom
- France
- Italy
- Spain
- NORDIC Countries
- Turkey
- Russia
- Rest of Europe
-
South America
- Brazil
- Argentina
- Colombia
- Rest of South America
-
Middle East and Africa
- Saudi Arabia
- Qatar
- United Arab Emirates
- South Africa
- Egypt
- Nigeria
- Rest of Middle East and Africa
-
Asia-Pacific
Detailed Research Methodology and Data Validation
Primary Research
Mordor analysts interviewed plant managers in Asia-Pacific pulp mills, semiconductor wet-process engineers in the United States, and procurement heads at wastewater-treatment contractors across Europe. These dialogs validated grade mix shifts, typical delivered pricing, and utilization trends that secondary sources could only hint at.
Desk Research
We pulled foundational statistics from tier-one public sources such as UN COMTRADE shipment data, the World Pulp and Paper Association's production index, Eurostat chemical output tables, US EPA effluent guidelines, and peer-reviewed papers on HPPO technology advances. Company 10-Ks, investor decks, and trade-press price trackers complemented the picture, while D&B Hoovers and Dow Jones Factiva helped our analysts cross-check corporate capacities and supply contracts. Numerous additional references supported data cleaning and gap filling beyond this illustrative list.
Market-Sizing & Forecasting
A top-down reconstruction starts with regional pulp, textile, and HPPO demand pools, which are then adjusted for hydrogen peroxide penetration rates and average concentration factors. Select bottom-up checks, sampled supplier roll-ups and channel ASP × volume probes, align the totals within an acceptable variance band. Key variables include new bleached-pulp capacity (k t/y), semiconductor wafer starts, wastewater reuse mandates, average 50% grade contract prices, and trade-weighted currency shifts. Multivariate regression ties these drivers to peroxide consumption; scenario analysis stress-tests high-purity demand under aggressive chip-fab buildouts. Where bottom-up estimates lag reliable data, weighting favors the better-documented top-down vectors before final triangulation.
Data Validation & Update Cycle
Model outputs pass three-layer variance checks, peer review, and senior sign-off. We refresh every twelve months and trigger interim revisions for material events, plant outages, regulation changes, or double-digit price swings, so clients always receive the latest vetted baseline.
Why Mordor's Hydrogen Peroxide Baseline Commands Reliability
Published figures differ because firms choose distinct scopes, price bases, and refresh cadences.
Our disciplined definition, dual-track modeling, and annual update rhythm minimize those drifts.
Benchmark comparison
| Market Size | Anonymized source | Primary gap driver |
|---|---|---|
| 6.11 million tons (2025) | Mordor Intelligence | - |
| USD 1.48 billion (2024) | Global Consultancy A | Values rather than volume, excludes <35% grades; currency and ASP assumptions opaque |
| USD 6.69 billion (2024) | Industry Association B | Bundles derivatives and on-site output, inflating totals |
| USD 1.89 billion (2024) | Regional Consultancy C | Older exchange rates and biennial refresh widen variance |
These contrasts show how scope creep, pricing bases, and slower refresh cycles can skew outcomes. By anchoring on clear volume units, audited capacity data, and timely revisions, Mordor delivers a balanced, transparent starting point that decision-makers can reproduce and trust.


Key Questions Answered in the Report
How large will global demand for hydrogen peroxide be by 2031?
The hydrogen peroxide market size is forecast to reach 7.71 million tons by 2031, advancing at a 3.96% CAGR from 2026.
Which region contributes the most volume to hydrogen peroxide consumption?
Asia-Pacific leads the hydrogen peroxide market with more than 52% of world tonnage in 2025 and is expanding at a 4.33% CAGR.
What is driving the fastest growth segment in end-use applications?
Wastewater treatment is the fastest rising end-user, growing at a 4.29% CAGR as regulators mandate advanced oxidation to remove micropollutants.
Why are high-purity grades priced at a premium?
Semiconductor and pharmaceutical customers require metal contamination below parts-per-billion levels, and the specialized clean-room bottling and fluoropolymer logistics justify premiums exceeding 200% over commodity grades.
How are producers addressing sustainability in manufacturing?
Leading suppliers install green-hydrogen electrolyzers and certify low-carbon peroxide, capturing premiums of up to 20% from pulp and consumer-goods clients under net-zero targets.
Page last updated on:


