
Epichlorohydrin Market Size and Share
Market Overview
| Study Period | 2020 - 2031 |
|---|---|
| Market Volume (2026) | 2.27 Million tons |
| Market Volume (2031) | 2.67 Million tons |
| Growth Rate (2026 - 2031) | 3.30 % |
| Fastest Growing Market | Asia Pacific |
| Largest Market | Asia Pacific |
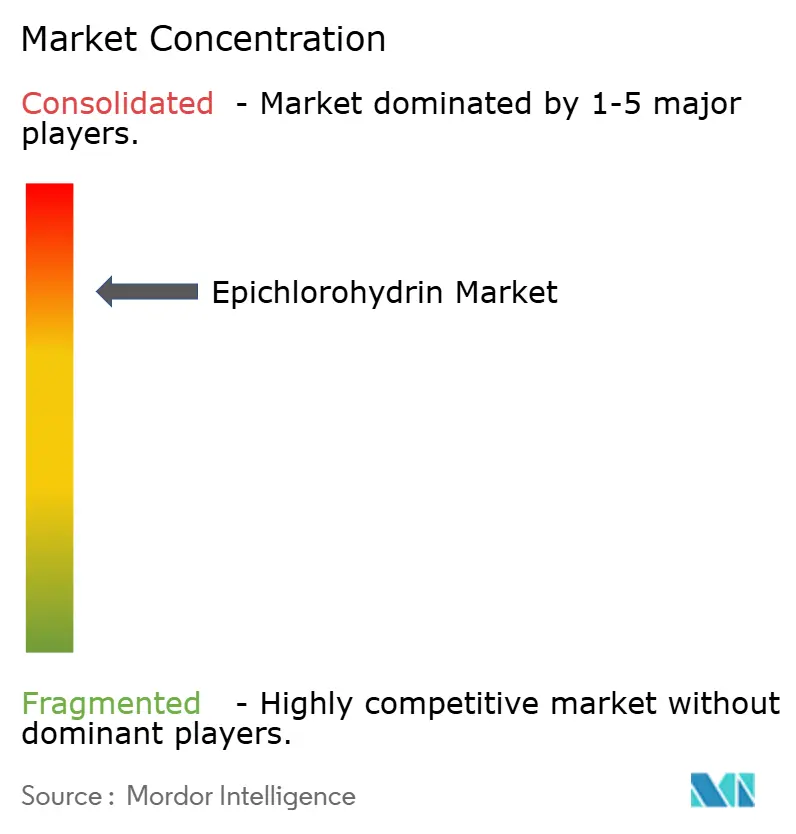
| Market Concentration | High |
Major Players *Disclaimer: Major Players sorted in no particular order Image © Mordor Intelligence. Reuse requires attribution under CC BY 4.0. | |
Epichlorohydrin Market Analysis by Mordor Intelligence
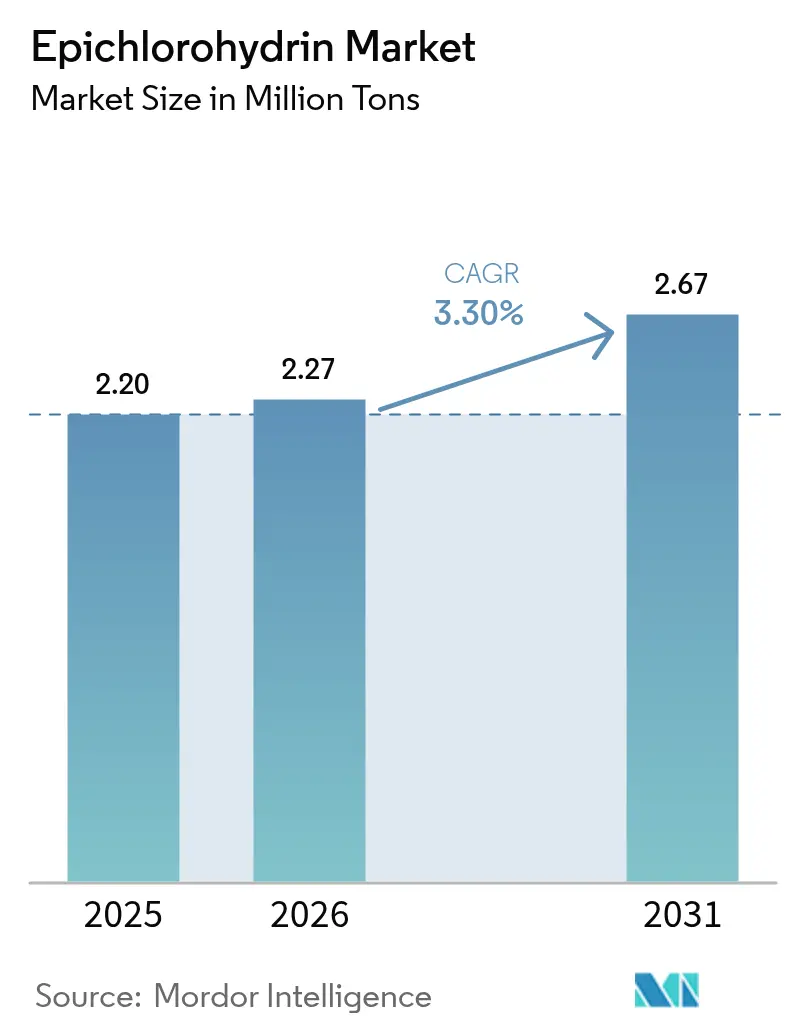
Epichlorohydrin Market size in 2026 is estimated at 2.27 Million tons, growing from 2025 value of 2.20 Million tons with 2031 projections showing 2.67 Million tons, growing at 3.30% CAGR over 2026-2031. Volume growth stems mainly from the expanding epoxy resin sector, new capacity additions in Asia-Pacific, and increasing substitution of petroleum routes with glycerin-based processes. Industry participants are extending vertical integration into downstream epoxy resins to buffer raw-material swings, while investments in renewable feedstock technologies reduce compliance costs in regions tightening emission limits. Although North America and Europe contend with higher energy costs and stricter air-pollution rules, global construction activity, renewable-energy installations, and semiconductor device miniaturization continue to widen application breadth and sustain long-term demand for epichlorohydrin.
Key Report Takeaways
- By type, oil-based grades retained an 87.78% epichlorohydrin market share in 2025; bio-based grades are poised to advance at a 3.96% CAGR through 2031, outpacing the overall market.
- By application, epoxy resins captured 86.20% of the epichlorohydrin market size in 2025 and are set to expand at a 3.92% CAGR to 2031.
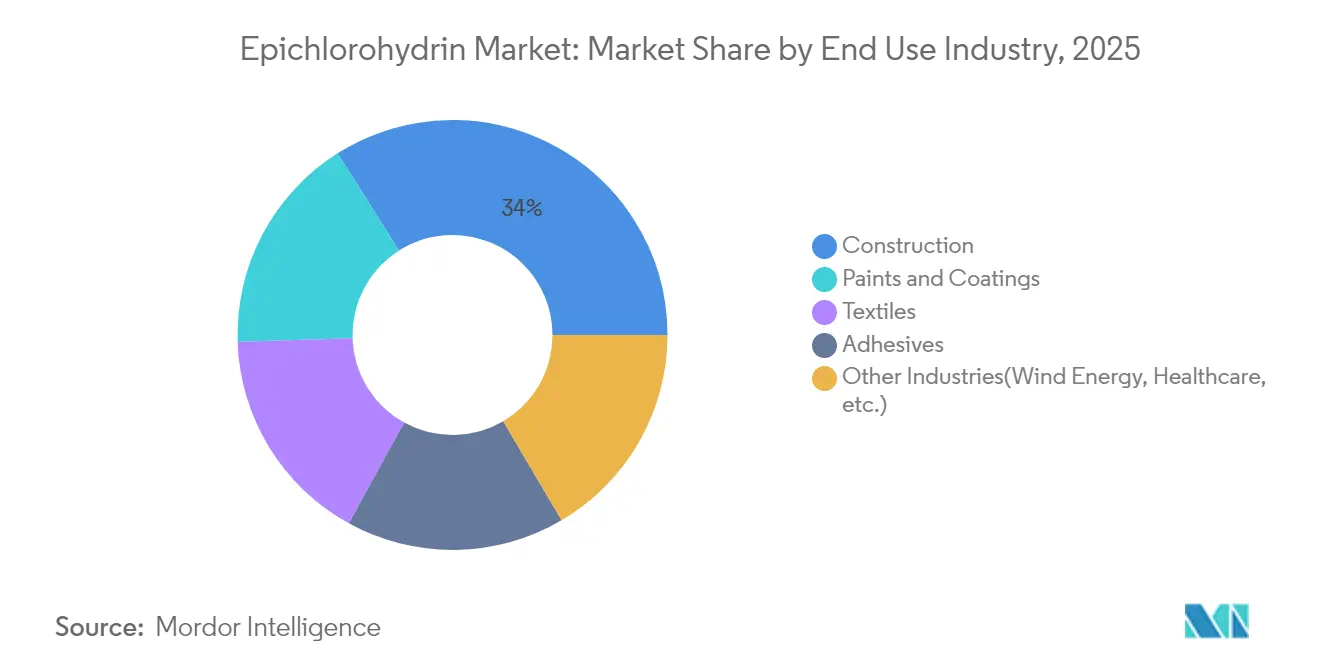
- By end-use, construction accounted for 33.98% of epichlorohydrin demand in 2025, while wind-energy and healthcare uses together register the swiftest 4.04% CAGR to 2031.
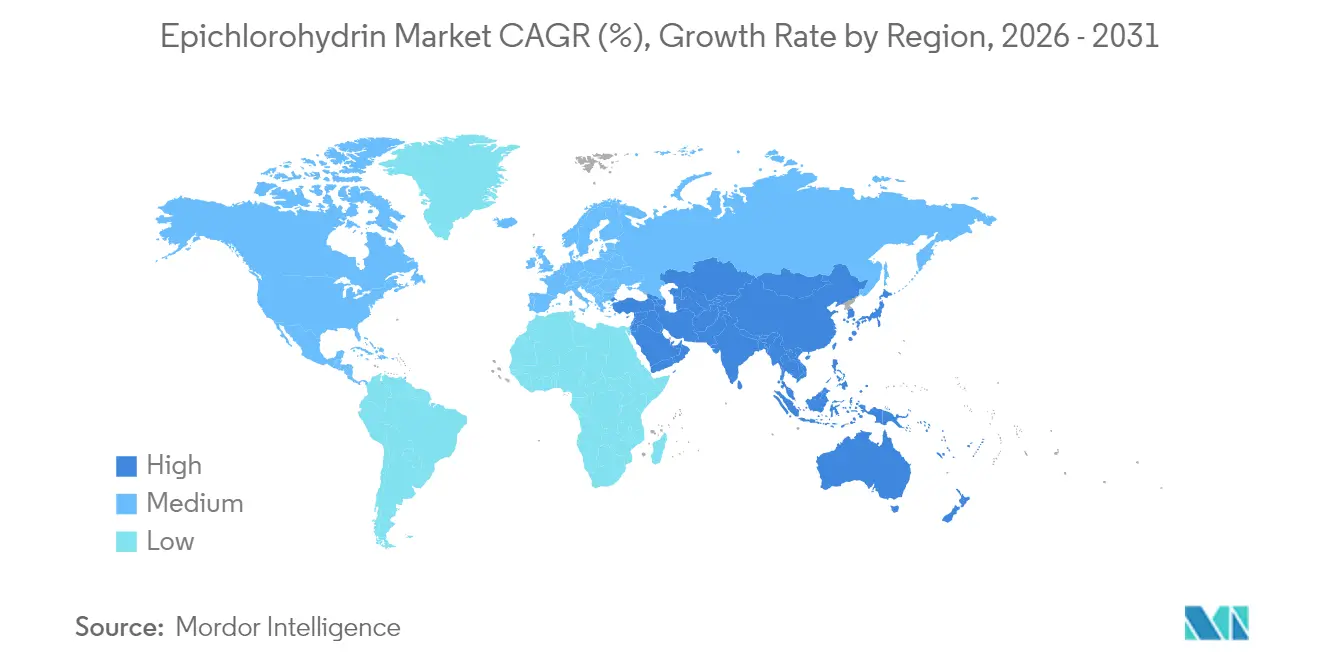
- By geography, Asia-Pacific commanded 58.72% of global demand in 2025 and is projected to grow the fastest at 4.12% CAGR through 2031.
Note: Market size and forecast figures in this report are generated using Mordor Intelligence’s proprietary estimation framework, updated with the latest available data and insights as of 2026.
Market Trends and Insights
Drivers Impact Analysis of Epichlorohydrin Market*
| Driver | (~) % Impact on CAGR Forecast | Geographic Relevance | Impact Timeline |
|---|---|---|---|
| Bio-based feedstock shift | +0.7% | Global; early gains in Asia-Pacific | Medium term (2-4 years) |
| Rising epoxy resin demand | +1.2% | Global | Short term (≤ 2 years) |
| Construction activity rebound | +0.5% | Asia-Pacific; North America | Medium term (2-4 years) |
| Wind-turbine blade manufacturing | +0.4% | Europe; North America; China | Medium term (2-4 years) |
| Growing investment in semiconductor encapsulation | +0.3% | Asia-Pacific, North America | Short term (≤2 yrs) |
| Source: Mordor Intelligence | |||
Bio-based Feedstock Availability Spurs Sustainable Growth
A widening surplus of crude glycerin from biodiesel has bolstered the economic case for glycerin-to-epichlorohydrin production. Plants using Epicerol technology cut CO₂ emissions by 60% and wastewater generation by up to forty-fold compared with propylene routes, meeting tightening carbon regulations and qualifying for green-chemistry incentives. Production costs around EUR 1,697 / ton are now within striking distance of prevailing market prices, narrowing the profitability gap as glycerin prices soften. AGC Chemicals Europe commercialized EPINITY in 2024, and Epigral Limited entered domestic manufacturing in India using the same technology, underlining accelerated adoption. As more jurisdictions impose lifecycle-carbon disclosures, bio-based epichlorohydrin gives producers a credible pathway to secure long-term offtake agreements with sustainability-focused customers.
Escalating Epoxy Resin Consumption Amplifies Core Demand
Epoxy resins absorb over 86% of global epichlorohydrin output, anchoring baseline growth for the epichlorohydrin market. Infrastructure upgrades, protective industrial coatings, and advanced composites for automotive and aerospace continue to widen epoxy use, while electronics miniaturization demands high-purity, low-chlorine resin grades. DCM Shriram’s USD 120 million epoxy resin complex in Gujarat exemplifies regional backward integration designed to secure captive epichlorohydrin supply. As coating manufacturers introduce water-borne and solvent-free lines to meet volatile-organic-compound rules, epoxy demand per square meter rises, lengthening the growth runway through 2030.
Construction Sector Expansion Underpins Volume Uptake
Although higher interest rates moderated Western housing starts in 2024, stimulus programs in China, India, and the United States keep large-scale transportation, commercial, and residential projects moving forward. Durable flooring, corrosion-resistant rebar coatings, and epoxy-bonded structural adhesives all rely on epichlorohydrin-derived resins. Government mandates for longer design lives and lower maintenance costs push builders toward epoxy systems with certified environmental product declarations, reinforcing steady consumption even during cyclical downturns. The segment retains the single-largest share of end-use demand, ensuring that construction activity remains a dependable load for future capacity expansions.
Wind-Energy Blade Manufacturing Extends Application Scope
Global targets for renewable power have accelerated wind-farm deployments, boosting composite-blade demand. Epichlorohydrin-based epoxy matrices deliver the high glass-transition temperature and fatigue resistance required for ever-longer blades. Recent laboratory results show that disulfide epoxy additives create covalent-adaptable networks, enabling blade sections to be reprocessed while retaining structural integrity. Such recyclability addresses growing concern over blade landfill waste, and regulatory pressure for end-of-life solutions is expected to channel additional volumes toward next-generation epoxy systems.
Restraints Impact Analysis of Epichlorohydrin Market*
| Restraint | (~) % Impact on CAGR Forecast | Geographic Relevance | Impact Timeline |
|---|---|---|---|
| Raw-material price volatility | -0.6% | Global | Short term (≤ 2 years) |
| Environment-related compliance costs | -0.8% | North America; Europe | Long term (≥ 4 years) |
| Rising adoption of non-epoxy aliphatic resins | -0.3% | Europe, North America | Long term (≥5 yrs) |
| Source: Mordor Intelligence | |||
Feedstock Price Fluctuations Pressure Margins
Propylene and caustic soda prices continued to swing widely in 2024, reflecting global energy-price uncertainty and periodic outages in chlor-alkali units. While Asian suppliers temporarily benefited from lower production costs, European producers grappled with high electricity tariffs, compressing spreads. Firms with integrated chlor-alkali assets have partially offset volatility, yet unhedged producers face margin squeeze that can delay debottlenecking plans. Bio-based units provide an alternate cost base but remain exposed to glycerin pricing tied to biodiesel policies. Hedging strategies and diversified sourcing therefore stay at the forefront of procurement practices during 2025-2026.
Tightening Environmental Regulations Elevate Compliance Burden
The US EPA’s 2024 amendments to NESHAP and NSPS mandate additional vent controls that collectively shave 1,372 tons per year of hazardous air pollutant emissions from chemical facilities[1]Environmental Protection Agency, “Regulatory Impact Analysis for the Final New Source Performance Standards for the Synthetic Organic Chemical Manufacturing Industry and National Emission Standards for Hazardous Air Pollutants for the Synthetic Organic Chemical Manufacturing Industry and Group I & II Polymers and Resins Industry,” epa.gov . Similar provisions in Canada now require notification for consumer-product uses exceeding 0.1% epichlorohydrin w/w [2]Government of Canada, “Order 2024-87-20-01 Amending the Domestic Substances List,” gazette.gc.ca. Capital expenditures for scrubbers, flare systems, and leak-detection upgrades raise operating costs and favor plants with modern, low-emission designs or renewable feedstock pathways. While these rules improve community health outcomes, they can weigh on near-term profitability and nudge marginal production toward regions with lighter regulatory footprints.
*Our forecasts treat driver/restraint impacts as directional, not additive. The impact forecasts reflect baseline growth, mix effects, and variable interactions.
Epichlorohydrin Market Segment Analysis
By Type:
Bio-Based Grades Gain MomentumOil-derived epichlorohydrin retained an 87.78% share of global consumption in 2025, equating to 1,931.16 kilotons, yet bio-based volumes grew faster, closing the year at 268.84 kilotons. The epichlorohydrin market size attributable to bio-based production is expected to expand at 3.96% CAGR, lifted by policy incentives for low-carbon chemicals and expanding glycerin availability from biodiesel streams. In contrast, the oil-based route is projected to trail the overall epichlorohydrin market by nearly 70 basis points in growth due to escalating carbon fees in Europe and the gradual shift of multinational customers toward greener supply chains.
Producers employing Epicerol technology consistently report 60% lower greenhouse-gas footprints and up to forty-fold reductions in wastewater discharge relative to the allyl-chlorination pathway. Early adopters in Asia, most notably in Thailand and India, demonstrate that bio-based units can reach economies of scale above 50 ktpa, encouraging other chlor-alkali firms to license similar technology. Over the forecast horizon, incremental efficiency gains and potentially lower glycerin prices may compress the cost premium, enabling bio-based grades to penetrate niche electronic encapsulation lines where ultra-low chlorine is pivotal.




By Application:
Epoxy Resins Preserve DominanceEpoxy resins absorbed 1,896.4 kilotons in 2025, translating to 86.20% of total demand. Their 3.92% CAGR through 2031 ensures that the epichlorohydrin market continues to track epoxy sector growth. Construction, protective coatings, and electrical laminates lead volume uptake, while advanced composites in aerospace and wind energy supply higher-value grades. The epichlorohydrin market share associated with water-treatment flocculants remains modest but stable, as stringent potable-water standards limit allowable monomer residues.
Semiconductor encapsulation represents a fast-growing, premium niche. Patent filings describing low-ppm-chlorine epoxy systems underscore the industry’s quest for higher thermal conductivity and minimal warpage during reflow soldering. Although volumes are comparatively small, their elevated margins influence producers to maintain dedicated purification trains. Meanwhile, regulatory scrutiny over potential monomer migration in potable water spurs continuous R&D into ultra-low-residual processes, preserving the epichlorohydrin industry’s relevance in safety-critical applications.
By End-Use Industry:
Construction Retains Lead despite HeadwindsThe construction sector drew down 747.56 kilotons of epichlorohydrin-derived products in 2025, or 33.98% of global demand. Urban infrastructure projects in India and Southeast Asia offset softer residential spending in Europe, allowing the segment to post modest year-on-year growth. Interior floor coatings, chemical-resistant grout, and epoxy-bonded concrete overlays anchor baseline consumption, while government mandates for green building materials promote low-VOC, high-solids formulations that intensify epichlorohydrin usage per finished surface.
Paints and coatings ranked second and benefited from a swift rebound in automotive OEM production and defense spending. Adhesives for engineered wood and structural assemblies maintained mid-single-digit growth, illustrating ongoing substitution of solvent-borne systems. Emerging sectors—wind-energy composites, medical devices, and specialty elastomers, together tally the fastest 4.04% CAGR. Manufacturers targeting these niches deploy grade differentiation strategies such as ultrapure or elastomer-modified epoxies to secure higher contribution margins, thereby diversifying revenue streams beyond cyclical construction trends.
Geography Analysis
APAC Epichlorohydrin Market
Asia-Pacific led global demand with 1,291.84 kilotons in 2025, equating to 58.72% of the epichlorohydrin market. Continued 4.12% CAGR growth arises from robust downstream epoxy resin expansion, capacity investments in India, and Chinese industrial policy emphasizing self-reliance in advanced materials. Regional producers benefit from access to competitively priced propylene and supportive infrastructure investment, enhancing supply-chain agility. The epichlorohydrin market size in Asia-Pacific is therefore expected to widen its lead over other regions by 2031.
North America and Europe Epichlorohydrin Market
North America retains significant high-value consumption in aerospace composites, semiconductor encapsulation, and specialty coatings. However, emission-control retrofits mandated under revised EPA rules introduce capital expenditures that may encourage incremental imports of bio-based grades produced in Asia. Europe confronts parallel challenges: high energy costs, slower GDP growth, and stringent carbon-pricing schemes compress margins, prompting consolidation of smaller epoxy formulators. Nevertheless, EU funding for offshore-wind build-outs and battery gigafactories ensures selective demand pockets for premium epichlorohydrin derivatives.
LATAM and MEA Epichlorohydrin Market
Latin America, the Middle East, and Africa collectively account for less than 10% of global volumes but present long-term potential. Brazil’s infrastructure concessions and Saudi Arabia’s chemical diversification agendas create localized demand clusters. While per-capita consumption is currently low, rising urbanization and renewable-energy targets promise incremental growth that global suppliers may capture by deploying import terminals and regional blending hubs.

Value Chain Analysis
The epichlorohydrin value chain starts with upstream feedstocks and utilities: propylene and chlorine (from chlor-alkali), along with caustic soda co-products, support the conventional allyl chloride route. Crude glycerin and hydrogen chloride enable the bio-based pathway. Compared with glycerin-based production, the petro-route is more water and wastewater intensive, which increases the focus on effluent treatment and emission controls in operating economics. Glycerin-based production improves atom efficiency and reduces the environmental load, supporting adoption where compliance costs are rising.
In the midstream, integrated producers and technology licensors convert feedstocks to epichlorohydrin and then move product through bulk logistics (tank storage, ISO tanks, and regional distributors) into captive or merchant sales. Downstream demand is concentrated in epoxy resins, which then flow into construction, coatings, adhesives, wind-energy composites, and electronics encapsulation. This structure keeps producers focused on integration across chlor-alkali, epichlorohydrin, and epoxy resin assets to stabilize margins and manage raw-material volatility. Chain-shaping actions include DCM Shriram commissioning its Jhagadia epichlorohydrin plant in stages (35,000 TPA in October 2025, followed by the remaining 17,000 TPA in April 2026 to reach 52,000 TPA) and HELM US Corporation using a long-term exclusive distribution arrangement for AGC Vinythai bio-based epichlorohydrin in the United States (March 2026).
Competitive Landscape
The global epichlorohydrin market is concentrated, with key players leveraging vertical integration to mitigate feedstock cost volatility and secure captive outlets. AGC’s chlor-alkali network in Southeast Asia supports domestic and export markets, while its EPINITY line enhances sustainability. Indian producers like Epigral are expanding rapidly, as the company has approved a 100 ktpa capacity increase at Dahej to meet domestic and export demand. Technology licensors like Technip Energies drive sustainability with glycerin-based processes. Strategic priorities include optimizing brownfield assets, co-locating near renewable energy hubs, and using biogenic feedstock to meet targets, while partnerships with downstream sectors boost demand and cross-selling opportunities.
Epichlorohydrin Industry Leaders
Solvay
Sumitomo Chemical Co., Ltd.
Olin Corporation
Shandong Haili Chemical Industry Co., Ltd.
Grasim Industries Ltd
- *Disclaimer: Major Players sorted in no particular order
Epichlorohydrin Market Companies Covered in this Report
- AGC Vinythai
- DCM SHRIRAM CHEMICALS
- Epigral Limited
- Formosa Plastics Corporation
- Grasim Industries Ltd
- Hanwha Solutions Chemical Division Corporation
- Hexion Inc.
- Kashima Chemical Co. Ltd.
- Lotte Fine Chemical Co. Ltd.
- Nama
- Olin Corporation
- Shandong Haili Chemical Industry Co., Ltd.
- Sinochem International Corporation
- Solvay
- Sumitomo Chemical Co., Ltd.

Market Opportunities and Future Outlook
Bio-based epichlorohydrin routes open opportunities where customers and regulators are tightening lifecycle and process-emissions scrutiny, while many downstream epoxy users also pursue lower-VOC and higher-solids formulations. Concrete signals in the supply channel include AGC Chemicals Europe’s commercialization of EPINITY in 2024 and the March 2026 move by HELM US Corporation and AGC Vinythai to reinforce exclusive distribution of bio-based epichlorohydrin in the United States, which increases the availability of renewable-feedstock grades for North American formulators without requiring immediate local production buildout.
India-focused capacity additions and backward integration also support opportunities for local sourcing, faster deliveries, and tailored grades across coatings, construction chemicals, and electronics. DCM Shriram brought its Jhagadia epichlorohydrin facility to 52,000 TPA by commissioning the remaining 17,000 TPA in April 2026, and Epigral has disclosed an expansion track toward 100,000 TPA at Dahej with commissioning targeted during H1 FY27. These moves strengthen import substitution and improve supply optionality for domestic epoxy chains, including DCM Shriram’s integrated epoxy resin complex in Gujarat. At the same time, rising capacity in China increases the need for differentiation, including purity, ultra-low chlorine, and sustainability attributes, alongside tighter execution around captive epoxy outlets or structured distribution partnerships to defend utilization and pricing.
Recent Industry Developments in Epichlorohydrin Market
- April 2026: DCM Shriram Limited commissioned the remaining 17,000 TPA at its epichlorohydrin plant in Jhagadia, Gujarat, taking the unit to its full 52,000 TPA capacity. Full-rate operation strengthens captive and merchant supply into the epoxy resin and coatings chain and improves operating leverage at the integrated chemical complex.
- March 2026: HELM US Corporation and AGC Vinythai Public Company Limited signed new long-term agreements that reinforce HELM US as the exclusive distribution partner for AGC Vinythai bio-based epichlorohydrin in the United States. The arrangement widens route-to-market access for renewable-feedstock grades and supports more stable offtake planning for both supplier and downstream formulators.
- October 2025: DCM Shriram Limited commissioned the initial 35,000 TPA capacity of its epichlorohydrin plant at its Jhagadia chemical complex in Bharuch District, Gujarat. The staged ramp-up established new domestic supply in India and anchored the company’s integration strategy across chlor-alkali and downstream epoxy value chains.


Epichlorohydrin Market Report Scope and Research Methodology
Market Definition and Coverage
For this study, the epichlorohydrin market covers demand for epichlorohydrin as a chemical intermediate. We count it at point of sale from producers to downstream manufacturing across major regions. To better reflect real consumption and supply movements, we size the market in volume terms (tonnage) rather than value.
Scope exclusions: We exclude downstream epoxy resin, glycerin, and specialty chemical product revenues, and we also exclude internal transfer values when they do not reflect an external sale.
Segments Covered in This Report
- By Type
- Oil-based epichlorohydrin
- Bio-based epichlorohydrin
- By Application
- Epoxy Resins
- Specialty Water Treatment Chemicals
- Synthetic Glycerin
- Epichlorohydrin Elastomers
- Other Applications(Pharmaceuticals, etc.)
- By End-Use Industry
- Construction
- Paints and Coatings
- Adhesives
- Textiles
- Other Industries(Wind Energy, Healthcare, etc.)
- By Geography
- Asia-Pacific
- China
- India
- Japan
- South Korea
- Rest of Asia-Pacific
- North America
- United States
- Canada
- Mexico
- Europe
- Germany
- United Kingdom
- France
- Italy
- Rest of Europe
- South America
- Brazil
- Argentina
- Rest of South America
- Middle East and Africa
- Saudi Arabia
- South Africa
- Rest of Middle East and Africa
- Asia-Pacific
Data Sources, Market Sizing, and Validation
Desk Research
Desk research was used to set the market map and to build initial assumptions around supply, trade, and end-use pull. Public sources such as USGS chemicals and materials data, UN Comtrade trade statistics, U.S. International Trade Commission data, Eurostat industrial indicators, and EPA and ECHA pages helped us track how capacity, imports, and compliance trends shift over time.
We also reviewed producer annual reports, investor presentations, and press releases to capture capacity additions, plant shutdowns, and process shifts (including glycerin-based routes). Where needed, paid subscriptions for company financials and intelligence, patent databases, and an import-export shipment-level database were referenced to cross-check ownership, locations, and trade flows. These examples are not exhaustive, and we also used other public documents and datasets during data collection, validation, and clarification.
Primary Interviews and Surveys
Primary work focused on validating the real demand pool and the pricing logic for epichlorohydrin, especially where published data is thin or arrives with delays. We spoke with manufacturers, distributors, and downstream users across APAC, EMEA, and the Americas to refine assumptions on operating rates, contract versus spot mix, and application shares before finalizing the model.
Distribution of primary research fieldwork respondents
| Company type | Respondent position | Region |
|---|---|---|
| Top tier: 34% | CXOs: 15% | APAC: 51% |
| Mid tier: 50% | Functional/Unit leaders: 38% | EMEA: 29% |
| Smaller Players: 16% | Managers: 47% | Americas: 20% |
Market-Sizing & Forecasting
The core model uses a top-down approach where production capacity, operating rates, and net trade are combined to reconstruct apparent consumption by region. We then align these totals to the main pull from epoxy resins and other end uses. To keep the results realistic, we corroborated them with selective bottom-up approximations, including sampled producer volumes in key countries and a check using average selling price ranges multiplied by estimated tonnage.
Inputs that materially shaped the sizing included regional epoxy resin output indicators, announced capacity additions and utilization changes, import and export volumes for epichlorohydrin-linked trade codes, typical process route mix (allyl chloride versus glycerin-based), and spread movements in key feedstocks that influence price levels. Where country splits were missing or inconsistent, we used trade flow direction and downstream manufacturing proxies to allocate volumes conservatively, and then rechecked them with interview feedback.
For forecasting, we ran scenario analysis around capacity start-ups, operating rate normalization, and downstream demand growth. We then tested the selected pathway against an ARIMA view of historical consumption signals. The final forecast was accepted only after the variables matched what industry respondents described for the next cycle.
Data Validation & Update Cycle
Outputs are validated through triangulation across independent checks, including supply-demand balance logic, trade consistency tests, and price-to-volume reasonableness by region. If an estimate creates an unusual jump, we reopen the drivers and review the assumptions again. In many cases, respondents are re-contacted to confirm whether a plant event, a policy change, or a demand disruption explains the move.
Before sign-off, the work is reviewed in multiple steps, starting with a structured self-check and followed by a separate analyst review focused on variance and unit consistency. Reports are refreshed annually, and interim updates are triggered when material capacity, trade policy, or downstream demand shifts are observed. Right before delivery, a final pass is completed so clients receive the most current view available.
Mordor Intelligence's Epichlorohydrin Market Estimate Compared With Other Published Estimates
It is normal to see different market sizes for epichlorohydrin because the underlying choices are not always the same, even when the market name looks identical. The biggest differences usually come from whether the figure is built in value or in volume, which years are treated as the starting point, and how prices are converted and averaged across regions.
Some publications present a USD revenue total that implicitly blends producer sales with downstream value capture and longer-range price escalation assumptions. In Mordor Intelligence, the headline market size is reported in tons and is limited to epichlorohydrin volumes consumed by region. This keeps the result tied to capacity, utilization, and net trade signals rather than modeled price expansion.
Benchmark comparison
| Source | Market Size | Gaps in Research Methodology |
|---|---|---|
| Mordor Intelligence | USD 2.27 M (2026) | |
| Industry Research Publisher A | USD 3.11 B (2025) | Uses a revenue-based view with application and process splits, so totals can be lifted by assumed ASP levels, currency timing, and value chain interpretation rather than physical demand balance. |
| Global Research Publisher B | USD 2.99 B (2024) | Uses a value forecast with a different base year and longer forecast horizon, and it can reflect more aggressive price progression and broader end-use mapping that is not directly reconciled to regional capacity and trade. |
Taken together, the spread is mostly explained by unit choice and how pricing is treated. Our approach stays traceable because the volume model can be reproduced using public capacity and trade signals, and then adjusted with interview checks when operating rates or end-use shares shift.


Key Questions Answered in the Report
What is the projected growth rate for the epichlorohydrin market between 2026 and 2031?
The epichlorohydrin market is expected to expand at a 3.30% CAGR, rising from 2.27 million tons in 2026 to 2.67 million tons in 2031.
Which application will drive the largest epichlorohydrin volume through 2031?
Epoxy resins will remain the dominant application, accounting for more than 86% of demand and growing at 3.92% CAGR.
Why is Asia-Pacific the leading regional consumer of epichlorohydrin?
Rapid industrialization, substantial construction spending, and expanding epoxy resin capacity give Asia-Pacific a 58.72% share of global demand, the highest worldwide.
What regulatory trends are shaping future supply strategies?
Tighter air-pollutant limits in North America and Europe and Canada’s new-activity reporting requirements are pressing producers to adopt cleaner technologies and bio-based feedstocks.
Page last updated on:


 Your data is secure and never sold or shared.


