
Chemicals & Materials
7th MayStrategic Expansion of Floor Coatings in the MEIA Region
4 Min Read
The Hypochlorite Bleaches Market Report is Segmented by Product (Sodium Hypochlorite, Calcium Hypochlorite, Lithium Hypochlorite, Potassium Hypochlorite), Form (Liquid, Solid), Application (Pulp and Paper, Disinfectants, Textiles, Aquaculture, Laundry Bleach, Others), and Geography (North America, South America, Europe, Asia-Pacific, Middle East and Africa). The Market Forecasts are Provided in Terms of Value (USD).
Market Overview
| Study Period | 2020 - 2031 |
|---|---|
| Market Size (2026) | USD 321.65 Billion |
| Market Size (2031) | USD 409.03 Billion |
| Growth Rate (2026 - 2031) | 4.92 % CAGR |
| Fastest Growing Market | Asia Pacific |
| Largest Market | Asia Pacific |
| Market Concentration | Medium |
Major Players *Disclaimer: Major Players sorted in no particular order. Image © Mordor Intelligence. Reuse requires attribution under CC BY 4.0. |
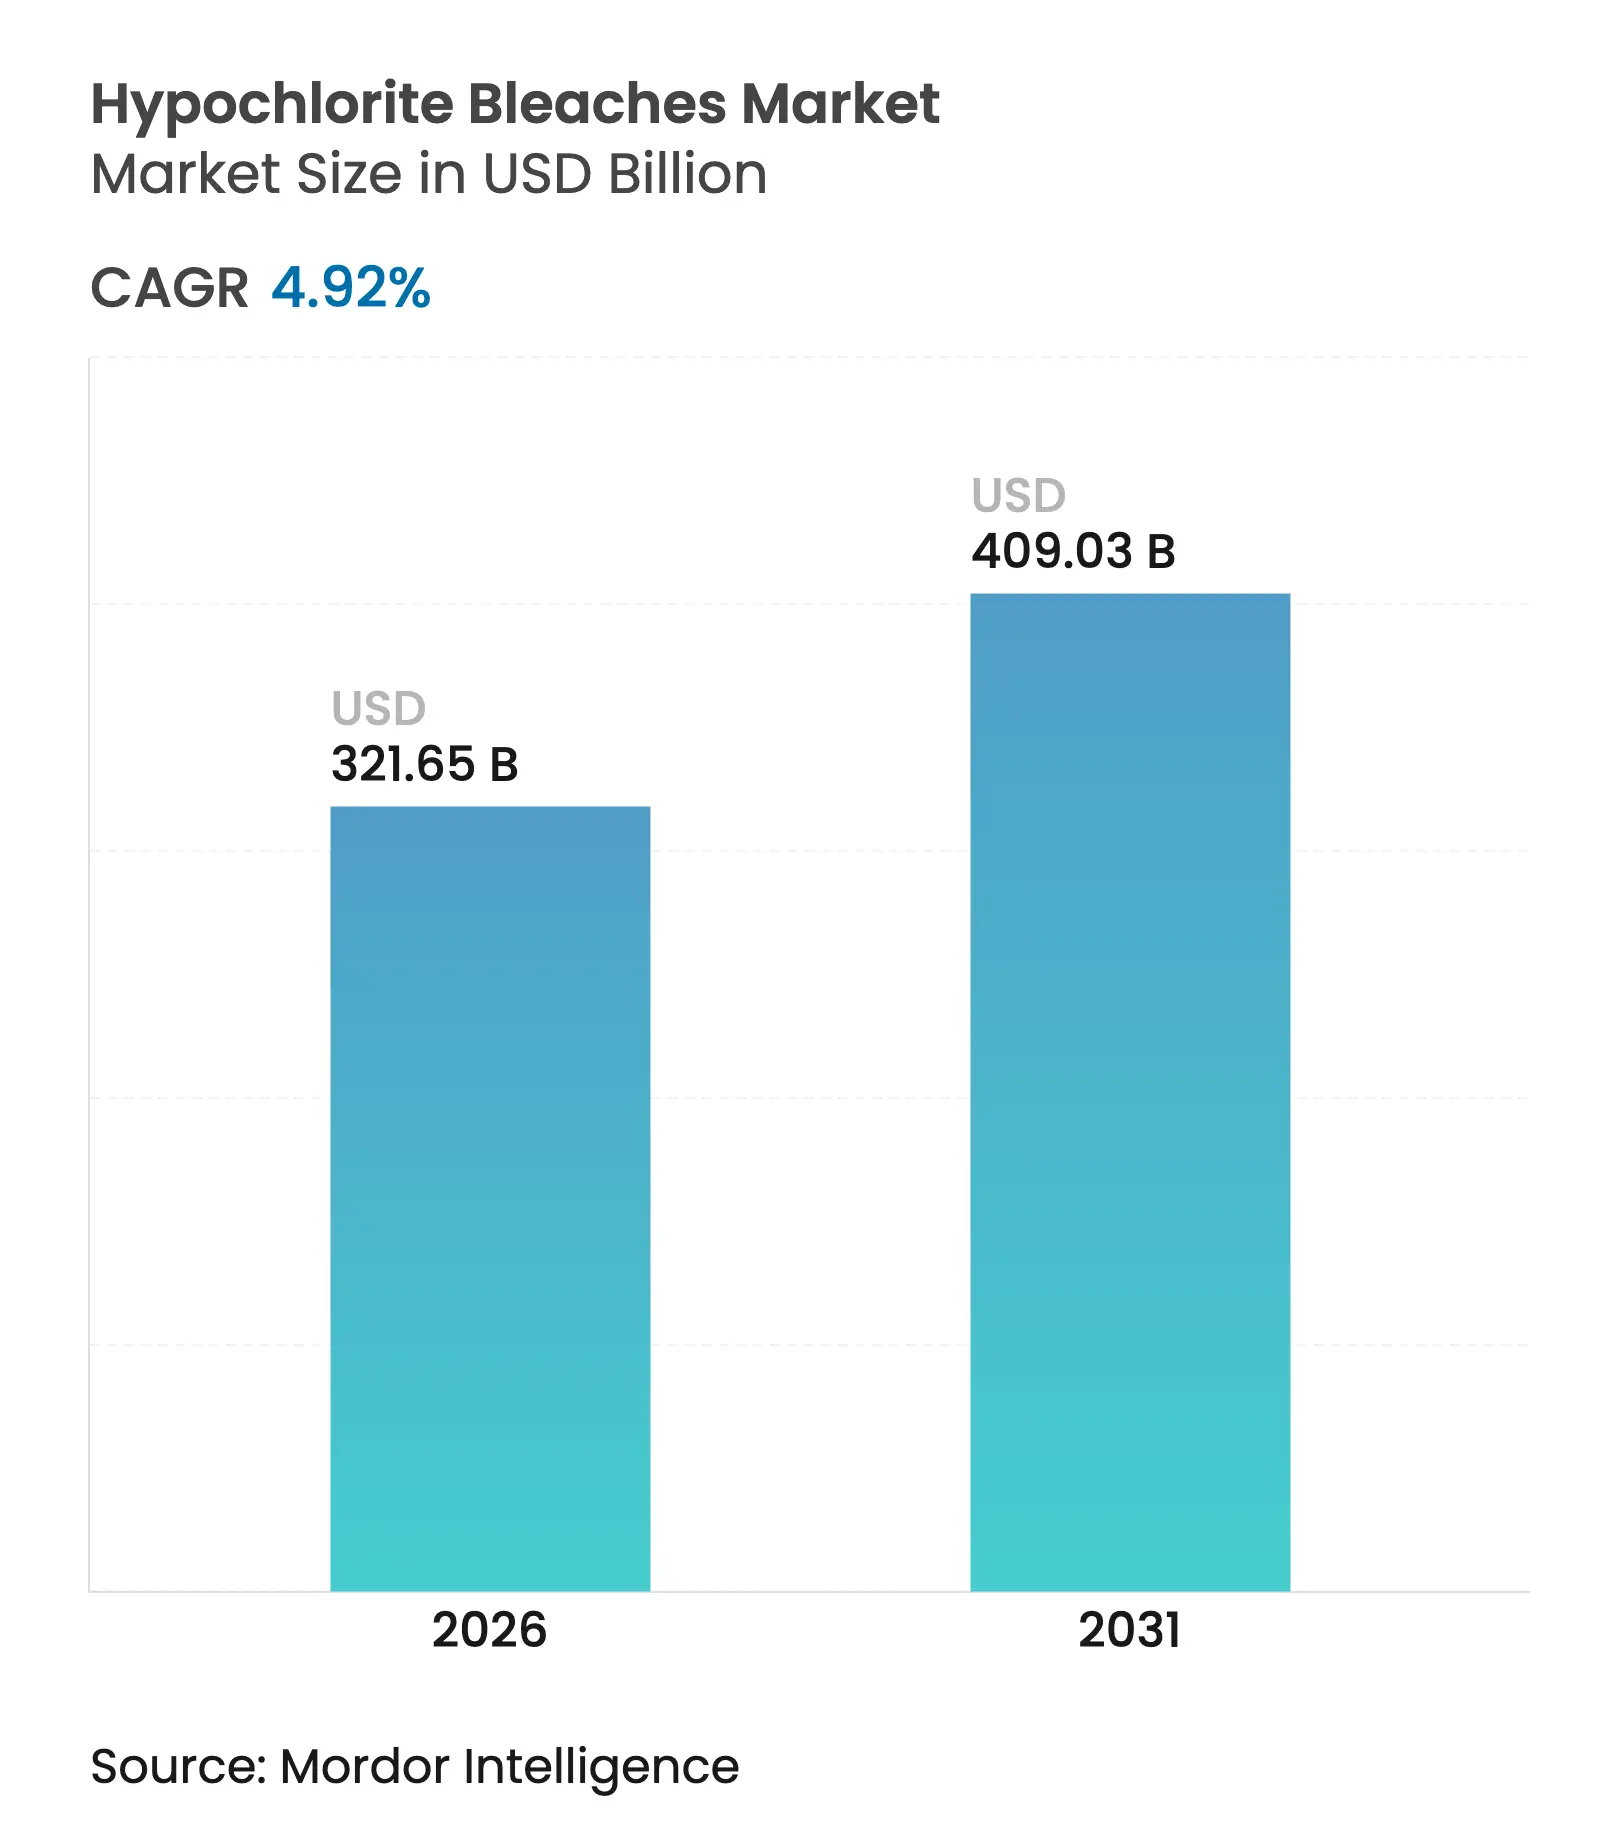
The Hypochlorite Bleaches market size is expected to grow from USD 306.57 billion in 2025 to USD 321.65 billion in 2026 and is forecast to reach USD 409.03 billion by 2031 at 4.92% CAGR over 2026-2031. Infrastructure spending on municipal water and wastewater systems, particularly in Asia Pacific, is vaulting demand as utilities transition from chlorine gas to safer sodium hypochlorite solutions. Investment in localized production—often upwards of USD 70 million per plant—also strengthens supply-chain resilience, while energy-efficient membrane-cell electrolysis is lowering power use by 15% compared with open-cell units. The Hypochlorite bleaches market further benefits from regulatory clarity: the EPA’s 2024 revisions streamline hypochlorite transport, and the European Union has authorized calcium hypochlorite biocidal product families through 2035, both of which favor solution adoption. Competitive pressures persist, however, as peroxide-based alternatives gain popularity in textile and pulp bleaching, and hazardous-materials rules raise handling costs for oxidizers.
Key Report Takeaways
Note: Market size and forecast figures in this report are generated using Mordor Intelligence's proprietary estimation framework, updated with the latest available data and insights as of 2026.
Driver Impact Analysis
| Driver | (~) % Impact on CAGR Forecast | Geographic Relevance | Impact Timeline | |||
|---|---|---|---|---|---|---|
Escalating water-treatment & sanitation spending
Escalating water-treatment & sanitation spending
| +1.2% | Global, with concentration in Asia Pacific and MEA | Medium term (2-4 years) |
(~) % Impact on CAGR Forecast
:
+1.2%
|
Geographic Relevance
:
Global, with concentration in Asia Pacific and MEA
|
Impact Timeline
:
Medium term (2-4 years)
|
Surging pulp & paper output in emerging Asia
Surging pulp & paper output in emerging Asia
| +0.8% | Asia Pacific core, spill-over to Latin America | Long term (≥ 4 years) | |||
Capacity additions in African textile finishing
Capacity additions in African textile finishing
| +0.5% | Sub-Saharan Africa, North Africa secondary | Medium term (2-4 years) | |||
Roll-out of on-site hypochlorite generators for remote
utilities
Roll-out of on-site hypochlorite generators for remote
utilities
| +0.9% | Global, early adoption in North America and Europe | Short term (≤ 2 years) | |||
Chlorine-gas phase-out regulations benefitting
hypochlorites
Chlorine-gas phase-out regulations benefitting
hypochlorites
| +1.1% | North America & EU primary, Asia Pacific following | Medium term (2-4 years) | |||
| Source: Mordor Intelligence | ||||||
Escalating Water-Treatment & Sanitation Spending
Global water-infrastructure outlays are trending toward USD 1 trillion by 2033, advancing at 5.9% and directly lifting the Hypochlorite bleaches market through higher municipal and industrial disinfection needs. India exemplifies this surge, as government programs such as Jal Jeevan Mission push the nation’s water-chemicals demand toward USD 2.8 billion by 2025. Remote facilities increasingly favor on-site sodium hypochlorite generation, eliminating chlorine-gas transport; Prague’s installation treats 3,000 L s⁻¹ while keeping residual chlorine within 0.2-0.4 ppm, protecting 800,000 residents. Smart dosing controls and AI-enabled telemetry are now common, cementing hypochlorite’s role in modern water grids.
Surging Pulp & Paper Output in Emerging Asia
China consumed 13 million t of wood pulp in 2024, over 60% imported, and India may require 9.2 million t by 2030, driving the Hypochlorite bleaches market across Asia’s paper mills[1]Food and Agriculture Organization, “Global Pulp and Paper Statistics,” fao.org. Trend analysis shows mills swapping chlorine gas for safer hypochlorite or chlorine-dioxide stages that cut effluent AOX while meeting brightness targets. Pilot studies by RISE reveal that optimized hypochlorite sequences preserve paper strength and curb chemical usage, providing mills with cost and compliance advantages. New capacity across Southeast Asia frequently incorporates membrane-based electrochlorination units, embedding hypochlorite supply within mill utilities.
Capacity Additions in African Textile Finishing
Textile investors diversifying sourcing away from Asia have earmarked Sub-Saharan Africa for dye-house expansions. Hypochlorite bleaching is winning share because tablet or granular calcium hypochlorite delivers high available-chlorine content with minimal infrastructure, suiting plants where skilled chemical handling is scarce. Comparative trials on cotton fabrics show chlorine-based baths achieving superior whiteness and tensile retention versus peroxide routes while reducing processing time. Combined with water-recycling equipment, the approach addresses cost and environmental constraints prevalent in the region.
Roll-out of On-Site Hypochlorite Generators for Remote Utilities
Membrane-cell units now reach 15% energy savings and cut salt input to 1.85 kg per kg of chlorine, sharply lowering OPEX and boosting the Hypochlorite bleaches market. De Nora has installed 20 CECHLO-MS systems across Hong Kong, each delivering 12.5% sodium hypochlorite for large-scale municipal plants. Healthcare settings follow suit: hospitals in Queensland deploy in situ eBooster technology to safeguard patients while consuming under 2 kWh day⁻¹. North American utilities, typified by Anchorage Water & Wastewater Utility, are likewise abandoning chlorine gas in favor of safer on-site hypochlorite production.
Restraint Impact Analysis
| Restraint | (~) % Impact on CAGR Forecast | Geographic Relevance | Impact Timeline | |||
|---|---|---|---|---|---|---|
Rising shift toward peroxide-based bleaching chemistries
Rising shift toward peroxide-based bleaching chemistries
| -0.7% | Global, concentrated in Europe and North America | Medium term (2-4 years) |
(~) % Impact on CAGR Forecast
:
-0.7%
|
Geographic Relevance
:
Global, concentrated in Europe and North America
|
Impact Timeline
:
Medium term (2-4 years)
|
Strict transport & storage rules for oxidising
chemicals
Strict transport & storage rules for oxidising
chemicals
| -0.4% | Global, with heightened impact in developed markets | Short term (≤ 2 years) | |||
Growth of advanced oxidative processes (ozone/AOP)
Growth of advanced oxidative processes (ozone/AOP)
| -0.3% | North America & EU primary, Asia Pacific emerging | Long term (≥ 4 years) | |||
Decarbonisation pressure on chlor-alkali value chain
Decarbonisation pressure on chlor-alkali value chain
| -0.5% | Europe primary, North America and Asia Pacific following | Long term (≥ 4 years) | |||
| Source: Mordor Intelligence | ||||||
Rising Shift Toward Peroxide-Based Bleaching Chemistries
Hydrogen peroxide decomposes into water and oxygen, eliminating chlorinated by-products and appealing to mills and dye-houses pursuing eco-labels. Advanced oxidation processes pairing UV/H₂O₂ or ozone outperform hypochlorite for difficult organics, nudging the Hypochlorite bleaches market toward specialty niches[2]American Chemical Society, “Peroxide Chemistry in Sustainable Processing,” acs.org. Premium textile houses in Europe already pay a sustainability premium for peroxide-bleached cotton, exerting market-share pressure on hypochlorite formulations.
Strict Transport & Storage Rules for Oxidizing Chemicals
DOT updates effective 2024 require enhanced packaging, labeling, and segregation for Division 5.1 oxidizers, inflating logistics costs for bulk hypochlorite shipments. Tank-car designs face new inspection protocols, and carriers must post OXIDIZER placards, constraining intermodal efficiencies. Such hurdles accelerate on-site generation adoption, altering distribution patterns within the Hypochlorite bleaches market.
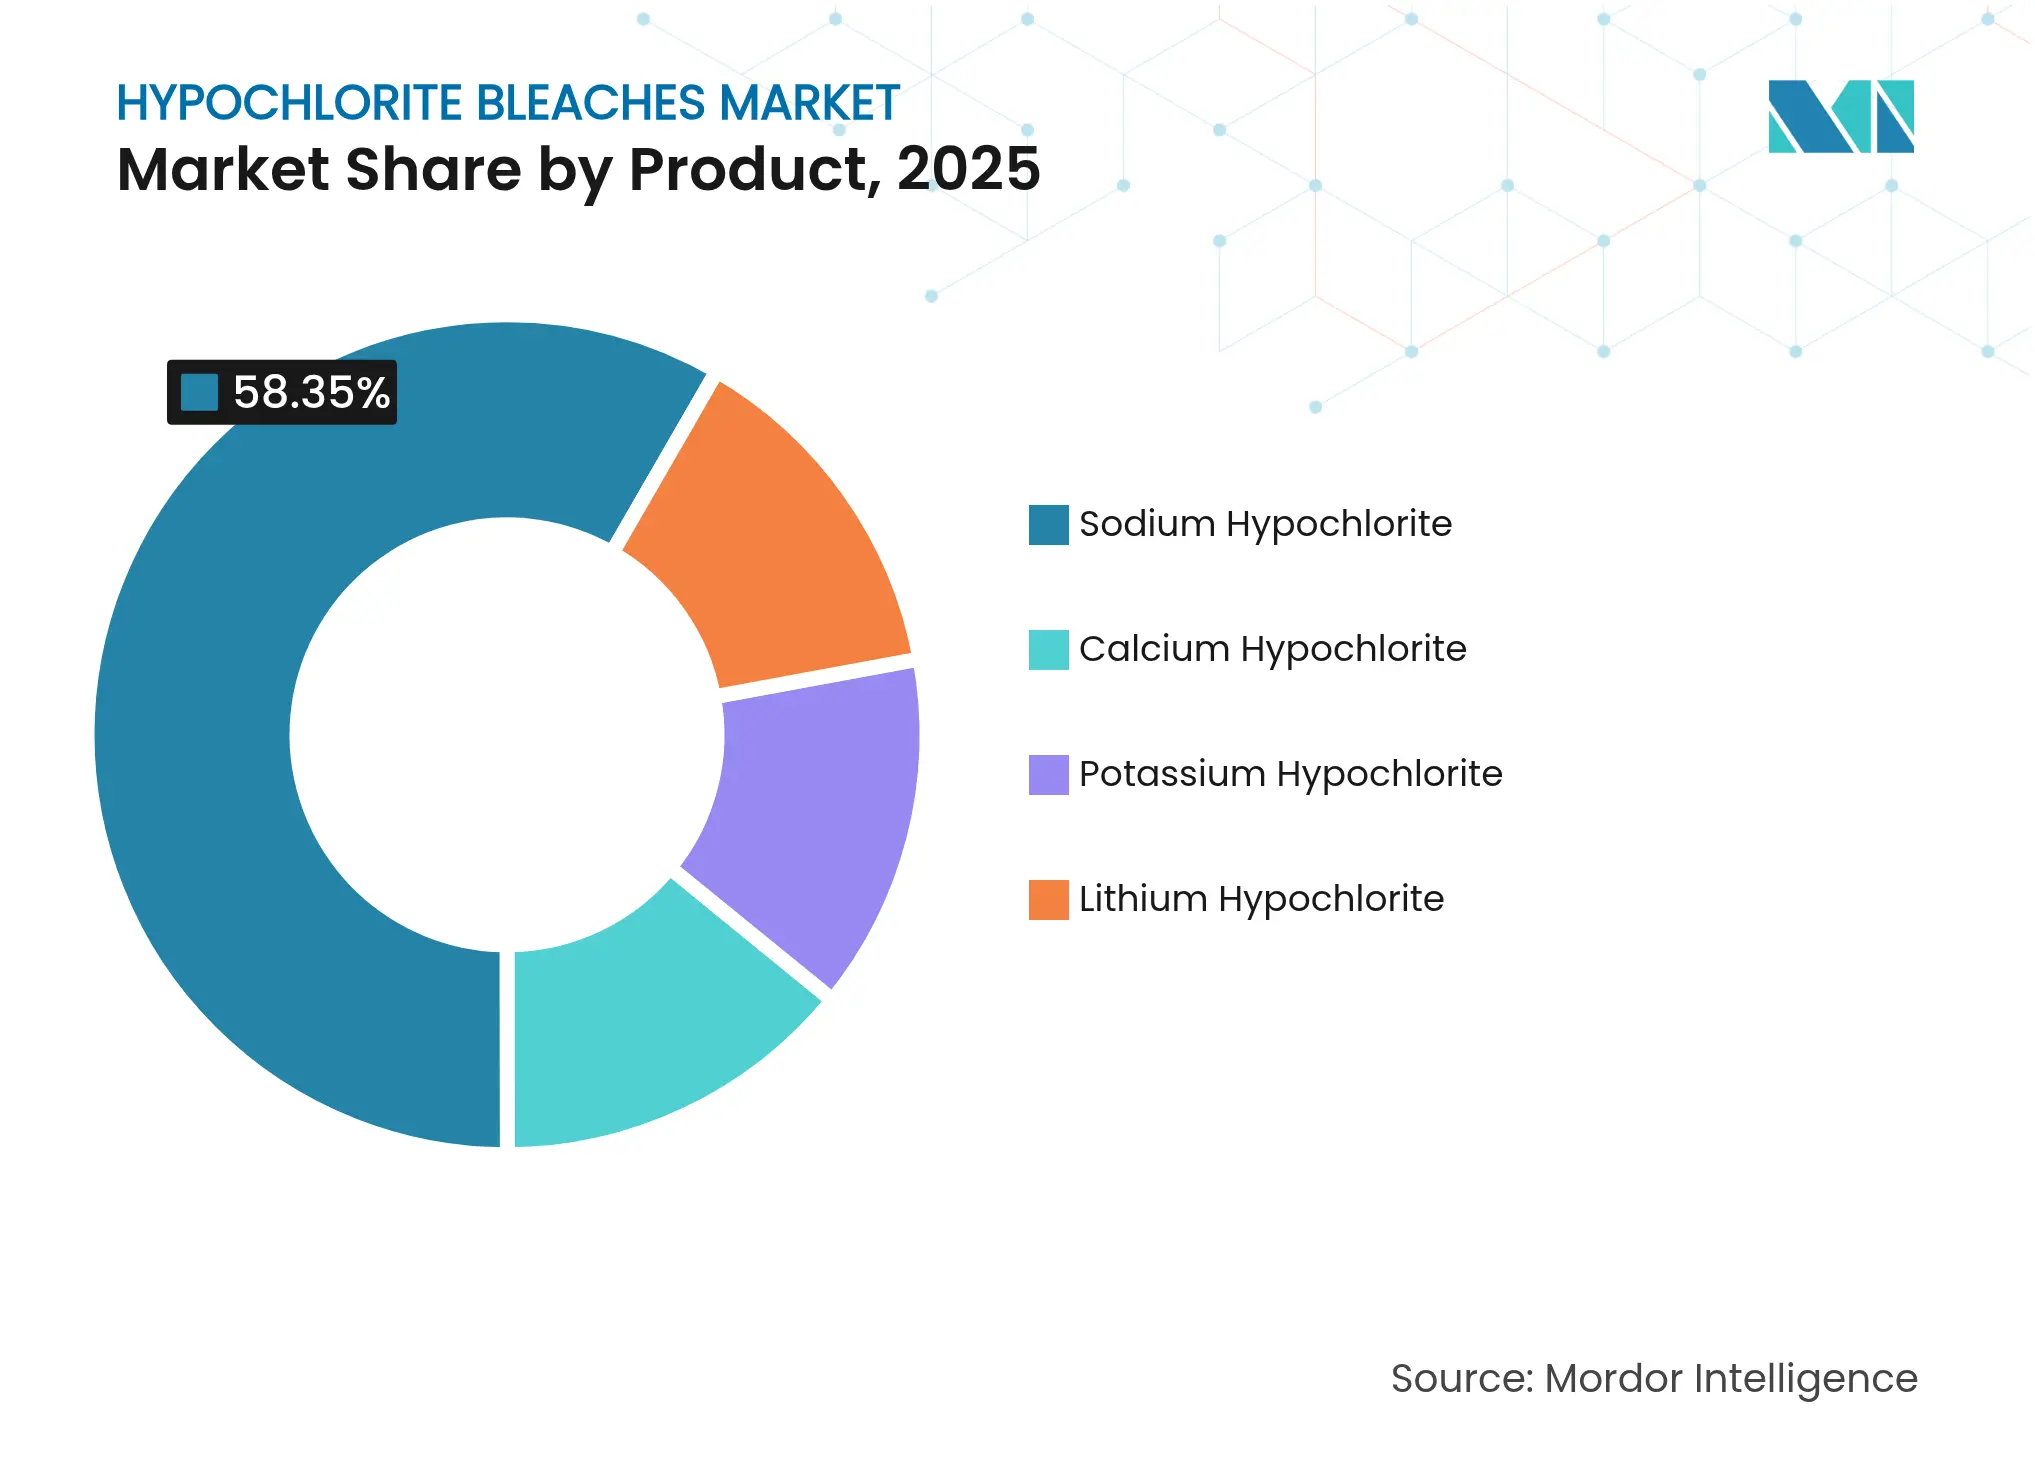
By Product: Sodium Dominates Yet Calcium Accelerates
Sodium hypochlorite contributed 58.35% to the Hypochlorite bleaches market in 2025, supported by entrenched use in municipal disinfection and household cleaning. Calcium hypochlorite, however, is forecast to grow 5.51% annually, buoyed by its EU authorization for pool and potable-water treatment through 2035.
Sodium’s supremacy rests on liquid supply chains and maturing on-site generation. Membrane-cell systems uplift concentration to 7% w/w with 15% lower electricity bills, enriching the Hypochlorite bleaches market size for plant operators investing in electrochemical upgrades. Conversely, calcium’s stability and 65-70% available chlorine endear it to remote installations needing long shelf life. Lithium and potassium salts remain niche, limited by cost and specialized industrial needs.
Note: Segment shares of all individual segments available upon report purchase
By Form: Liquid Leads While Solid Gains Ground
Liquid variants held 73.10% share of the Hypochlorite bleaches market in 2025, reflecting dosing precision in automated plants. Typical commercial grade contains 12.5-15% available chlorine, although aging elevates chlorate risk and compels freshness-management solutions.
Solid forms—granules, powder, and tablets—are climbing at a 5.62% CAGR thanks to shipping efficiency and storage stability, especially for disaster response, aquaculture, and rural water schemes. The Hypochlorite bleaches market size for calcium hypochlorite tablets is expanding as fish farms adopt controlled-release blocks that maintain free chlorine within pathogen-control thresholds.
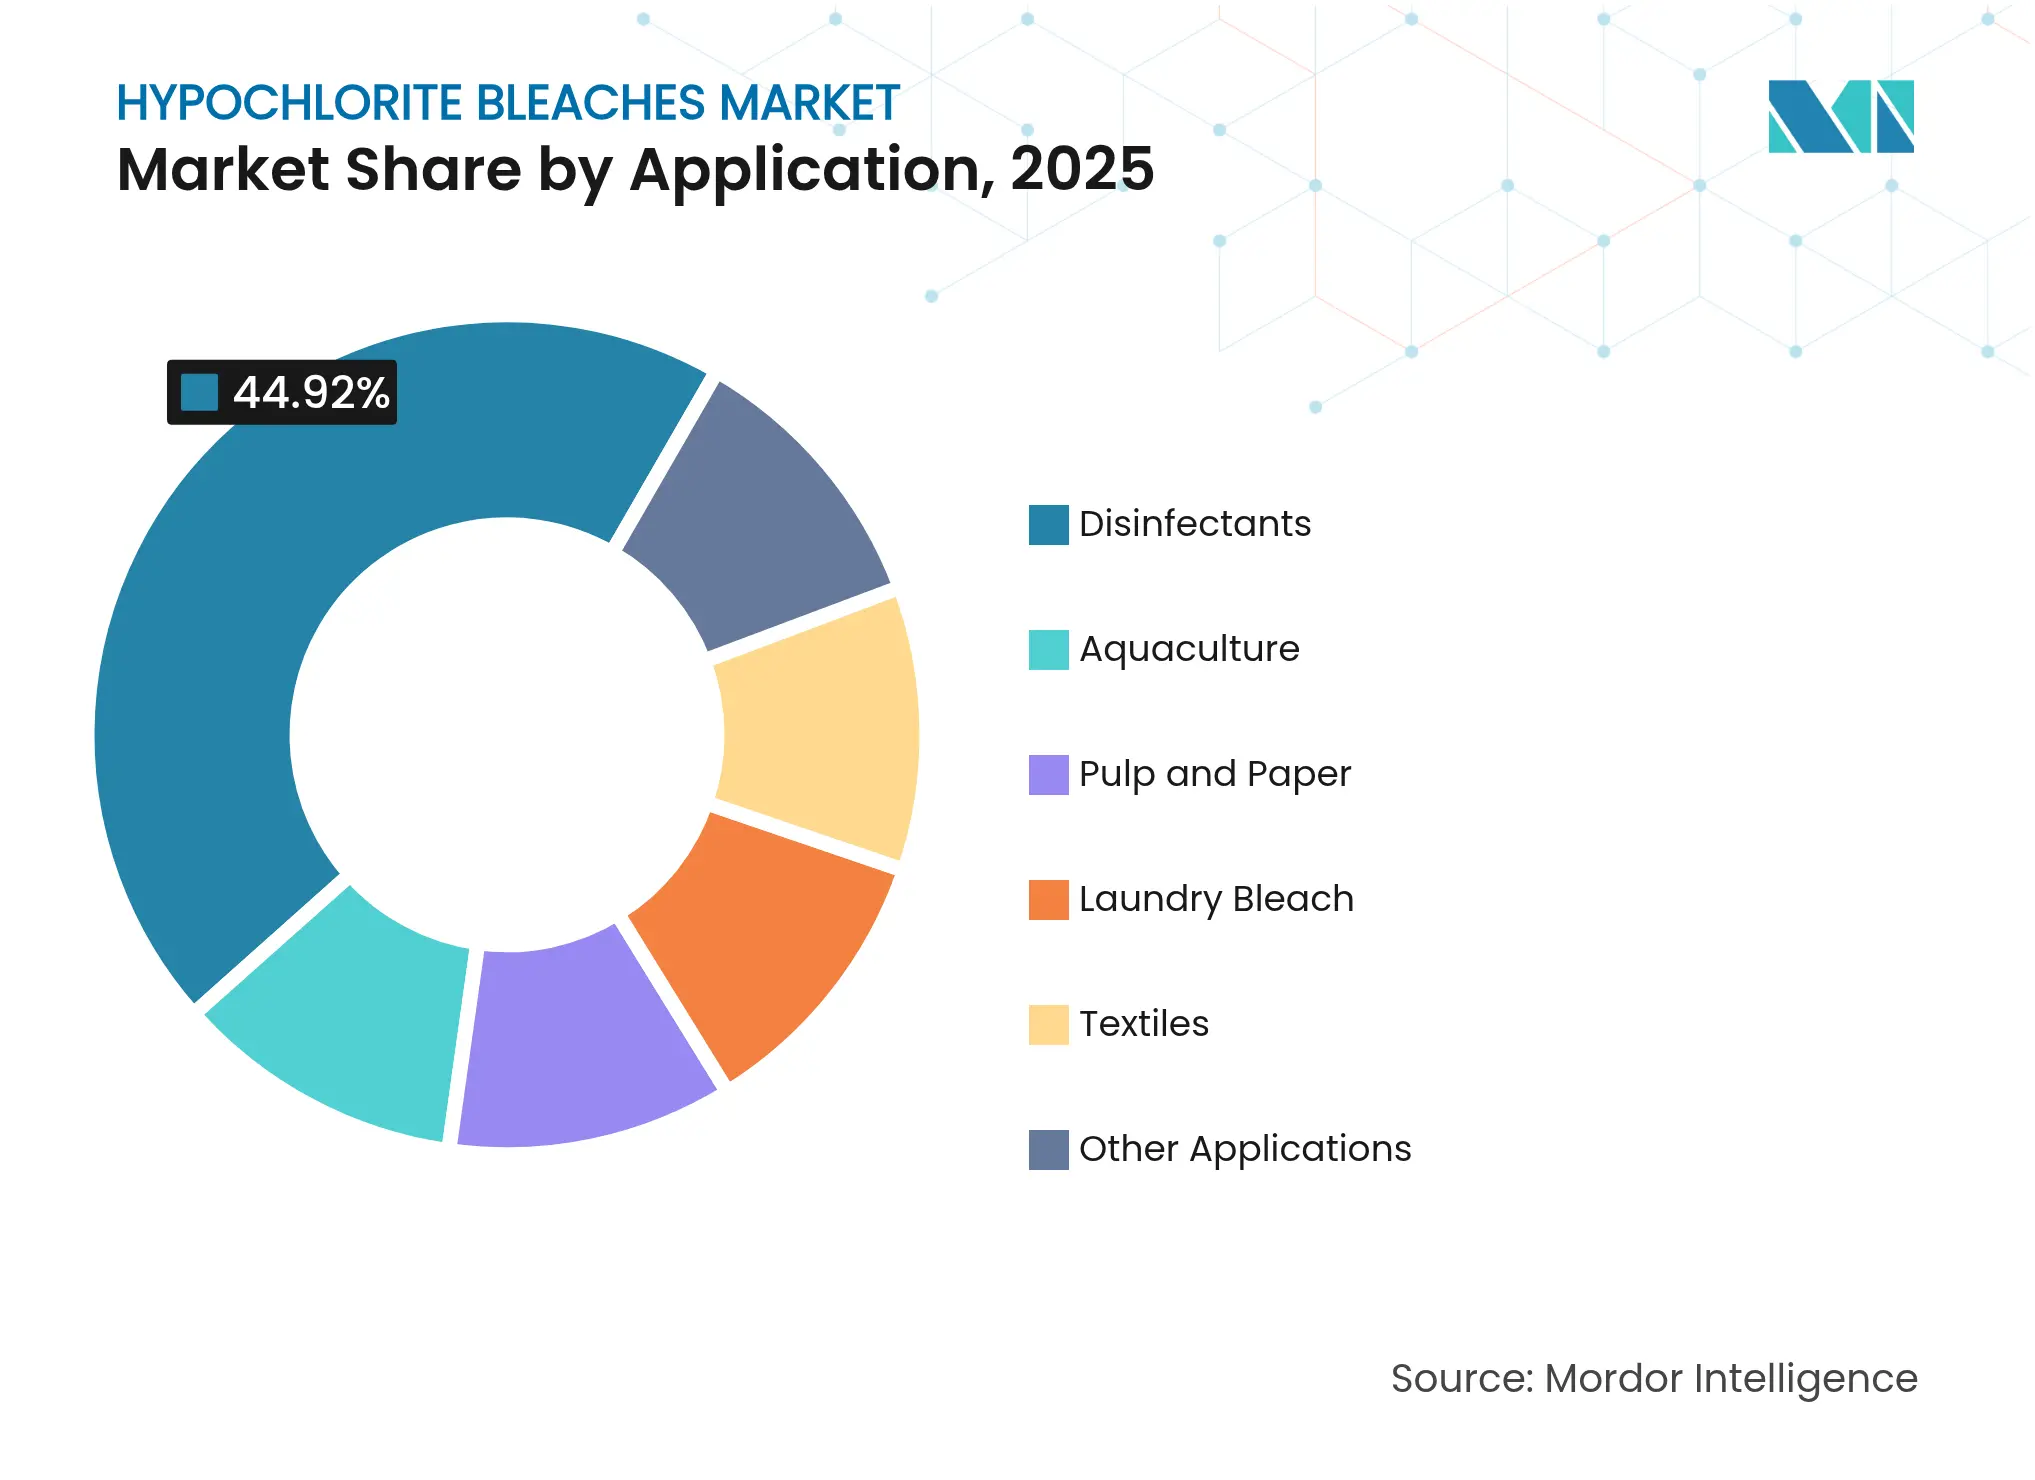
By Application: Disinfectants Anchor Revenue, Aquaculture Surges
Disinfectants accounted for 44.92% of Hypochlorite bleaches market size in 2025, encompassing potable-water treatment, swimming-pool sanitation, and industrial hygiene. The CDC’s 2024 Model Aquatic Health Code still mandates chlorine-based disinfection, reinforcing steady demand.
Aquaculture is projected to grow 5.74% per year through 2031. Laboratory work shows 250 ppm sodium hypochlorite for 30 minutes eradicates Vibrio anguillarum, raising interest among high-density fish farms. Pulp, textile, and laundry uses persist but face substitution pressure from peroxide and enzyme technologies.
Note: Segment shares of all individual segments available upon report purchase
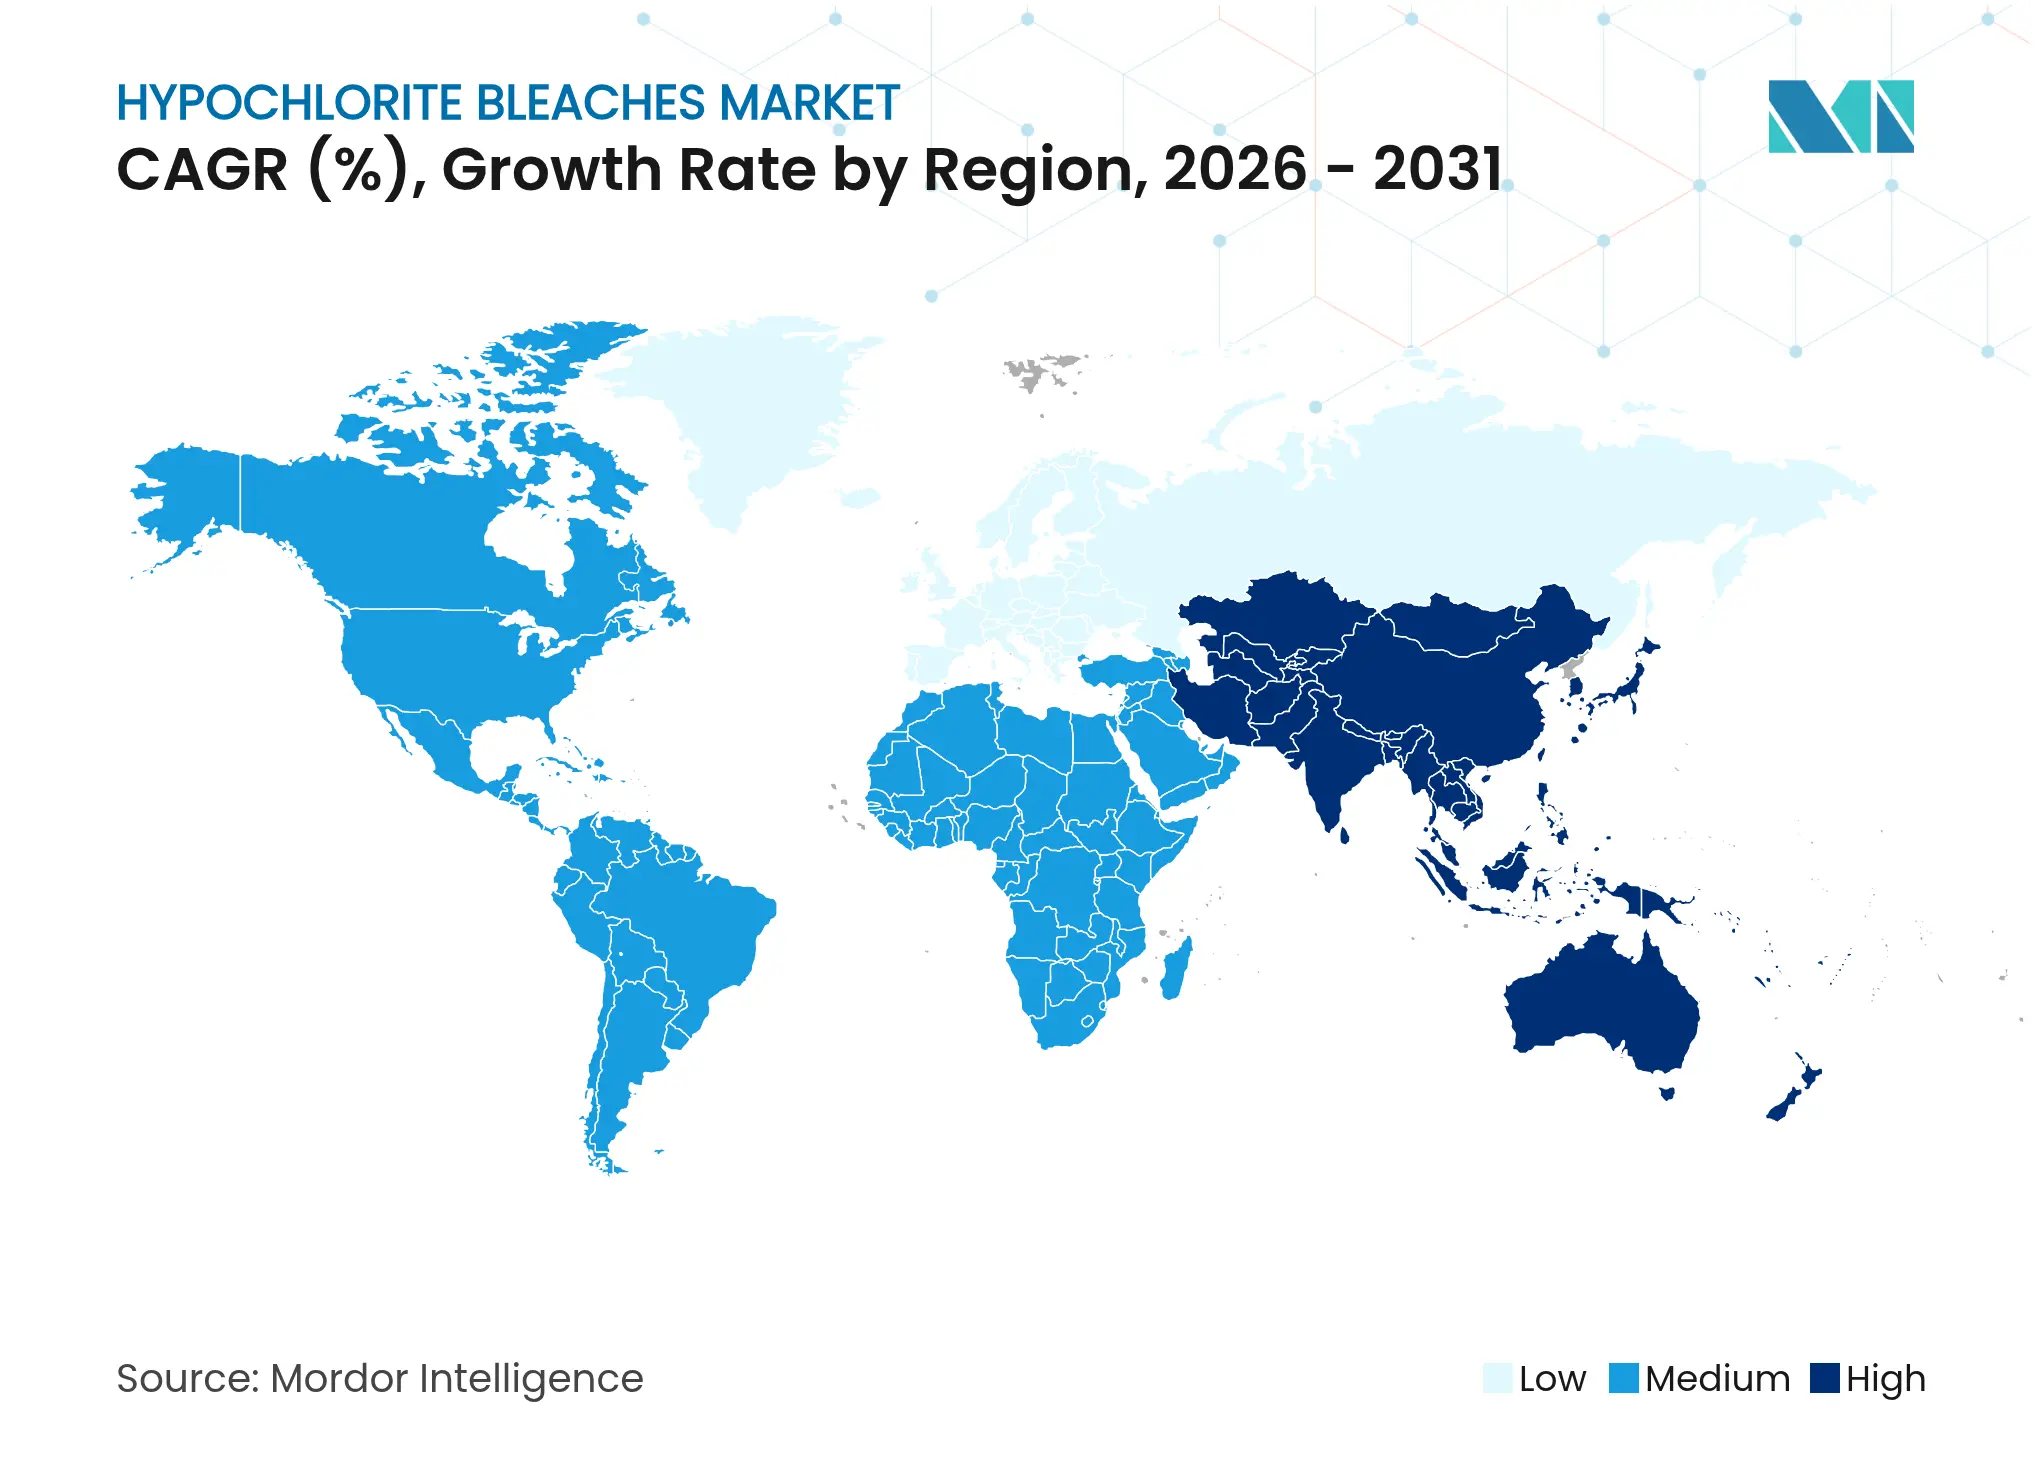
Asia Pacific generated 43.05% of Hypochlorite bleaches market revenue in 2025 and will likely rise at 5.43% CAGR to 2031 as governments channel record sums into water networks and as regional pulp mills pivot to safer bleaching routes. China’s paper industry alone consumes 13 million t of wood pulp yearly, creating a sizable pull for hypochlorite solutions. India’s Jal Jeevan Mission stokes chemical demand while De Nora’s 20-unit CECHLO deployment in Hong Kong shows municipal enthusiasm for on-site generation.
North America is a mature yet evolving arena for the Hypochlorite bleaches market. The EPA’s 2024 hazmat rules tighten chlorine-gas usage, catalyzing a wave of USD 70 million-plus local bleach plants and buoying revenue at integrated producers; Olin’s Chlor Alkali segment topped USD 924.5 million in Q1 2025, up 4.5% year on year. Membrane-cell retrofits bolster energy efficiency, ensuring domestic competitiveness.
Europe faces decarbonization pressure worth an estimated USD 550 billion across the chlor-alkali chain, yet regulatory backing for hypochlorite continues via calcium authorization. Prague’s conversion to on-site sodium hypochlorite highlights safety gains, processing 3,000 L s⁻¹ for 800,000 residents. The Middle East and Africa are nascent, but textile-finishing investments and water-scarcity countermeasures suggest above-average growth potential for the Hypochlorite bleaches market.
Market Concentration
Competition shows moderate concentration as integrated chlor-alkali majors square off against electrochlorination specialists. Olin Corporation, Occidental Chemical, and Lonza Group exploit scale and captive chlorine feedstocks, whereas De Nora and Electrolytic Technologies differentiate through equipment packages that couple chemical supply with on-site generators. ANSA McAL’s USD 327 million move for BLEACHTECH illustrates regional consolidation aimed at pairing Caribbean chlorine output with U.S. high-purity bleach demand.
Technical leadership increasingly revolves around membrane-cell stacks that shrink salt use to 1.85 kg kg⁻¹ Cl₂ and trim CO₂ footprints by 15%. Research into low-carbon electrochemical synthesis claims 90% emission cuts over mercury or diaphragm routes, potentially transforming the Hypochlorite bleaches market. Patent filings on hypochlorous acid for metal leaching and novel water-treatment pathways open ancillary revenue streams, while seawater electrolysis prototypes could disrupt coastal utilities by supplying chlorine in situ. Success hinges on bundling equipment, chemistry, and digital telemetry into turnkey offerings that help utilities meet safety and sustainability targets.

*Disclaimer: Major Players sorted in no particular order
1. Introduction
2. Research Methodology
3. Executive Summary
4. Market Landscape
5. Market Size and Growth Forecasts(Value)
6. Competitive Landscape
7. Market Opportunities and Future Outlook
The hypochlorite bleaches market report includes:
Strategic Expansion of Floor Coatings in the MEIA Region
4 Min Read
Unlocking Supplier Partnerships in the Africa Lubricants Market
5 Min Read
US Market Entry for Taiwanese Machine Tool Manufacturers
5 Min Read
When decisions matter, industry leaders turn to our analysts. Let’s talk.