Optical Coherence Tomography (OCT) Market Size and Share
Market Overview
| Study Period | 2020 - 2031 |
|---|---|
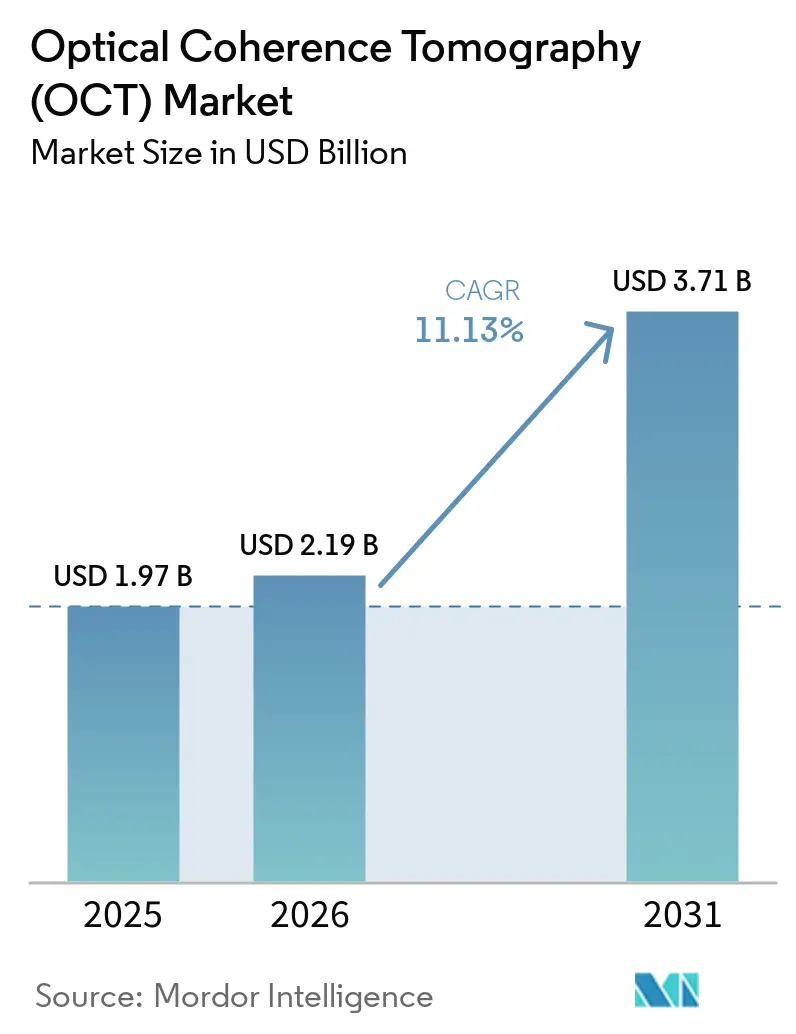
| Market Size (2026) | USD 2.19 Billion |
| Market Size (2031) | USD 3.71 Billion |
| Growth Rate (2026 - 2031) | 11.13% CAGR |
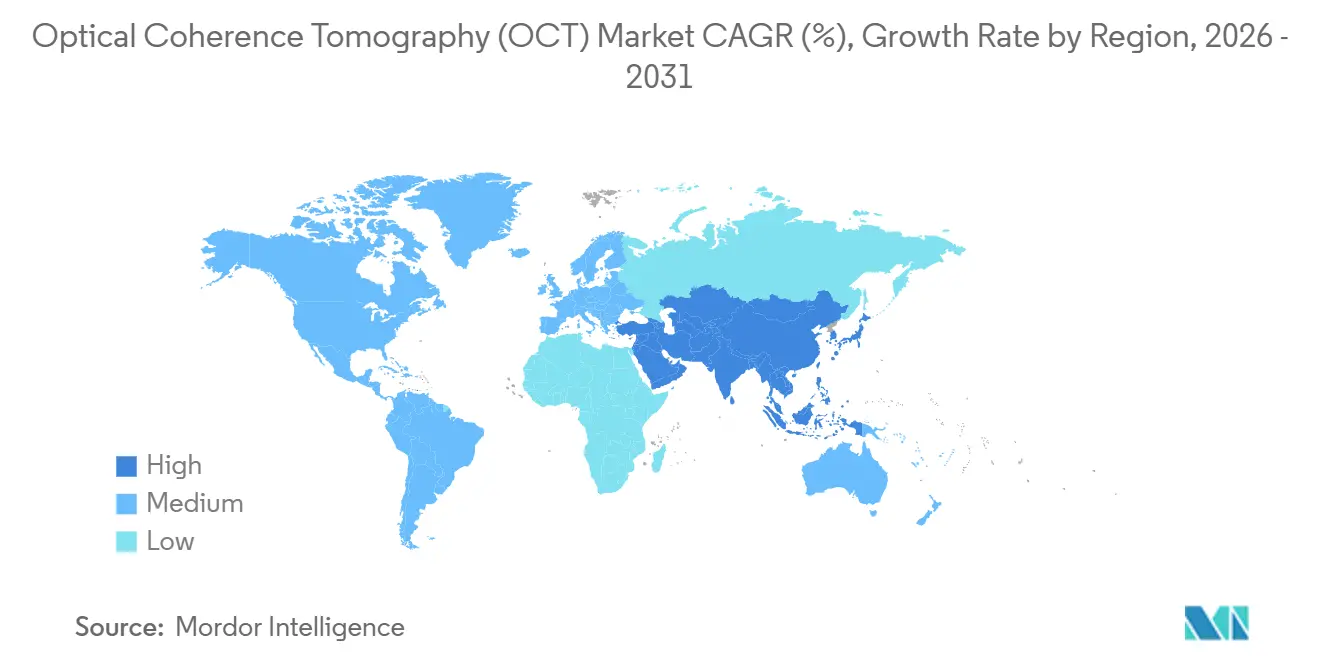
| Fastest Growing Market | Asia Pacific |
| Largest Market | North America |
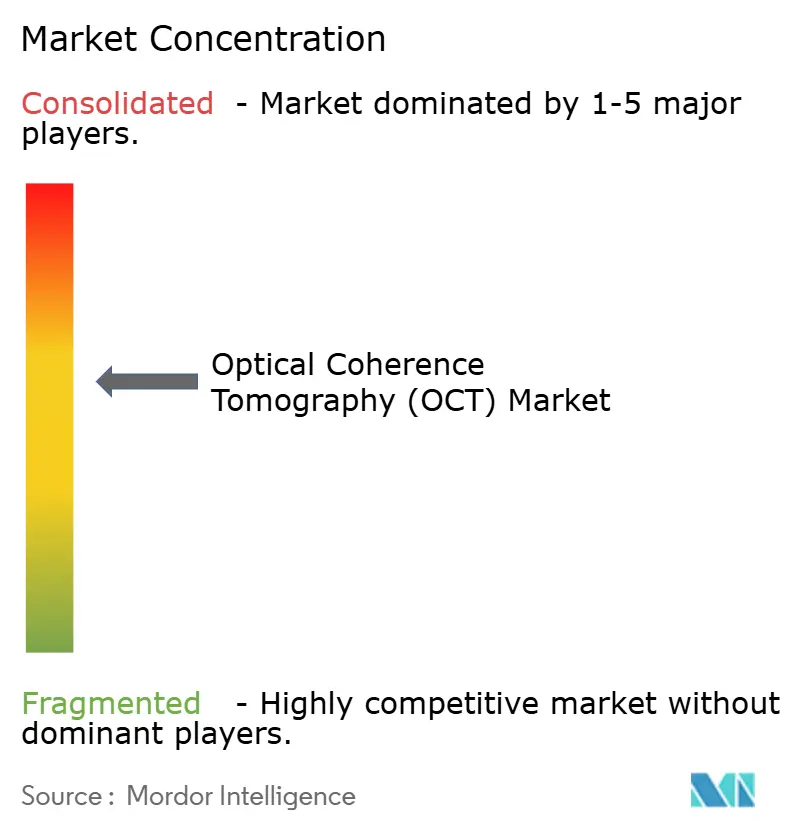
| Market Concentration | Medium |
Major Players *Disclaimer: Major Players sorted in no particular order Image © Mordor Intelligence. Reuse requires attribution under CC BY 4.0. | |
Optical Coherence Tomography (OCT) Market Analysis by Mordor Intelligence
The Optical Coherence Tomography (OCT) Market size was valued at USD 1.97 billion in 2025 and is estimated to grow from USD 2.19 billion in 2026 to reach USD 3.71 billion by 2031, at a CAGR of 11.13% during the forecast period (2026-2031). Momentum stems from artificial-intelligence integration, miniaturized hardware, and growing adoption beyond ophthalmology into cardiology, dermatology, and oncology. Swept-source laser innovations accelerate imaging speed while AI algorithms automate biomarker extraction, shortening diagnostic workflows. In parallel, the FDA’s predetermined change-control plan framework for AI devices is lowering regulatory friction, allowing faster commercial upgrades. Expanding geriatric populations drive sustained demand for OCT-based screening of age-related macular degeneration and diabetic retinopathy. Supply-chain vulnerabilities, however, persist around swept-source laser diodes, exposing manufacturers to semiconductor shortages and geopolitical tensions.
Key Report Takeaways
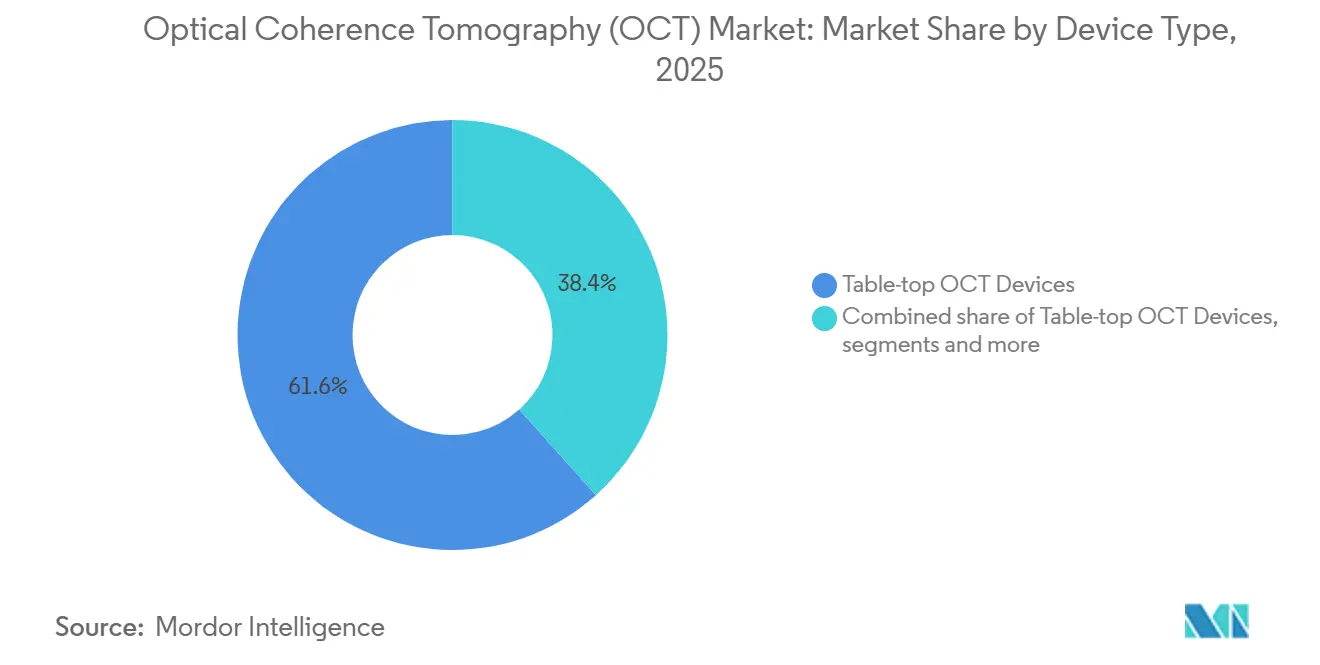
- By device type, table-top systems commanded 61.62% of the Optical Coherence Tomography (OCT) market share in 2025, while handheld devices are forecast to grow at a 13.02% CAGR to 2031.
- By technology, spectral-domain systems held 66.75% of the Optical Coherence Tomography (OCT) market share in 2025; swept-source platforms are expanding at a 12.31% CAGR through 2031.
- By modality, structural imaging contributed 54.11% of the Optical Coherence Tomography (OCT) market share in 2025, whereas OCT-angiography is advancing at a 11.88% CAGR to 2031.
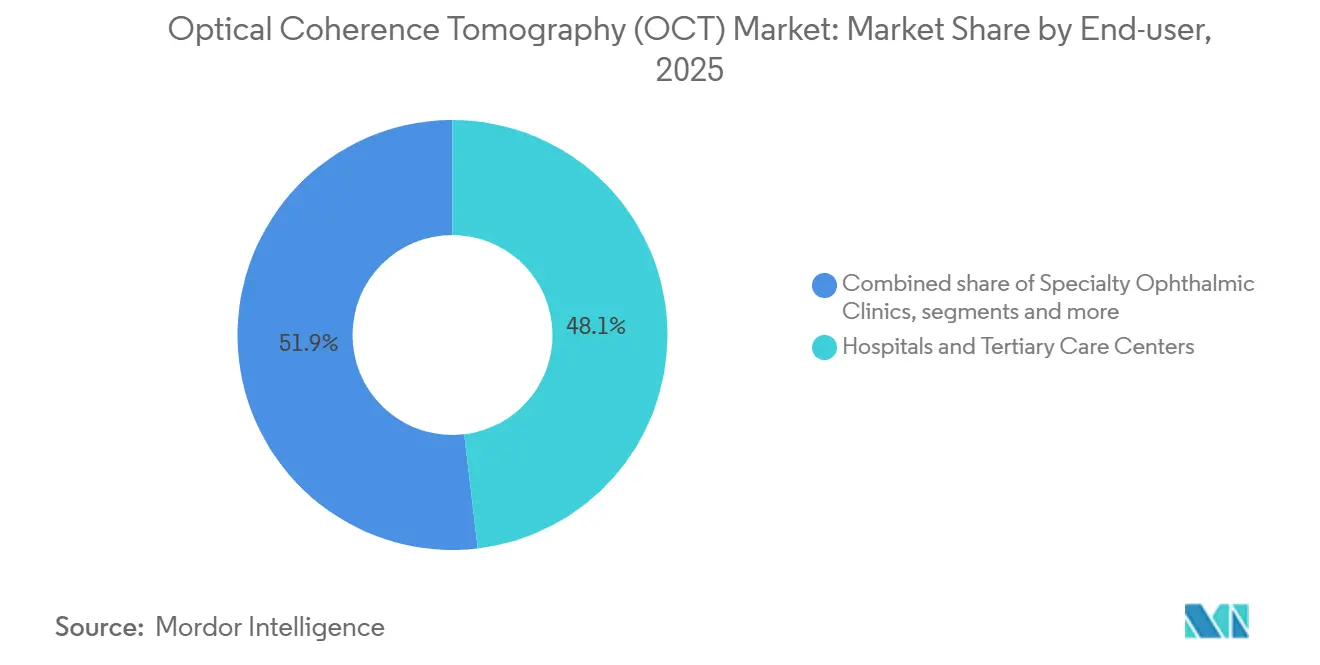
- By end-user, hospitals and tertiary centers accounted for 48.12% share of the Optical Coherence Tomography (OCT) market size in 2025, while ambulatory cath labs record the fastest CAGR of 13.79% through 2031.
- By geography, Asia-Pacific is the fastest-growing region at 15.06% CAGR, whereas North America remained the largest regional contributor with 42.33% of the Optical Coherence Tomography (OCT) market size in 2025.
Note: Market size and forecast figures in this report are generated using Mordor Intelligence’s proprietary estimation framework, updated with the latest available data and insights as of 2026.
Global Optical Coherence Tomography (OCT) Market Trends and Insights
Drivers Impact Analysis*
| Driver | (~) % Impact on CAGR Forecast | Geographic Relevance | Impact Timeline |
|---|---|---|---|
| AI-enabled quantitative biomarkers | +2.1% | Global (early US/EU) | Medium term (2-4 years) |
| Miniaturized, point-of-care OCT | +1.8% | Global (notably APAC) | Short term (≤ 2 years) |
| Geriatric eye-disease burden | +2.3% | Global | Long term (≥ 4 years) |
| Rapid SS-OCT uptake in cardiology & oncology | +1.9% | US/EU, expanding APAC | Medium term (2-4 years) |
| Reimbursement expansion | +1.2% | US/EU | Short term (≤ 2 years) |
| Integration with robotic surgery | +1.4% | US/EU, select APAC | Medium term (2-4 years) |
| Source: Mordor Intelligence | |||
AI-enabled quantitative biomarkers unlock new clinical indications
AI transforms OCT from descriptive imaging to predictive diagnostics. More than 1,000 AI-enabled medical devices have received FDA clearance, including the Notal Vision Home OCT platform. Zeiss launched its Research Data Platform in 2025 to automate data capture and analytics, supporting rapid research cycles. Recent Nature studies show retinal microvascular metrics derived from OCT-angiography can stratify cardiovascular risk with high accuracy. Oncology research demonstrates virtual biopsies with micro-registered OCT reduce invasive excisions while maintaining 95.5% accuracy in basal cell carcinoma detection. Collectively, these advances expand the OCT market by opening new reimbursement pathways and specialty demand.
Miniaturized, point-of-care OCT broadens primary-care and ER use
Handheld devices shrink form-factors without sacrificing image quality. Optomed’s Aurora AEYE camera, cleared by the FDA in 2024, enables non-dilated diabetic-retinopathy screening in family clinics with 92–93% sensitivity.[1]Optomed, “Primary care gets transformative tool to detect diabetic retinopathy,” optomed.com AI Optics’ Sentinel scanner ships with embedded analytics and EHR connectivity to streamline referrals. Research teams at the University of Southern California prototype portable OCT otoscopes delivering 38-µm resolution of the middle ear. A USD 20 million ARPA-H grant to Washington University funds photonic-integrated-circuit OCT systems targeting 50-fold speed gains, signalling sustained innovation investment. These solutions mitigate specialist shortages in rural settings and reinforce long-term volume growth for the OCT market.
Geriatric eye-disease burden (AMD, glaucoma, DR)
Population aging drives structural demand. At least 2.2 billion people live with vision impairment and 90% reside in low- and middle-income regions. The UN expects Asia-Pacific residents aged ≥ 60 to double from 630 million in 2023 to 1.3 billion by 2050. Home-based systems such as Notal Vision’s SCANLY enable wet-AMD monitoring, with 96% of patients successfully self-imaging in multi-center trials. AI algorithms now detect mild diabetic retinopathy with 88% sensitivity and 94% specificity, outperforming human graders. Intraoperative OCT further boosts adoption: a 2025 Brazilian study reported 92% macular-hole closure with only 3.24 minutes of added surgical time.
Rapid adoption of SS-OCT in cardiology & oncology
Guideline inclusion accelerates interventional usage. Abbott’s ILUMIEN IV and OCTOBER trials showed OCT-guided PCI reduced major adverse cardiac events by 28% versus angiography alone. Consequently, 2023 ESC and ACC/AHA recommendations list OCT as preferred intravascular imaging modality. Oncology momentum grows through Perimeter Medical’s B-Series OCT, which filed PMA in 2025 after demonstrating lower positive-margin rates in breast-conserving surgery. These data points enlarge clinical demand and propel the OCT market forward.
Restraints Impact Analysis*
| Restraint | (~) % Impact on CAGR Forecast | Geographic Relevance | Impact Timeline |
|---|---|---|---|
| High capital cost & learning curve | -1.7% | Global (emerging markets) | Short term (≤ 2 years) |
| Patchy reimbursement in dermatology & dental | -0.9% | US/EU | Medium term (2-4 years) |
| Supply-chain dependence on swept-source | -1.2% | Global manufacturing hubs | Short term (≤ 2 years) |
| Regulatory hurdles for AI algorithms | -0.8% | Worldwide | Medium term (2-4 years) |
| Source: Mordor Intelligence | |||
High capital cost and steep learning curve
Acquisition prices remain substantial, limiting uptake in lower-income regions. Zeiss reported a 3% revenue decline in China during fiscal 2024 as hospitals deferred big-ticket imaging purchases. Operator training needs add friction: interventionalists cite skill deficits as a barrier to routine OCT-guided PCI despite proven outcomes. Health-spending disparities are stark; OECD data show lower-middle-income Asia-Pacific countries invest USD 285 per capita compared to USD 3,891 in high-income peers. These economic and educational gaps temper near-term growth even as longer-term benefits remain clear.
Supply-chain dependence on swept-source lasers
Swept-source lasers require specialized wafers and epitaxial structures. The FDA flagged medical-device supply vulnerabilities in a 2025 report, noting that component shortages disproportionately impact imaging equipment for vulnerable patients. Semiconductor bottlenecks mirror microLED challenges delaying Osram’s USD 1 billion fab until late 2025. Geopolitical restrictions on germanium exports prompted LightPath Technologies to seek alternative chalcogenide glass materials. Manufacturers have started consolidating suppliers and relocating distribution centers, actions that create short-term disruption but aim to strengthen resilience.
*Our forecasts treat driver/restraint impacts as directional, not additive. The impact forecasts reflect baseline growth, mix effects, and variable interactions.
Segment Analysis
By Device Type: Point-of-care tools energize growth
Table-top systems retained 61.62% revenue share in 2025 because retina specialists and tertiary hospitals rely on high-resolution imaging to guide therapy. In contrast, handheld units are growing at 13.02% CAGR through 2031 as primary-care adoption widens and emergency rooms seek rapid triage capability. Handheld devices provide clinicians with sub-10-second acquisition and AI-guided interpretation, eliminating the need for dilation in diabetic-eye screening. Catheter-based intravascular OCT remains small yet essential; Abbott’s Dragonfly OpStar catheter improved deliverability in tortuous coronary anatomy while sharpening image fidelity. The OCT market continues to bifurcate between full-feature consoles and ultralight probes that fit tight budgets or portable workflows.
The transition toward miniaturization mirrors broader telehealth trends. Research prototypes that integrate photonic-integrated circuits promise to slash component counts and cost, encouraging mass-volume production. AI-embedded handhelds reduce operator dependency by automating segmentation and diagnosis, which lowers training barriers for family physicians. This accessibility builds incremental procedure volume that directly enlarges the OCT market, especially in regions with sparse specialist coverage.


By Technology: Swept-source momentum accelerates
Spectral-domain systems dominated with 66.75% market share in 2025, supported by mature reimbursement codes and established clinical guidelines. Swept-source platforms, however, are pacing at a 12.31% CAGR to 2031 thanks to deeper tissue penetration, higher scan speeds, and artifact reduction. The OCT market size derived from swept-source revenue is anticipated to expand to USD 1.59 billion by 2031, reflecting rapid cath-lab and oncology deployment. Component innovation from Thorlabs, which released MEMS-VCSEL lasers sweeping up to 1 MHz, underpins this growth. Superluminescent diodes are gaining favor as low-coherence sources for dermatology, reducing speckle without costly tunable lasers.
Photonic-integrated-circuit advances may eventually democratize swept-source performance within compact footprints. Coherent reported double-digit growth in health-care optics on the back of AI server demand, suggesting cross-sector economies of scale will lower OCT bill-of-materials over time. Vendors retrofit spectral-domain consoles with speed-boosting upgrades to defend installedbases; Heidelberg Engineering’s SHIFT firmware halves scan acquisition time, illustrating how incumbents extend product lifecycles without hardware swaps. These combined dynamics keep spectral-domain units relevant while redirecting new capital expenditure toward swept-source innovations that future-proof clinical workflows.
By Modality: OCT-angiography reshapes vascular assessment
Structural imaging accounted for 54.11% revenue in 2025, serving as the default for retina, glaucoma, and anterior-segment evaluations. OCT-angiography is outpacing all other modalities at a 11.88% CAGR because it visualizes retinal and choroidal blood flow without dye, reducing adverse-event risk. Medicare introduced CPT 92137 in 2025, formally reimbursing OCTA, and the service limit policy now under review is expected to unlock utilisation among retina practices. Quantitative microvascular metrics generated by AI enhance cardiovascular-risk stratification, leading cardiology groups to integrate retinal OCTA screening into preventive clinics. Polarisation-sensitive and functional Doppler variants remain research-heavy, yet interest is climbing in neurology for early Alzheimer’s vascular biomarkers.
Rapid algorithmic segmentation permits fluid-volume quantification in neovascular AMD with excellent agreement versus manual grading, shortening visit times and improving treatment adherence. Expansion into brain science, as documented in recent PMC reviews, signals broader neurologic relevance that will further enlarge the OCT market.
By End-User: Ambulatory centers gain momentum
Hospitals and tertiary centers preserved 48.12% revenue share in 2025, driven by complex case management and availability of capital budgets. Ambulatory surgical centers and cardiac cath labs are scaling fastest at 13.79% CAGR through 2031 as payers shift elective procedures toward outpatient environments. OCT-guided PCI in outpatient labs cut major adverse events by 28% compared with angiography-guided approaches, reinforcing payer preference for value-based care. Specialty ophthalmic chains leverage portable systems to decentralize screening, while dermatology clinics adopt line-field OCT to triage suspected skin cancers at primary presentation.
Research institutes continue to pilot ultrawide-field prototypes that capture ocular periphery in a single shot, expanding clinical trial endpoints and academic interest. All segments collectively stimulate volume growth; yet outpatient sites show the largest upside as procedural revenue migrates from in-patient departments to lower-cost settings, reinforcing the long-run trajectory of the OCT market.
By Sales Channel: Distribution networks widen reach
Direct sales still contributed 52.64% revenue in 2025 because buyers demand integrated training, workflow mapping, and technical support. Distributors and value-added resellers are growing at 13.28% CAGR as vendors court emerging-market hospitals that prefer local language support and financing flexibility. Zeiss’s acquisition of Dutch Ophthalmic Research Center extends surgical-device coverage and deepens service teams in Europe and Asia. Canon’s USD 50 million Cleveland imaging hub exemplifies how manufacturers reinforce regional support infrastructure to sustain direct engagements.
Hybrid models are emerging: Olympus’s cloud-based AI platform bundles endoscopy hardware with subscription analytics, signalling future recurring-revenue opportunities. As AI-enabled OCT matures, similar software-as-a-service layers are likely, prompting distributors to build digital-support competencies. This evolution sustains a robust pipeline of installations that enlarges the OCT market while reducing downtime for clinicians.
Geography Analysis
North America held 42.33% revenue share in 2025 thanks to advanced infrastructure, robust private insurance, and a clear FDA AI policy roadmap. Nevertheless, reimbursement headwinds persist: Medicare’s 2025 Physician Fee Schedule cut ophthalmology payments by 2%, and the conversion factor fell to USD 32.35, squeezing margins for small practices. New CPT codes for OCT-angiography partially offset cuts, yet relative-value downgrades for structural imaging heighten cost-containment pressure. Canada and Mexico represent white-space opportunities where handheld devices mitigate rural-care gaps, and cross-border teleophthalmology programs capture incremental volume.
Europe maintains steady growth powered by coordinated health systems and accelerated AI adoption. EssilorLuxottica’s 80% stake in Heidelberg Engineering integrates diagnostic platforms with eyewear retail channels, enhancing access in Germany, the United Kingdom, France, Italy, and Spain. Olympus secured CE approval for three cloud-based AI endoscopy systems, underscoring regulatory openness to software-driven innovation. Central and Eastern European governments are investing in hospital-modernization schemes that favor mid-range OCT consoles, sustaining baseline demand even as western markets mature.
Asia-Pacific is the fastest-growing region, advancing at a 15.06% CAGR between 2026 and 2031. China remains the largest single market but experienced capital-spending delays amid macroeconomic uncertainty, causing a 3% revenue dip for Zeiss in 2024. Japan’s urban-rural physician imbalance constrains rural OCT installations despite otherwise modern infrastructure. India, Australia, and South Korea exhibit strong double-digit unit growth driven by public-health initiatives and telemedicine expansion. Singapore’s SG$200 million AI-healthcare fund and Australia’s 2023–2028 digital strategy further validate the region’s technology-friendly policy environment. These drivers collectively boost the OCT market through rapid capacity build-out, especially for point-of-care formats.

Competitive Landscape
Market structure is moderately consolidated. EssilorLuxottica’s Heidelberg acquisition illustrates vertical integration, fusing eyewear retail reach with diagnostic imaging to capture end-to-end patient journeys. Zeiss expanded surgical coverage by purchasing Dutch Ophthalmic Research Center, creating cross-selling synergies between intraocular lenses, microscopes, and OCT consoles.
Component suppliers such as Excelitas (Axsun) and Thorlabs hold strategic leverage through swept-source laser inventories that other manufacturers depend on. AI-native entrants like Perimeter Medical Imaging AI or Spryte Medical challenge incumbents with cloud-centric business models and FDA Breakthrough designations. Competitive differentiation now pivots on algorithm-upgrade velocity; companies that secure FDA-approved change-control plans can push performance enhancements without new clearances, tightening product cycles.
Platform thinking is prevalent. Vendors bundle hardware, analytics, and cloud dashboards, promoting ecosystem lock-in that boosts recurring revenue. Intellectual-property race intensifies around photonic-integrated circuits and machine-learning segmentation networks, as illustrated by SpecstatOR research achieving label-free tissue classification. Overall, rivalry continues to heighten, yet the OCT market remains receptive to niche innovators that address modality gaps or cost constraints.
Optical Coherence Tomography (OCT) Industry Leaders
Carl Zeiss AG
Novacam Technologies
Topcon Corporation
Leica Microsystems (Danaher)
Terumo Medical Corporation
- *Disclaimer: Major Players sorted in no particular order

Recent Industry Developments
- May 2025: EssilorLuxottica completed its 80% acquisition of Heidelberg Engineering, strengthening OCT capabilities within the SPECTRALIS platform.
- April 2025: Zeiss unveiled its AI-powered Research Data Platform, automating data collection and accelerated analytics for ophthalmic studies.
- February 2025: Canon Healthcare invested USD 50 million in Cleveland’s Innovation District to create an imaging resource center spanning advanced OCT.
- July 2024: Spryte Medical earned FDA Breakthrough Device Designation for nOCT, underscoring ongoing innovation in optical coherence platforms.


Research Methodology Framework and Report Scope
Market Definitions and Key Coverage
In our study, we define the optical coherence tomography (OCT) market as new standalone, cart-mounted, or handheld devices, structural, angiographic, spectral, and swept-source, sold to healthcare and research settings worldwide.
Scope Exclusion: Our valuation excludes refurbished consoles, OCT heads integrated into surgical microscopes, and service contracts.
Segmentation Overview
- By Device Type
- Hand-held OCT Devices
- Table-top OCT Devices
- Catheter-based Intravascular OCT
- By Technology
- Time-Domain OCT
- Spectral-Domain OCT
- Swept-Source OCT
- Full-Field / Line-Field OCT
- By Modality
- Structural OCT
- OCT-Angiography (OCT-A)
- Polarization-Sensitive OCT
- Doppler / Functional OCT
- By End-user
- Hospitals & Tertiary Care Centers
- Specialty Ophthalmic Clinics
- Ambulatory Surgical / Cardiac Cath Labs
- Dermatology & Aesthetic Clinics
- Research & Academic Institutes
- By Sales Channel
- Direct Sales
- Distributor / VAR Sales
- Others
- Geography
- North America
- United States
- Canada
- Mexico
- Europe
- Germany
- United Kingdom
- France
- Italy
- Spain
- Rest of Europe
- Asia-Pacific
- China
- Japan
- India
- Australia
- South Korea
- Rest of Asia-Pacific
- Middle East and Africa
- GCC
- South Africa
- Rest of Middle East and Africa
- South America
- Brazil
- Argentina
- Rest of South America
- North America
Detailed Research Methodology and Data Validation
Primary Research
Interviews with retinal surgeons, interventional cardiologists, biomedical engineers, and distributors in North America, Europe, China, and India confirm for us typical ASPs, replacement cycles, and rising point-of-care demand.
Desk Research
We start with open data, WHO vision registries, American Academy of Ophthalmology cataract volumes, Eurostat hospital discharges, Chinese procedure logs, and PMDA device clearances, which anchor the addressable imaging pool. Our analysts then mine D&B Hoovers revenues, Dow Jones Factiva tender wins, and Questel patent trends to spot adoption shifts across regions; the sources named illustrate our desk review, yet many other materials support data checks.
Market-Sizing & Forecasting
Our sizing begins top-down: disease and procedure cohorts convert to potential scans, national penetration rates are cross-checked against sampled shipment tallies, and focused bottom-up roll-ups of major manufacturers keep totals grounded.
We feed diabetic-retinopathy incidence, cath-lab volumes, reimbursement milestones, ASP drift, system life cycle, and new approvals into a multivariate regression with scenario tweaks that capture swept-source migration and handheld uptake.
Data Validation & Update Cycle
Mordor analysts compare outputs with customs codes and shipment trackers; any variance above seven percent triggers rerun and peer review. Reports refresh annually, with interim updates for recalls or reimbursement shocks.
Why Mordor's Optical Coherence Tomography Baseline Commands Confidence
Published figures vary because firms mix different product scopes, price assumptions, and update cadences. Our disciplined scope and yearly refresh give buyers clear, comparable numbers.
Key gaps arise when others count refurbished units, drop angiography modules, or apply inflated price mark-ups. We stick to verified quotes and constant 2024 USD.
Benchmark comparison
| Market Size | Anonymized source | Primary gap driver |
|---|---|---|
| USD 1.97 B (2025) | Mordor Intelligence | - |
| USD 2.20 B (2024) | Global Consultancy A | Includes refurbished devices and 10 % ASP premium |
| USD 1.90 B (2024) | Industry Association B | Excludes handheld units; uses 2023 FX rates |
This comparison shows that once differing scopes and pricing filters are removed, Mordor's balanced midpoint is the transparent, repeatable baseline decision-makers can trust.


Key Questions Answered in the Report
What is the current Optical Coherence Tomography (OCT) Market size?
The Optical Coherence Tomography (OCT) Market stands at USD 2.19 billion in 2026 and is forecast to reach USD 3.71 billion by 2031, growing at an 11.13% CAGR.
Which region will grow fastest through 2031?
Asia-Pacific is projected to expand at a 15.06% CAGR due to aging demographics, infrastructure upgrades, and supportive digital-health policies.
How is AI changing OCT workflows?
AI algorithms automate segmentation and deliver predictive biomarkers, reducing reading time and enabling new indications such as cardiovascular-risk stratification and virtual cancer biopsies.
Why are swept-source systems gaining traction?
Swept-source OCT offers deeper penetration and faster scan rates, supporting cardiology and oncology applications and driving a 12.31% CAGR segment growth.
What reimbursement changes affect OCT services in 2025?
Medicare introduced CPT 92137 for OCT-angiography while cutting conversion factors, prompting practices to diversify service mix to offset lower structural-imaging rates.
Page last updated on:


