Cone Beam Computed Tomography Market Size and Share
Market Overview
| Study Period | 2019 - 2030 |
|---|---|
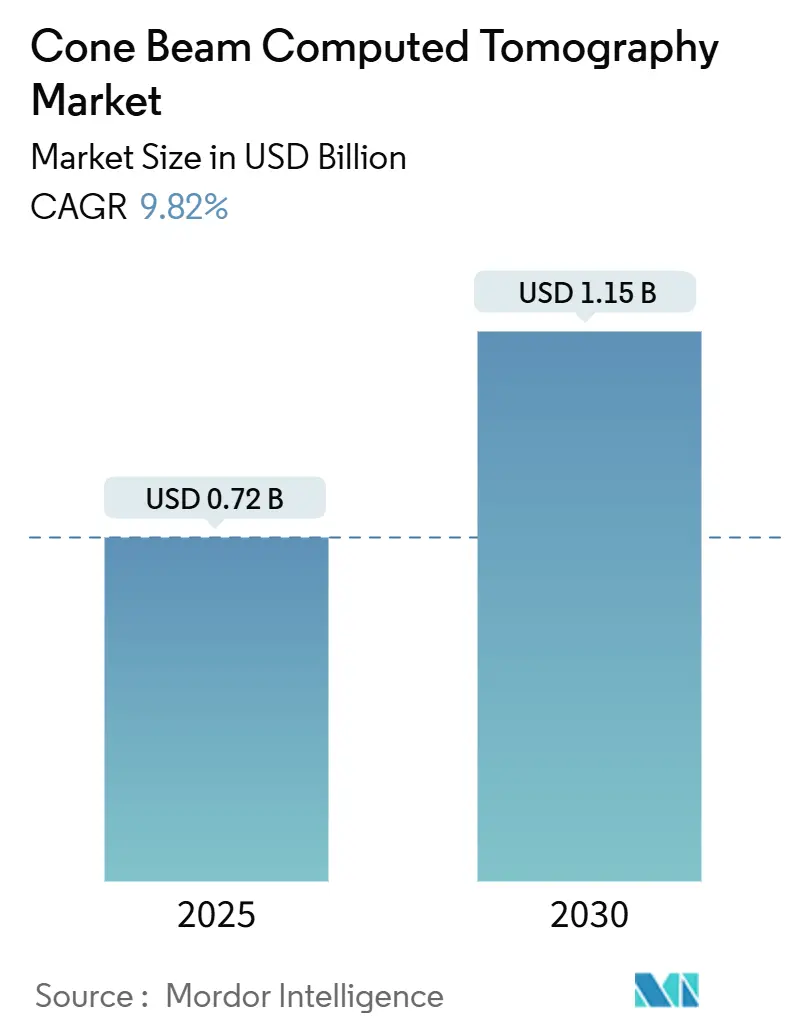
| Market Size (2025) | USD 0.72 Billion |
| Market Size (2030) | USD 1.15 Billion |
| Growth Rate (2025 - 2030) | 9.82% CAGR |
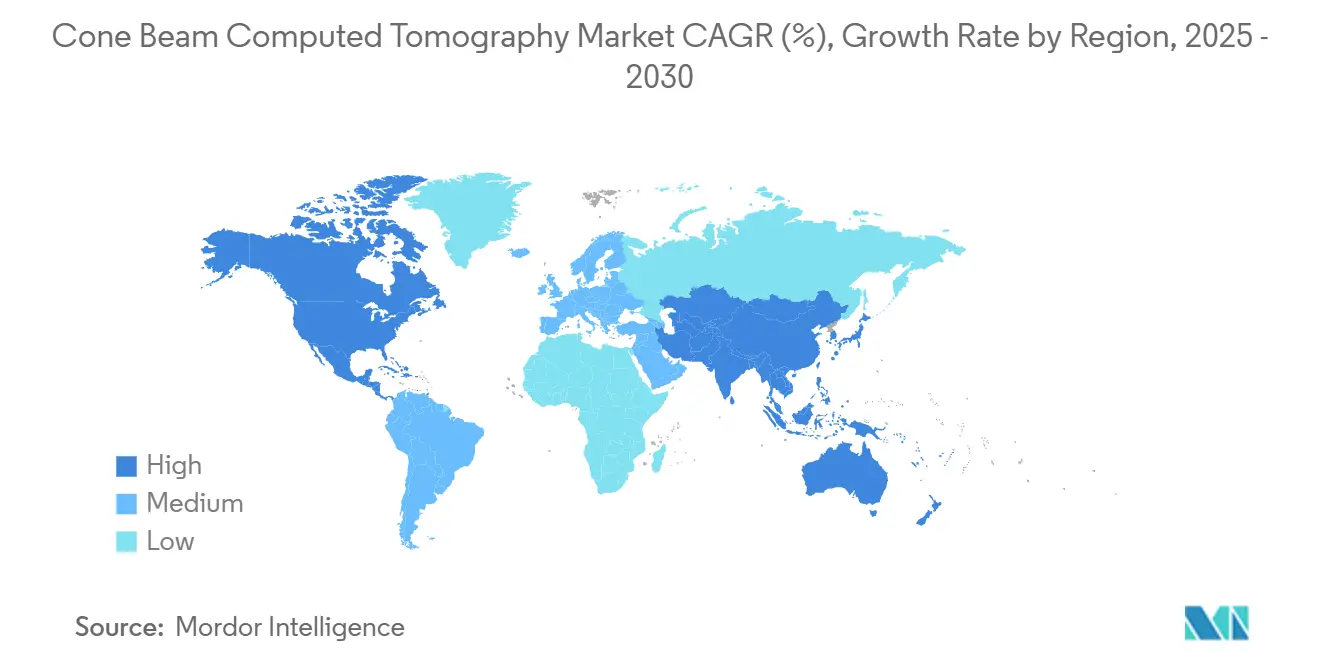
| Fastest Growing Market | Asia-Pacific |
| Largest Market | North America |
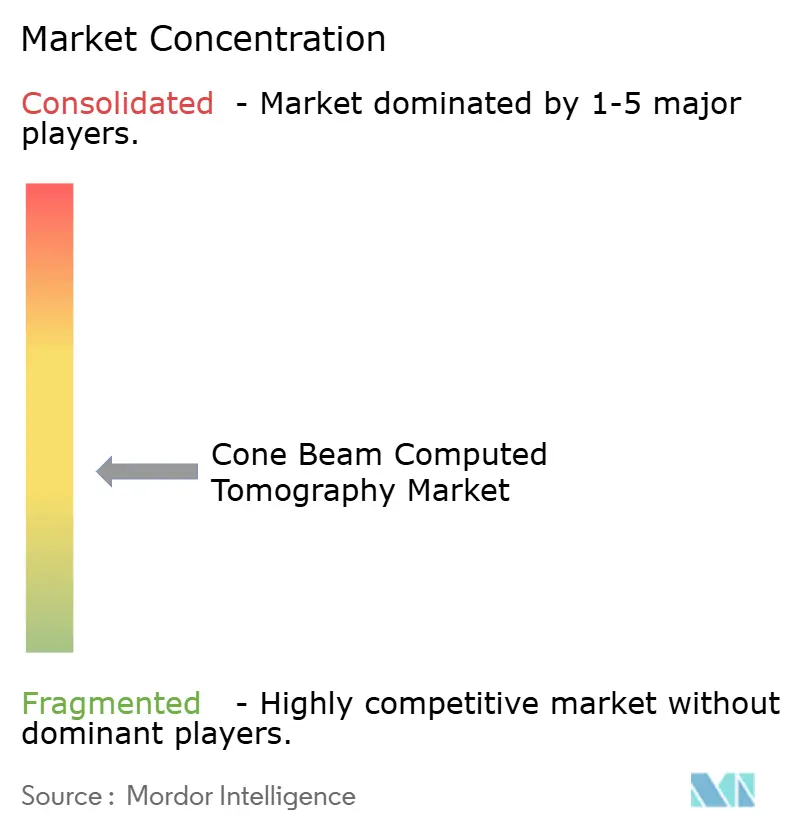
| Market Concentration | Medium |
Major Players
*Disclaimer: Major Players sorted in no particular order Image © Mordor Intelligence. Reuse requires attribution under CC BY 4.0. |
|
Cone Beam Computed Tomography Market Analysis by Mordor Intelligence
The cone beam computed tomography market stands at USD 0.72 billion in 2025 and is forecast to reach USD 1.15 billion by 2030, advancing at a 9.82% CAGR. Rising orthodontic case volumes, broader ENT and sleep-disorder applications [1]Burak İncebeyaz, "Evaluation of osteomeatal complex by cone-beam computed tomography in patients with maxillary sinus pathology and nasal septum deviation," BMC Oral Health, bmcoralhealth.biomedcentral.com, and the steady integration of artificial intelligence into image-reconstruction workflows together underpin this forward momentum. Dental service organizations are rolling out multi-site equipment programs that standardize imaging protocols and accelerate system adoption, while lower-cost mini-field-of-view units have opened the technology to smaller practices. Cloud connectivity, remote consultation, and reimbursement expansion for 3-D airway assessment further widen the cone beam computed tomography market addressable base. Ongoing FDA clarifications on radiation-control regulations and recent 510(k) approvals create a supportive regulatory backdrop that speeds product launches and reduces compliance uncertainty.
Key Report Takeaways
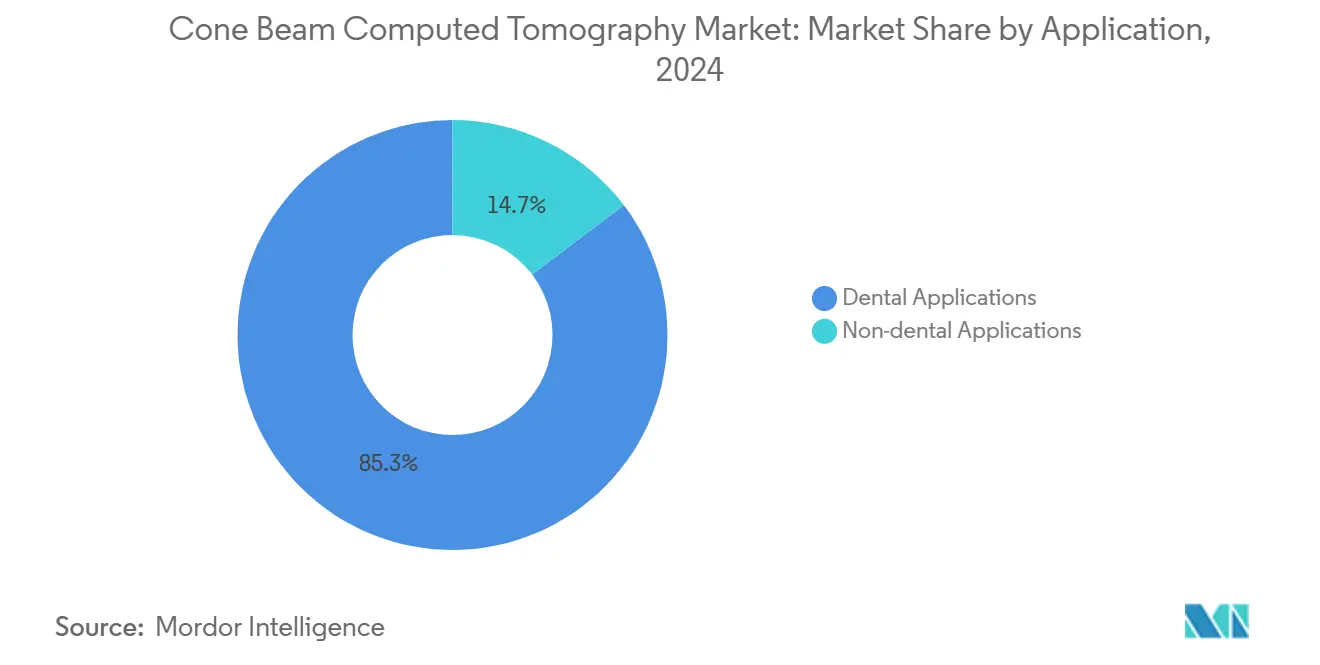
- By application, dental imaging led with 85.34% of cone beam computed tomography market share in 2024, whereas non-dental imaging is projected to climb at a 10.56% CAGR through 2030.
- By patient position, standing/sitting systems held 51.23% of the cone beam computed tomography market size in 2024, while seated systems are advancing at a 10.45% CAGR to 2030.
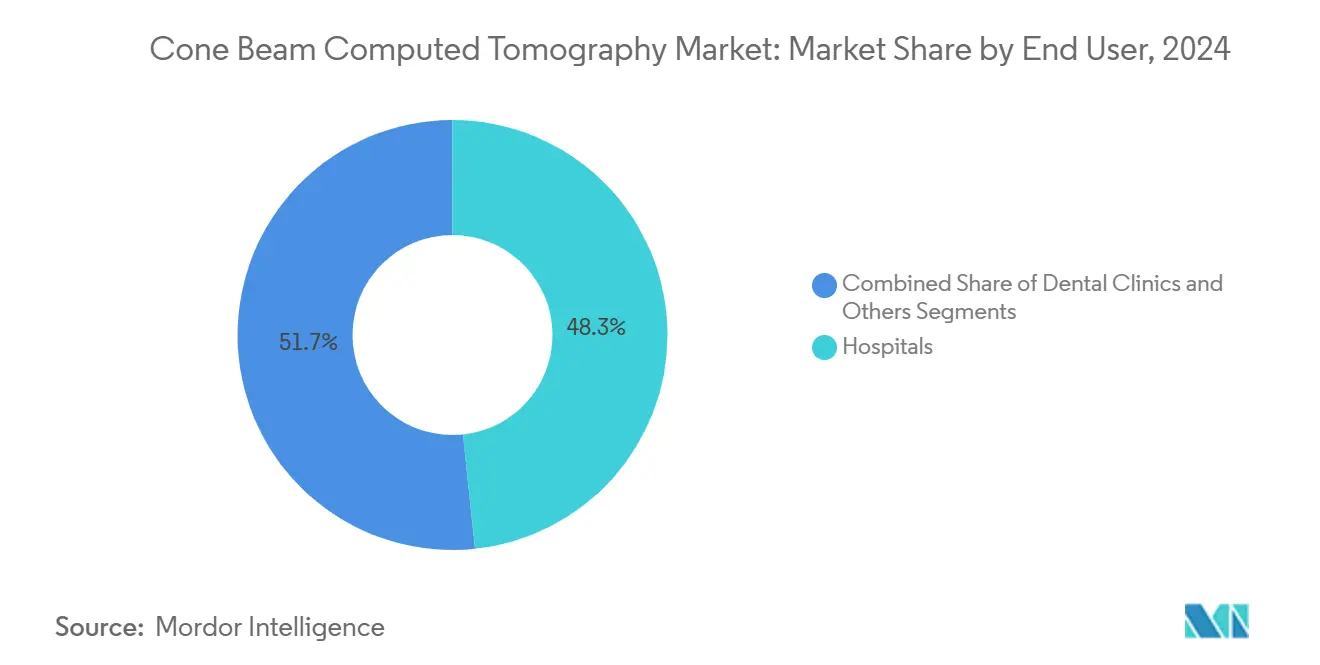
- By end user, hospitals captured 48.34% of the cone beam computed tomography market size in 2024; dental clinics record the highest growth trajectory at 10.91% CAGR.
- By mobility, conventional fixed units controlled 75.34% of cone beam computed tomography market share in 2024, yet mobile units are expanding at an 11.21% CAGR.
- By geography, North America accounted for 39.41% revenue share in 2024, whereas Asia-Pacific is positioned to post a 10.87% CAGR through 2030.
Global Cone Beam Computed Tomography Market Trends and Insights
Drivers Impact Analysis*
| Driver | (~) % Impact on CAGR Forecast | Geographic Relevance | Impact Timeline |
|---|---|---|---|
| Surging prevalence of orthodontic malocclusions among adults & teens | +2.1% | Global, with concentration in North America & Europe | Medium term (2-4 years) |
| Reimbursement expansion for 3D airway assessment in sleep-disordered breathing | +1.8% | North America & EU, expanding to APAC | Long term (≥ 4 years) |
| AI-enabled image-reconstruction cuts scan time & dose, boosting adoption | +2.3% | Global, led by developed markets | Short term (≤ 2 years) |
| Proliferation of dental service organizations accelerating CBCT roll-outs | +1.4% | North America, expanding to Europe | Medium term (2-4 years) |
| Growing ENT & sinus surgery use-cases outside dentistry | +1.2% | Global, with early adoption in developed markets | Long term (≥ 4 years) |
| Rapid price decline of entry-level mini-FOV units in emerging markets | +1.0% | APAC, Latin America, MEA | Medium term (2-4 years) |
| Source: Mordor Intelligence | |||
AI-enabled image-reconstruction cuts scan time and dose
Artificial-intelligence algorithms now reduce scan times by about 40% while preserving diagnostic quality through noise suppression and artifact correction. Deep-learning metal-artifact reduction has markedly improved image clarity around dental implants, enabling dependable assessments in complex orthodontic cases. The 2024 launch of the DEXIS digital ecosystem merged AI-powered analysis with treatment-planning software, giving providers end-to-end workflow support. Dose reductions resonate strongly in pediatric dentistry, where radiation limits are strict, and smaller practices benefit from the time savings that lift daily scan throughput. These gains collectively broaden the cone beam computed tomography market beyond high-volume clinics and into community settings.
Surging prevalence of orthodontic malocclusions among adults and teens
Adult orthodontic demand continues to rise as clear-aligner systems improve aesthetics and reduce treatment stigma. Malocclusion prevalence has climbed in both North America and Europe, prompting dentists and orthodontists to adopt 3-D imaging for precise root and bone assessments. CBCT provides full volumetric visualization, allowing clinicians to confirm cortical-bone thickness and tooth inclination prior to movement, which shortens chair time and curbs retreatment risk. This clinical edge pushes providers to upgrade from two-dimensional cephalometric tools, reinforcing equipment sales across mature markets.
Reimbursement expansion for 3-D airway assessment in sleep-disordered breathing
UnitedHealthcare’s 2024 update now reimburses 3-D airway analysis for complex sleep-disorder evaluations. Payer recognition signals that CBCT offers diagnostic insight beyond routine dentistry, especially when orthodontic devices are considered for obstructive sleep apnea therapy [2]Jorge Faber, "The role of orthodontists in the multidisciplinary management of obstructive sleep apnea," Progress in Orthodontics, progressinorthodontics.springeropen.com. Providers gain a new revenue stream, and patients benefit from shorter diagnostic pathways compared with polysomnography alone. The policy shift is also spurring cross-referrals between sleep physicians and orthodontic teams, strengthening multidisciplinary uptake across the cone beam computed tomography market.
Proliferation of dental service organizations accelerating CBCT roll-outs
DSOs completed USD 9 billion in acquisitions during 2024 as consolidation quickened. Their standardized procurement strategies translate into predictable multi-unit orders, giving manufacturers economies of scale and encouraging enterprise-grade features such as cloud dashboards for fleet oversight. Volume-based pricing plus centralized training accelerate technology diffusion, shrinking adoption gaps between urban and rural clinics.
Restraints Impact Analysis*
| Restraint | (~) % Impact on CAGR Forecast | Geographic Relevance | Impact Timeline |
|---|---|---|---|
| High upfront capital cost & limited insurance coverage in many countries | -1.9% | Global, particularly acute in emerging markets | Long term (≥ 4 years) |
| Radiation-dose regulations becoming stricter, curbing repeat scans | -1.1% | Global, led by EU and North America | Medium term (2-4 years) |
| Shortage of CBCT-literate radiologists/dentists in developing regions | -0.8% | APAC, Latin America, MEA | Long term (≥ 4 years) |
| Flat-panel detector supply-chain constraints due to rare-earth sourcing | -0.7% | Global manufacturing impact | Short term (≤ 2 years) |
| Source: Mordor Intelligence | |||
High upfront capital cost and limited insurance coverage
System prices ranging from USD 80,000 to USD 500,000 remain a hurdle for single-chair practices, particularly in lower-income countries where procedure reimbursement is limited. Currency volatility and import taxes intensify the burden. Refurbished equipment and subscription models are emerging, but widespread coverage gaps still temper the cone beam computed tomography market expansion.
Flat-panel detector supply-chain constraints
China’s 2024 export restrictions on rare-earth elements such as gadolinium and yttrium expose sourcing risks for scintillators essential to digital detectors. Manufacturers are securing alternate suppliers and investigating CMOS approaches, yet any disruption could drive up component costs and delay deliveries, adding friction to the purchasing cycle.
*Our forecasts treat driver/restraint impacts as directional, not additive. The impact forecasts reflect baseline growth, mix effects, and variable interactions.
Segment Analysis
By Application: Dental Dominance Faces Non-Dental Disruption
Dental imaging continued to hold 85.34% of the cone beam computed tomography market size in 2024, supported by routine orthodontic, endodontic, and implant protocols. Dental sub-segments now benefit from AI-guided root-canal navigation and metal-artifact reduction that deepen diagnostic certainty and support chairside decision-making [3]Elham Saberian, "Applications of artificial intelligence in regenerative dentistry: promoting stem cell therapy and the scaffold development," Frontiers in Cell and Developmental Biology, frontiersin.org. Orthodontics remains the largest contributor as adult alignment demand surges, while implantology grows on the back of precise 3-D bone mapping that safeguards critical anatomical structures. Pediatric dentists lean on ultra-low-dose presets to balance diagnostic gain with radiation safety.
Non-dental imaging is poised to disrupt long-standing dominance as ENT, sleep-medicine, and plastic-surgery teams integrate CBCT into their pre-operative workflows. ENT clinicians report clearer visualization of the osteomeatal complex and inner-ear pathways at radiation doses up to 10 times lower than multi-slice CT. Sleep physicians use volumetric airway reconstructions to plan mandibular advancement devices. Plastic surgeons value CBCT for nasal and mid-facial bone analysis, though adoption remains limited to high-volume centers due to equipment costs. Together, these use cases underpin a 10.56% CAGR for non-dental applications, progressively rebalancing the cone beam computed tomography market.


By Patient Position: Ergonomic Evolution Drives Seated Growth
Standing/sitting systems retained 51.23% of the cone beam computed tomography market share in 2024, a legacy of early platform designs that prioritize speed and compact footprints. The familiar workflow reduces room-fit challenges and accommodates high patient throughput in bustling clinics. Motion-correction algorithms continue to improve image quality even with minor head shifts, preserving relevance for routine diagnostics.
Seated systems, meanwhile, are set to rise at a 10.45% CAGR as providers prioritize patient comfort in lengthy or pediatric scans. The seated position lessens movement artifacts and eases access for patients with limited mobility. Manufacturers are launching dual-mode platforms that switch between positions without extensive reconfiguration, spreading capital costs across wider patient segments. Supine designs remain the choice for hospitals where integration with other radiology suites dictates consistency, though space demands limit broader use. Over time, flexible ergonomics are expected to converge, allowing multi-position capability within a single architecture and reinforcing buyer preference for versatile models throughout the cone beam computed tomography market.
By End User: Hospital–Clinic Dynamics Shift Toward Outpatient Care
Hospitals accounted for 48.34% of the cone beam computed tomography market size in 2024, leveraging multi-disciplinary referrals and capital reserves to adopt top-tier systems with AI-ready hardware. Academic centers often pilot novel algorithms and new clinical indications, supplying evidence that later diffuses into mainstream practice. Yet hospital procurement cycles are lengthier due to committee approvals and budget allocations that compete against other imaging priorities.
Dental clinics, advancing at a 10.91% CAGR, now match hospital diagnostic capabilities by installing mini-field-of-view or mid-volume systems that fit standard treatment rooms. DSO purchasing scale lowers unit prices, while improved vendor financing removes upfront hurdles for independent clinics. General dentists increasingly consider CBCT indispensable for comprehensive care, from implant planning to endodontic retreatment. Cloud-based image sharing allows seamless referrals to radiologists for second opinions without patients leaving the clinic, raising the standard of outpatient dentistry and driving the cone beam computed tomography market toward decentralized care delivery.
By Mobility: Digital Connectivity Transforms Conventional Systems
Conventional fixed systems commanded 75.34% of the cone beam computed tomography market share in 2024 as installed bases remain sizable and image fidelity satisfies daily clinical needs. Hospitals and large clinics rely on fixed installations for the highest-resolution scans that integrate with electronic health record archiving.
Digital-connected mobile systems, growing at 11.21% CAGR, embed secure cloud gateways that facilitate instant uploads to diagnostic portals and AI engines. Remote specialists can therefore annotate scans within minutes, improving treatment speed and patient satisfaction. Connectivity also underpins predictive maintenance, letting vendors service equipment proactively and limit downtime. Mobile units lag in broad uptake due to radiation-shielding regulations and smaller field-of-view limitations, yet they serve niche demands in rural outreach and emergency response. Over time, hybrid platforms offering detachable detector heads may blur categorical lines, renewing interest in portable imaging across the cone beam computed tomography market.
Geography Analysis
North America secured 39.41% of global revenue in 2024 owing to early technology uptake, robust insurance frameworks, and high dental spending. The FDA’s 2024 radiation-control guidance gives manufacturers clearer design pathways, which in turn speeds product approvals such as Epica’s See Factor CT3 system. United States DSOs dominate procurement volume, and Canada’s provincial plans now reimburse select CBCT indications, steadily lifting penetration in secondary cities. Mexico is witnessing private-clinic expansion, especially in tourism corridors, although equipment imports remain sensitive to peso fluctuations.
Asia-Pacific is forecast to expand at 10.87% CAGR, fueled by rising disposable income, government oral-health campaigns, and rapid clinic chain growth across China, India, and the Association of Southeast Asian Nations. South Korea and Japan maintain high per-capita unit densities, yet incremental gains persist through hardware replacements with AI-ready models. China’s rare-earth export curbs underscore supply-chain dependency but simultaneously stimulate domestic detector innovation, which could localize component sourcing and reduce foreign exchange risk. India’s private-insurance adoption is climbing, broadening patient affordability and raising clinician willingness to invest.
Europe delivers steady progress underpinned by universal coverage that reimburses radiation-dose optimized dental imaging. The region’s regulators enforce stringent exposure limits, aligning well with CBCT’s low-dose profile. Manufacturers such as Planmeca continue to refine ultra-low dose protocols that meet European safety thresholds while maintaining diagnostic clarity. Central and Eastern European markets expand as EU structural funds modernize dental clinics, yet growth still trails Western Europe due to lower per-capita expenditure. The Middle East and Africa offer high long-term potential, particularly in Gulf Cooperation Council states where private dental groups import premium devices amid growing medical-tourism flows, although broader adoption is constrained by capital cost barriers and limited trained personnel.

Competitive Landscape
The cone beam computed tomography market is moderately fragmented, with competition centered on image quality, AI integration, and connectivity rather than price alone. Established leaders—Carestream Health, Danaher Corporation, and Planmeca Group—pursue vertical integration that secures detector supply and embeds proprietary reconstruction software across their portfolios. Carestream Dental drew USD 525 million in new funding during 2024 to retire debt and accelerate innovation in AI-enhanced workflows. Planmeca’s Viso line couples motion-correction with ultra-low-dose algorithms, differentiating through patient-centric safety features. Danaher leverages its extensive consumables network to bundle scanners with practice-management platforms, nurturing ecosystem lock-in.
Emerging players focus on specific niches. CurveBeam AI markets AI-first diagnostic suites that plug into hospital radiology networks, while Vatech positions cost-efficient mini-FOV systems for emerging markets. Supply-chain pressures push manufacturers toward multisourcing of flat-panel components, and some seek outright acquisitions of detector firms to guarantee continuity. The R&D race increasingly revolves around software rather than hardware, with deep-learning models for automatic pathology detection being trialed in academic centers.
Competition is also evident in service models: subscription-based equipment-as-a-service contracts lower upfront costs and include continuous software upgrades, a proposition appealing to fast-growing DSOs that prioritize financial flexibility. Collectively, these dynamics underscore an industry shifting from hardware-centric competition toward integrated imaging ecosystems that blend devices, software, and analytics.
Cone Beam Computed Tomography Industry Leaders
-
J. Morita Mfg. Corp.
-
Planmeca Group
-
Dentsply Sirona
-
Carestream Health, Inc.
-
Vatech
- *Disclaimer: Major Players sorted in no particular order

Recent Industry Developments
- June 2025: The FDA classified radiological acquisition and optimization guidance systems as Class II, lowering regulatory hurdles for innovative imaging devices.
- May 2025: GE HealthCare released CleaRecon DL built on deep-learning reconstruction to enhance CBCT image quality.
- September 2024: Carestream Dental secured a USD 525 million investment from General Atlantic Credit’s Atlantic Park fund to fuel CBCT innovation and launch an Oral Healthcare Innovation Hub.
- July 2024: Epica obtained 510(k) clearance for the See Factor CT3 system, broadening clinical options in both dental and medical settings.


Research Methodology Framework and Report Scope
Market Definitions and Key Coverage
Mordor Intelligence defines the cone-beam computed tomography (CBCT) market as all newly manufactured, cone-beam X-ray systems that reconstruct three-dimensional volumes for dental, maxillofacial, ENT, orthopedic, and small-joint imaging. Revenue covers hardware and factory-bundled imaging workstations only; accessories, maintenance contracts, and stand-alone software upgrades are outside the value base.
Scope exclusion: legacy fan-beam CT scanners, refurbished CBCT units, and software-only dental viewers are not counted.
Segmentation Overview
-
By Application
-
Dental Applications
- Orthodontics
- Endodontics
- Periodontics
- General Dentistry
- Dental Implants
- Others
- Non-dental Applications
-
Dental Applications
-
By Patient Position
- Standing/Sitting
- Seated
- Supine
-
By End User
- Hospitals
- Dental Clinics
- Others
-
By Mobility
- Stand-alone CBCT Systems
- Mobile CBCT Systems
-
By Geography
-
North America
- United States
- Canada
- Mexico
-
Europe
- Germany
- United Kingdom
- France
- Italy
- Spain
- Rest of Europe
-
Asia-Pacific
- China
- Japan
- India
- Australia
- South Korea
- Rest of Asia-Pacific
-
Middle East and Africa
- GCC
- South Africa
- Rest of Middle East and Africa
-
South America
- Brazil
- Argentina
- Rest of South America
-
North America
Detailed Research Methodology and Data Validation
Primary Research
We spoke with oral surgeons, dental-service-organization procurement heads, ENT imaging technologists, and East-Asian distributors to stress-test shipment numbers, pricing tiers, and replacement cycles. Their insights helped bridge gaps in public data and let us refine field-of-view mix, patient-position preferences, and emerging AI add-on demand.
Desk Research
Our analysts first map the device universe through public sources such as the US FDA 510(k) database, European CE MDR listings, and customs-coded export data. We then layer in disease and procedure volumes drawn from WHO oral-health surveys, OECD elective-surgery statistics, and the American Association of Orthodontists. Internal paid libraries, including D&B Hoovers for manufacturer financials and Questel for patent velocity, give context on capacity shifts and innovation pace.
A second pass taps peer-reviewed journals (Dentomaxillofacial Radiology, JAMA Otolaryngology) plus association reports from the International Association of Dento-Maxillo-Facial Radiology. These datasets ground starting assumptions; however, many other sources were also reviewed during fact-finding and validation.
Market-Sizing & Forecasting
The model begins with a top-down reconstruction of yearly CBCT installations using production disclosures and trade data, which are then multiplied by weighted average selling prices to yield the 2025 value. Supplier roll-ups for the ten largest brands provide a bottom-up check on totals. Key inputs, number of active dental clinics, implant procedures per 1,000 population, device ASP trends, average seven-year replacement cadence, and regional radiation-dose regulations, drive segmentation. A multivariate regression, updated with three macro indicators (GDP per capita, dentist density, and geriatric share), projects demand to 2030. Where channel data are thin, midpoint imputation anchored to verified install-base ratios is applied.
Data Validation & Update Cycle
Before sign-off, Mordor analysts compare model outputs with independent shipment tallies, and anomaly flags trigger re-checks. Reports refresh every twelve months; any material device recall or reimbursement change prompts an interim update, and a final analyst pass occurs just prior to client delivery.
Why our Cone Beam Computed Tomography Baseline earns trust
Published estimates often differ because firms pick unique device mixes, pricing ladders, and forecast refresh dates.
Key gap drivers here include whether non-dental uses are counted, how aggressively adoption curves are set for Asia-Pacific clinics, and if service revenues are bundled. Mordor's scope sticks to hardware only, applies region-specific ASPs validated by quarterly calls, and benefits from an annual rebuild cadence, giving decision-makers a steadier reference line.
Benchmark comparison
| Market Size | Anonymized source | Primary gap driver |
|---|---|---|
| USD 0.72 B (2025) | Mordor Intelligence | |
| USD 0.70 B (2024) | Global Consultancy A | Narrow end-user scope and single global ASP; last refresh 2023 |
| USD 0.83 B (2024) | Trade Journal B | Includes software/service revenue and optimistic uptake rates; lacks install-base cross-check |
In sum, the side-by-side view shows that Mordor's disciplined variable selection and yearly update cycle deliver a balanced, transparent baseline clients can replicate and confidently cite.


Key Questions Answered in the Report
What is the current value of the cone beam computed tomography market?
The market is valued at USD 0.72 billion in 2025 and is projected to reach USD 1.15 billion by 2030, reflecting a 9.82% CAGR.
Which region leads the cone beam computed tomography market?
North America leads with 39.41% revenue share in 2024, supported by high dental spending, favorable reimbursement, and early technology adoption.
Which segment is growing fastest within the cone beam computed tomography market?
Digital-connected mobile CBCT systems are expanding at an 11.21% CAGR because cloud connectivity supports remote consultations and AI-driven diagnostics.
How is artificial intelligence influencing cone beam computed tomography adoption?
AI shortens scan times, lowers radiation dose, and automates image interpretation, which together encourage smaller practices to invest.
What are the major restraints limiting wider cone beam computed tomography market penetration?
High upfront equipment cost, tightening radiation regulations, shortage of trained users in developing regions, and detector supply-chain risks temper growth.
How are dental service organizations shaping equipment demand?
DSOs leverage multi-site buying power to standardize CBCT deployment, drive down unit prices, and promote integrated AI workflows across their networks.
Page last updated on:


