
Market Overview
| Study Period | 2020 - 2031 |
|---|---|
| Market Size (2026) | USD 4.24 Billion |
| Market Size (2031) | USD 6.56 Billion |
| Growth Rate (2026 - 2031) | 9.12 % |
| Fastest Growing Market | Asia Pacific |
| Largest Market | North America |
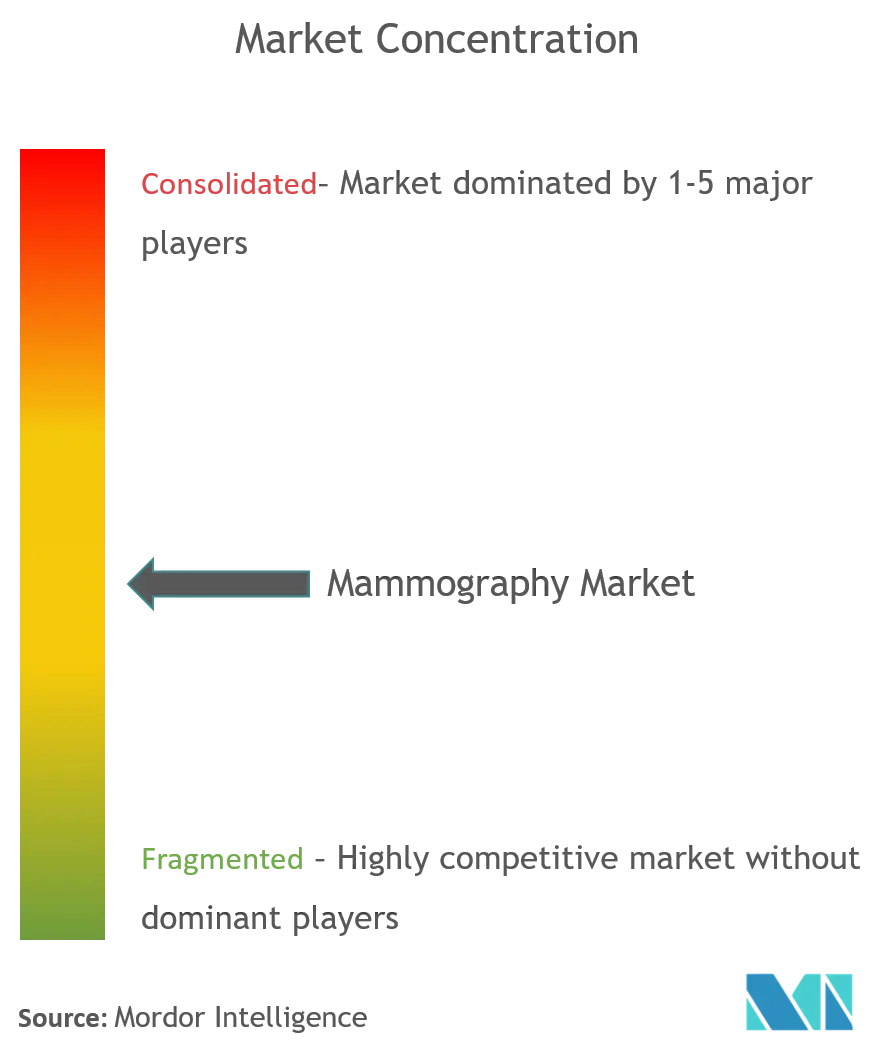
| Market Concentration | Medium |
Major Players *Disclaimer: Major Players sorted in no particular order Image © Mordor Intelligence. Reuse requires attribution under CC BY 4.0. | |
Mammography Market Analysis by Mordor Intelligence
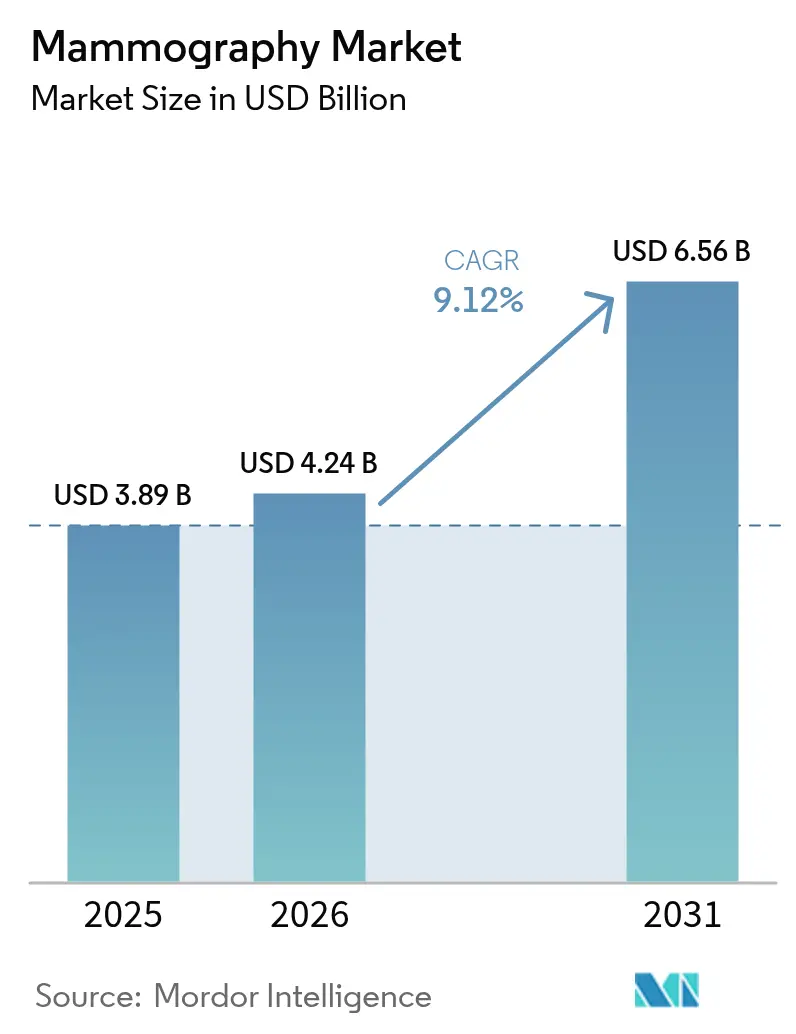
The Mammography market size is expected to grow from USD 3.89 billion in 2025 to USD 4.24 billion in 2026 and is forecast to reach USD 6.56 billion by 2031 at 9.12% CAGR over 2026-2031.
Sustained growth comes from the convergence of rising breast-cancer incidence, rapid diffusion of 3-D tomosynthesis, and regulatory approvals for artificial-intelligence (AI) triage that ease radiologist workload. Broader screening access through mobile units, coupled with capital-grant programs in emerging economies, widens the purchasing base for both entry-level digital and premium photon-counting platforms. Competitive intensity sharpens as vendors integrate proprietary algorithms that raise cancer-detection sensitivity and trim false-positive rates; these performance gains justify premium pricing even as reimbursement schedules tighten. The mammography market also benefits from dose-optimized imaging advances that temper consumer radiation anxieties and strengthen providers’ quality-of-care metrics.
Key Report Takeaways
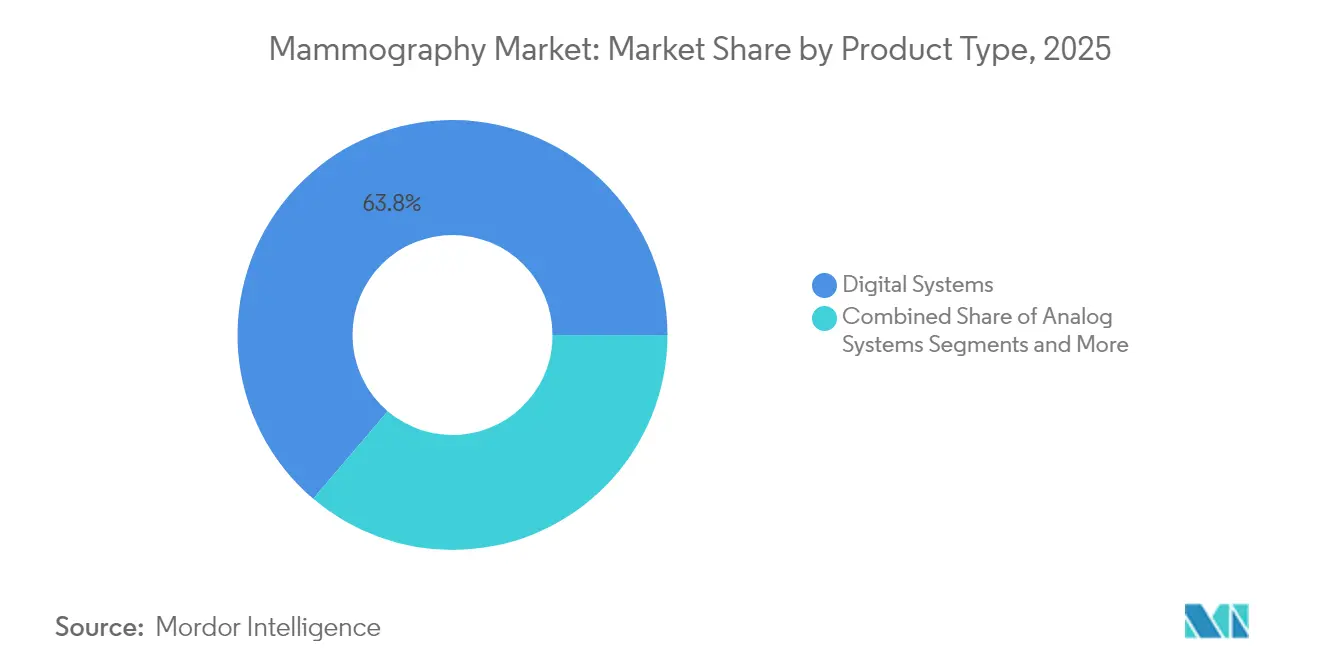
- By product type, digital systems captured 63.78% of the mammography market share in 2025; software and services are projected to grow at a 11.56% CAGR through 2031.
- By technology, 2-D full-field digital retained 49.72% of the mammography market size in 2025, while photon-counting digital is slated for a 9.61% CAGR to 2031.
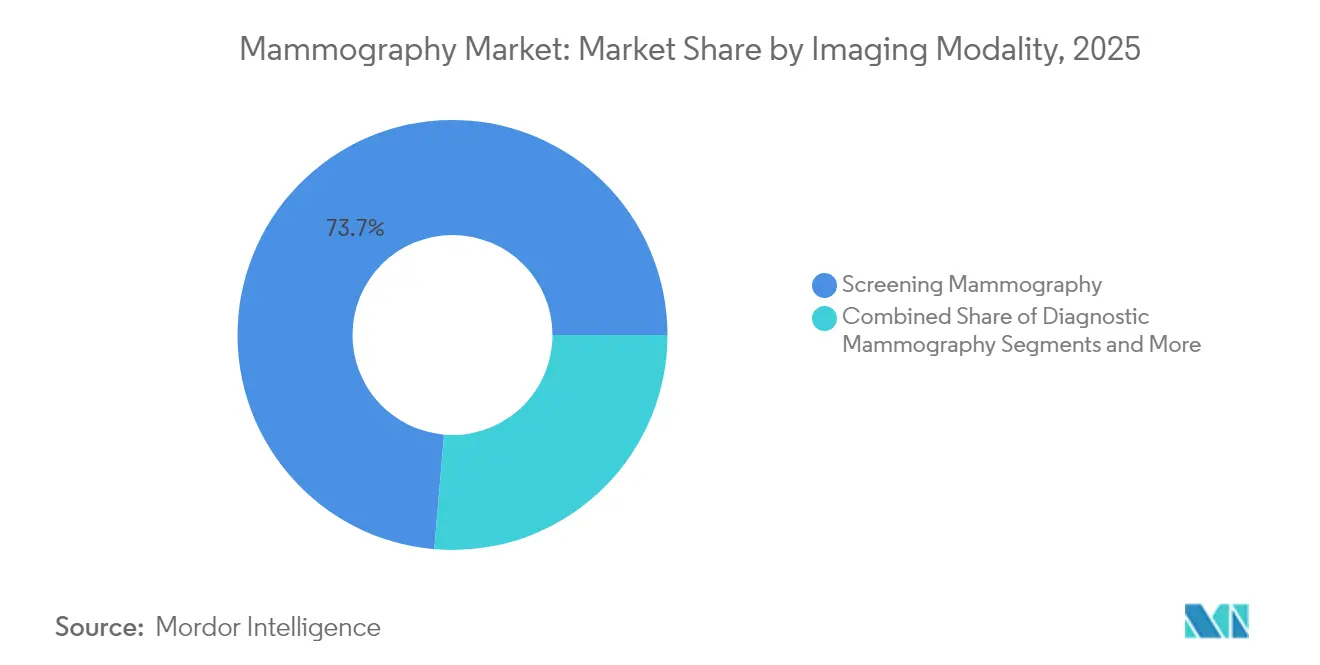
- By imaging modality, screening mammography accounted for 73.65% of the mammography market size in 2025 and interventional mammography advances at a 9.94% CAGR.
- By end user, hospitals held 44.12% of mammography market share in 2025; diagnostic imaging centers are expanding at a 9.28% CAGR through 2031.
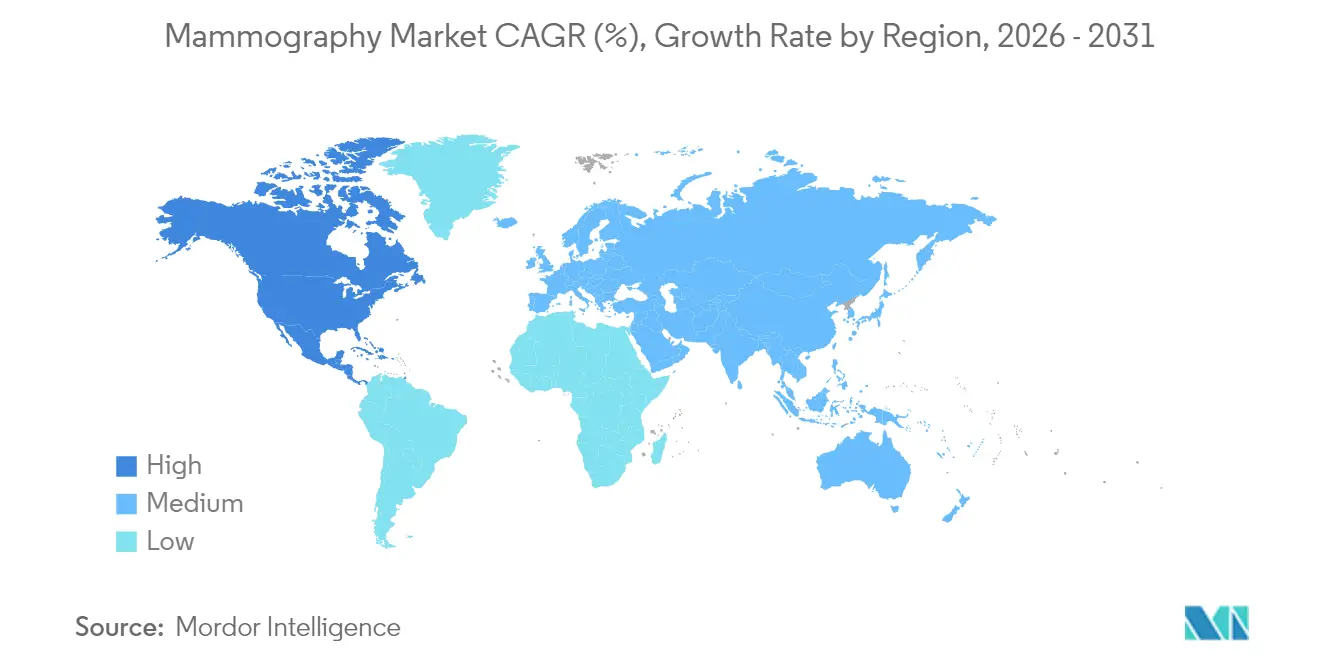
- North America led with 42.21% mammography market share in 2025, whereas Asia-Pacific posts the fastest 10.02% CAGR to 2031.
Note: Market size and forecast figures in this report are generated using Mordor Intelligence’s proprietary estimation framework, updated with the latest available data and insights as of 2026.
Market Trends and Insights
Drivers Impact Analysis of Mammography Market*
| Driver | (~) % Impact on CAGR Forecast | Geographic Relevance | Impact Timeline |
|---|---|---|---|
| Growing Burden Of Breast Cancer | +2.1% | Global, with highest impact in Asia-Pacific and emerging markets | Long term (≥ 4 years) |
| Technological Shift To 3-D/AI-Enabled Imaging | +1.8% | North America & EU leading, APAC following | Medium term (2-4 years) |
| Expanding Public-Private Screening Campaigns | +1.4% | APAC core, spill-over to MEA and South America | Medium term (2-4 years) |
| Capital Grants In Emerging Economies | +1.2% | Southeast Asia, Sub-Saharan Africa, Latin America | Long term (≥ 4 years) |
| AI-Based Triage Reimbursement Approvals | +0.9% | North America & EU primarily | Short term (≤ 2 years) |
| Mobile Mammography For Rural Outreach | +0.7% | Global, with emphasis on rural regions in developing countries | Medium term (2-4 years) |
| Source: Mordor Intelligence | |||
Growing Burden of Breast Cancer
Global breast-cancer incidence continues to climb, with 385,837 new cases reported in China in 2022 alone, reinforcing the need for widespread screening infrastructure. Urbanization, later childbearing, and lifestyle shifts are pushing incidence curves upward, especially across Asia-Pacific. Policymakers respond by embedding population-wide mammography targets into national non-communicable-disease strategies, positioning the mammography market as a public-health priority. Early detection lowers therapy costs and raises five-year survival odds, so ministries of health channel investment toward mobile units and breast-health outreach in peri-urban districts. This epidemiological pressure creates a resilient baseline for equipment demand that is largely insulated from macroeconomic cycles.
Technological Shift to 3-D/AI-Enabled Imaging
Digital breast tomosynthesis detects 5.3 cancers per 1,000 screens versus 4.0 for 2-D mammography, while lowering recall rates to 7.2%. Multi-vendor AI triage amplifies these gains; the MASAI trial logged a 29% lift in cancer detection and a 44.2% cut in reader workload. Health systems absorb higher capital costs because throughput and diagnostic accuracy translate into tangible cost-of-care savings. Consequently, the mammography market rewards manufacturers with integrated algorithm portfolios, expansive regulatory clearances, and agile upgrade pathways. Facilities that lag in 3-D adoption risk reimbursement penalties and patient out-migration, fueling a technology-upgrade race.
Expanding Public-Private Screening Campaigns
Collaborations that harness multilateral bank financing and vendor expertise are scaling fleet deployments in underserved geographies. Indonesia’s purchase of 361 mammography units through Islamic Development Bank support illustrates how blended finance unlocks capacity in lower-middle-income economies. Private manufacturers deliver turnkey solutions, while public agencies supply clinical labor and outreach logistics, a pairing that accelerates volume ramp-up. The model skews demand toward mobile and portable platforms that flex across districts rather than fixed installations, broadening the mammography market footprint into secondary cities and rural zones. Performance metrics center on screened-woman counts, shifting procurement decisions from price-per-unit to cost-per-screen economics.
Capital Grants in Emerging Economies
Targeted grants, such as the Radiological Society of North America’s USD 750,000 suite installation in Tanzania, are steering attention to Africa’s screening gap. These awards often bundle operator training, service contracts, and IT connectivity, ensuring asset uptime and clinical-quality adherence. Successful pilots become reference sites that influence national tenders and catalyze follow-on purchases, driving ripple effects in the mammography market. Vendors that embed capacity-building components into grant proposals position themselves as long-term partners, capturing service revenues and consumable sales once initial funding cycles lapse.
Restraints Impact Analysis of Mammography Market*
| Restraint | (~) % Impact on CAGR Forecast | Geographic Relevance | Impact Timeline |
|---|---|---|---|
| Radiation-Dose Related Consumer Push-Back | -0.8% | Global, with higher impact in developed markets | Medium term (2-4 years) |
| Shrinking Reimbursement Rates In OECD | -1.2% | North America & EU primarily | Short term (≤ 2 years) |
| Detector-Grade Semiconductor Shortages | -0.6% | Global supply chain impact | Short term (≤ 2 years) |
| Radiologist Staffing Gaps | -1.1% | Global, acute in developed markets | Long term (≥ 4 years) |
| Source: Mordor Intelligence | |||
Radiation-Dose Related Consumer Push-Back
Although modern systems limit exposure to 0.4-1 mSv per exam, public perception of radiation risk can suppress screening adherence, especially in countries that now mandate density notifications under MQSA amendments [1]U.S. Food & Drug Administration, “Density Notification Final Rule,” fda.gov . Social-media amplification of dose concerns forces providers to allocate chair-time to counseling and to invest in low-dose protocols. Manufacturers promote photon-counting technology and patient-education apps to mitigate hesitancy, yet lingering anxiety drags utilization rates and, by extension, refresh cycles within the mammography market.
Shrinking Reimbursement Rates in OECD
Cost-containment drives Medicare’s 2025 conversion-factor cut of 2.83%, with tomosynthesis CPT G0279 down 9.67%; European health systems mirror this trend through negotiated tariff reductions. Lower payments stretch replacement periods from six to nine years at mid-sized U.S. hospitals, deferring order books for premium units. Providers prioritize upgrades that guarantee throughput or dose savings with direct revenue benefit, placing vendors under price-compression stress across the mammography market.
*Our forecasts treat driver/restraint impacts as directional, not additive. The impact forecasts reflect baseline growth, mix effects, and variable interactions.
Mammography Market Segment Analysis
By Product Type:
Digital Dominance Faces 3-D DisruptionDigital systems represented 63.78% of the mammography market share in 2025; software and services are projected to grow at a 11.56% CAGR through 2031. Superior lesion conspicuity and a clinically proven reduction in false positives drive hospital committees to re-allocate capital budgets toward tomosynthesis fleets, despite premium acquisition costs. Retrofit digital kits remain relevant among cost-sensitive clinics, but stringent screening-program accreditation rules across Europe are accelerating analog retirement. Contrast-enhanced systems, boasting 95.9% sensitivity in dense breasts, are carving a niche within tertiary oncology centers, signaling further product-mix sophistication for the mammography market.
The dual-tier structure persists: value-oriented purchasers in Africa, South Asia, and parts of Latin America rely on computed-radiography kits that extend analog lifespan, while tech-forward institutions in North America and Japan leapfrog to AI-ready 3-D suites. Vendors are thus compelled to maintain split product roadmaps, balancing affordability with innovation. As retrofits phase out post-2028, the mammography market size attributable to analog derivatives is projected to shrink, freeing capital toward photon-counting and contrast-enhanced units.



By Technology:
AI Integration Reshapes Competitive DynamicsPhoton-counting detectors, expanding at 9.61% CAGR, promise lower dose and higher spatial resolution, making them a strategic anchor for flagship portfolios. Despite 2-D full-field digital holding 49.72% of the mammography market size in 2025, replacement demand tilts decisively toward technologies that embed AI CAD. RadNet’s USD 103 million purchase of iCAD underscores how service providers view proprietary algorithms as competitive moats. Regulatory benches in the U.S. and EU are streamlining AI-supplemental filings, removing historical launch bottlenecks and compressing time-to-market for iterative software releases.
The mammography market favors suppliers that can demonstrate multi-modal integration—combining wide-angle tomosynthesis, contrast enhancement, and AI triage in a single workflow. Siemens’ Mammomat B.brilliant delivers a 5-second sweep with 50° coverage, showing how hardware refresh cycles now revolve around throughput as much as image quality. Second-generation photon-counting prototypes aim for detector cost reductions through fabrication optimizations, potentially democratizing access to the technology after 2027.
By Imaging Modality:
Interventional Growth Signals Precision-Medicine ShiftScreening dominated with 73.65% of the mammography market size in 2025, but interventional applications are growing fastest at 9.94% CAGR. Rising biopsy volumes stem from expanded screening cohorts and AI-flagged lesions that require targeted sampling. Stereo-biopsy suites integrate imaging and vacuum-assisted excision, shortening procedural times and improving diagnostic yield. Diagnostic mammography remains a stable bridge modality, capturing follow-up imaging for suspicious screens, while intra-operative specimen imaging expands within breast-conserving surgery pathways.
Vacuum-assisted systems such as Mammotome Elite allow tissue removal with smaller incisions, reducing patient morbidity and supporting same-day discharge models. Corresponding equipment upgrades, such as compression paddles, biopsy needles, and upgradeable software keys, lift accessory revenues, fueling ancillary profits within the mammography market. Providers increasingly assess modality procurement based on care-pathway efficiency rather than standalone imaging performance, aligning capital expenditure with value-based-care metrics.
By End User:
Diagnostic Centers Challenge Hospital DominanceHospitals held 44.12% mammography market share in 2025, yet diagnostic imaging centers are expanding at a 9.28% CAGR as payers push routine screening into lower-cost outpatient settings through 2031. Independent centers seek high-throughput gantries with automated positioning and AI triage that compensate for lean technologist staffing. Ambulatory surgery centers now invest in in-house imaging to bundle biopsy and lumpectomy services, creating integrated breast-care corridors that elevate patient retention.
For mobile outreach, trailer-mounted 2-D digital suites retain relevance, especially where grant funding prioritizes geographic coverage over feature depth. Vendors tailor service contracts—offering uptime guarantees and remote diagnostics—to minimize operational downtime that would undercut patient-throughput targets. Workflow analytics dashboards, once optional, are now embedded to optimize slot utilization, cementing data-driven decision-making across all buyer categories in the mammography market.
Geography Analysis
North America Mammography Market
North America commanded 42.21% of mammography market share in 2025, anchored by established screening guidelines and rapid AI adoption. Yet 1,400+ unfilled radiologist vacancies and Medicare’s 9.67% tomosynthesis fee reduction will moderate replacement demand through 2026. Providers counter by deploying AI triage to bridge staffing gaps, which maintains modality-utilization levels while extending hardware life cycles. Canada channels federal breast-health funding toward northern-territory mobile units, reflecting sustained commitment to equitable access despite fiscal headwinds.
APAC Mammography Market
Asia-Pacific registers a 10.02% CAGR, the fastest worldwide, propelled by China’s ballooning incidence and India’s state-led health-insurance schemes that subsidize mammography caravans. Indonesia’s blended-finance procurement underscores the role of multilateral banks in scaling infrastructure. Japan, South Korea, and Singapore already embrace 3-D tomosynthesis, while Southeast Asian markets emphasize rugged, portable units that traverse archipelagic geographies. The mammography market thus spans a spectrum from high-end photon-counting installations in Tokyo to battery-powered vans servicing Indonesian islands.
Europe Mammography Market
Europe’s mature screening programs sustain steady but restrained growth. The Medical Device Regulation (EU) 2017/745, fully effective since 2021, tightens conformity-assessment timelines yet improves cross-border device-transfer transparency . The European Commission’s 2023 endorsement of tomosynthesis as a superior technology boosts upgrade justification, particularly in Germany and the Nordics. Budget pressures and workforce shortages shift focus toward productivity-oriented features over next-gen detector upgrades, making AI software refreshes more palatable than complete hardware replacements in the mammography market.

Regulatory Landscape
In the United States, mammography facilities operate under the FDA Mammography Quality Standards Act (MQSA) program. The MQSA Final Rule amendments took effect on September 10, 2024, requiring updated breast density notifications alongside modernized quality standards for accredited sites. On the device side, full-field digital mammography systems are regulated as Class II devices with special controls, and they are commonly cleared through the 510(k) pathway. This structure keeps clinical performance, labeling, and quality system documentation central to market access.
In Europe, mammography systems must meet the Medical Device Regulation (EU) 2017/745 (MDR), fully effective since 2021. The MDR raises the burden for clinical evaluation, post-market surveillance, and documented benefit-risk performance across the device lifecycle. Alongside an emphasis on minimizing radiation exposure while maintaining diagnostic image quality, these requirements continue to shape launch sequencing, technical file readiness, and update cadence for hardware platforms and software-enabled features used in breast imaging workflows.
Value Chain Analysis
The mammography value chain begins with upstream detector and electronics inputs, including flat-panel detector substrates such as amorphous selenium or cesium iodide, imaging processing boards, and tube head assemblies. This stage draws from a narrow supplier base, and it flows into OEM system design, manufacturing, and software integration. Manufacturing footprints remain concentrated among global OEMs in the United States (Hologic, GE HealthCare), Germany (Siemens Healthineers), and Japan (Fujifilm). Critical component dependency, particularly around semiconductors and detector-related parts, sustains supply risk management through dual sourcing and safety stocks.
Midstream distribution typically combines direct sales into large hospital and imaging-center networks with dealer-led channel coverage in price-sensitive geographies. Regional logistics hubs, including the Netherlands, Singapore, and the United Arab Emirates, stage imports and spare parts. Downstream, value capture is increasingly tied to software, workflow tools, and lifecycle service contracts such as installation, QA, preventive maintenance, and uptime guarantees. Partnerships that embed AI into deployed fleets also contribute, including GE HealthCare expanding international distribution of DeepHealth breast screening workflow tools in April 2026.
Competitive Landscape
The mammography market is moderately consolidated: top players Hologic, GE HealthCare, and Siemens Healthineers anchor share through bundled imaging, interventional, and AI solutions. Hologic declined a USD 16 billion takeover offer in 2024 while acquiring Endomagnetics for USD 310 million and Gynesonics for USD 350 million, showcasing a strategy to broaden breast-health ecosystems beyond core imaging. GE HealthCare’s Pristina Via series reduces compression variability and integrates vendor-neutral prior-image comparison, aiming to lock in multi-brand hospital networks.
Siemens leans on synergies with its Varian oncology unit to position Mammomat suites within integrated cancer pathways. Emerging challengers exploit niche technologies: Koning Health’s cone-beam breast CT records 92% sensitivity against 77% for conventional mammography, though high cost limits near-term uptake[3]Amerigo Allegretto, “Cone-beam CT Shows Superiority over Mammography,” AuntMinnieEurope, auntminnieeurope.com. RadNet’s vertical integration via iCAD purchase exemplifies a trend where service operators acquire AI developers to create closed-loop diagnostic ecosystems, a model that could unsettle traditional vendor-provider relationships in the mammography market.
Photon-counting entrants leverage semiconductor-fabrication expertise to undercut incumbents on detector performance, but supply-chain volatility around cadmium-telluride and silicon wafers remains a gating factor. Meanwhile, regional specialists in Brazil, Turkey, and China target price-sensitive buyers with stripped-down digital units, sustaining fragmentation in emerging markets even as global leaders consolidate share in developed countries.
Mammography Industry Leaders
GE Healthcare
Hologic Inc.
Koninklijke Philips NV
Siemens Healthineers
Fujifilm Holdings Corporation
- *Disclaimer: Major Players sorted in no particular order
Mammography Market Companies Covered in this Report
- FUJIFILM
- GE Healthcare
- Hologic
- Siemens Healthineers
- Koninklijke Philips
- Canon
- Carestream Health
- Konica Minolta
- Agfa-Gevaert
- Metaltronica
- General Medical Merate
- Planmed
- IMS srl
- Delphinus Medical Technologies
- Sectra
- Hitachi
- Mindray
- Analogic
- Varex Imaging
- iCAD Inc.

Market Opportunities and Future Outlook
Workflow automation and AI-enabled reading support remain a primary whitespace area for providers that need to manage radiologist staffing gaps. The GEMINI study, published March 2026 in Nature Cancer, reported reduced radiologist workload (up to 31%) and improved cancer detection (10.4%) without increasing recall rates. That evidence supports procurement interest in AI triage, second-read, and reconstruction tools that increase throughput and standardize quality across multi-site screening programs.
Emerging-market infrastructure build-outs and localized service capacity also open near-term commercial opportunities for OEMs and integrators that bundle equipment, service hubs, and parts depots into multi-year agreements. The October 2025 strategic partnership between Superhealth and United Imaging Healthcare to equip 100 hospitals in India with imaging systems including digital mammography, along with a dedicated local service hub and parts depot, illustrates how installed-base support can accelerate deployment across distributed care networks. In parallel, intellectual property enforcement has become a market-shaping factor in Europe, highlighted by the June 2026 Unified Patent Court ruling involving Hologic and Siemens Healthineers. The ruling constrained sales of a mammography system in select countries, leading buyers and vendors to reassess upgrade paths, contract terms, and portfolio coverage in regulated markets.
Recent Industry Developments in Mammography Market
- June 2026: The Unified Patent Court (Germany) ruled in favor of Hologic in a patent dispute with Siemens Healthineers, restricting sales of the MAMMOMAT B.brilliant system in Germany, France, and the Netherlands. The ruling included injunction measures with recall and destruction requirements in the affected markets. This action heightened the role of IP risk in procurement decisions and can redirect replacement demand toward alternative tomosynthesis platforms or accelerated software-led upgrades.
- November 2025: GE HealthCare received FDA premarket authorization for Pristina Recon DL, a deep learning-based reconstruction application for 3D mammography. The clearance supports deeper embedding of AI into the image formation pipeline rather than limiting AI to downstream detection, strengthening the case for upgrading installed Pristina fleets. It also raises competitive pressure on peers to pair hardware refresh cycles with regulator-cleared algorithm updates.
- November 2024: Hologic unveiled the Envision Mammography Platform at RSNA, signaling a major platform upgrade with integrated AI-enabled workflow features. The rollout is aimed at expanding the installed base footprint and strengthening throughput and patient experience across high-volume screening programs.


Mammography Market Report Scope and Research Methodology
Market Definition and Coverage
This market covers revenues generated from mammography systems and related solutions used to screen and diagnose breast conditions using low-dose X-ray imaging, across hospitals and imaging settings globally.
Scope exclusions: General breast imaging modalities that are not mammography (such as ultrasound-only or MRI-only exams) are excluded from this sizing.
Segments Covered in This Report
- By Product Type
- Digital Systems
- Analog Systems
- Accessories and Consumables
- Software and Services
- By Technology
- 2-D Full-field Digital
- 3-D / Tomosynthesis
- Photon-counting Digital
- AI-enabled CAD & Image-triage
- By Imaging Modality
- Screening Mammography
- Diagnostic Mammography
- Interventional (Stereo-biopsy)
- Intra-operative Specimen Imaging
- By End User
- Hospitals
- Diagnostic Imaging Centers
- Ambulatory Surgical Centers
- Others
- By Geography
- North America
- United States
- Canada
- Mexico
- Europe
- Germany
- United Kingdom
- France
- Italy
- Spain
- Rest of Europe
- Asia-Pacific
- China
- Japan
- India
- Australia
- South Korea
- Rest of Asia-Pacific
- Middle East & Africa
- GCC
- South Africa
- Rest of Middle East & Africa
- South America
- Brazil
- Argentina
- Rest of South America
- North America
Data Sources, Market Sizing, and Validation
Desk Research
Desk research was used to build the base structure of the market model and to keep assumptions tied to measurable health system signals. We reviewed public sources such as the World Health Organization, the International Agency for Research on Cancer, the World Bank, and the OECD to understand screening participation, cancer burden, and healthcare capacity by region.
On the supply side, we used manufacturer annual reports, investor presentations, regulatory and standards updates, and reputable press coverage to track product mix shifts, including 2D versus 3D systems and the growing use of AI-enabled reading support. In parallel, we used paid subscriptions for company financials and news intelligence, plus patent database coverage to validate technology direction and timing. These desk sources are illustrative only, and other public documents were also used for collection, cross-checking, and clarification.
Primary Interviews and Surveys
Primary work focused on interviews and structured surveys with system suppliers, distributors, hospital procurement teams, radiology leaders, and imaging center operators across APAC, EMEA, and the Americas. The respondent input was used to confirm replacement cycles, typical system pricing ranges, uptake of tomosynthesis in routine screening, and how screening volumes and reimbursement shape annual purchasing behavior.
Distribution of primary research fieldwork respondents
| Company type | Respondent position | Region |
|---|---|---|
| Top tier: 30% | CXOs: 13% | APAC: 48% |
| Mid tier: 53% | Functional/Unit leaders: 31% | EMEA: 30% |
| Smaller Players: 17% | Managers: 56% | Americas: 22% |
Market-Sizing & Forecasting
Sizing starts from a top-down demand pool build where breast cancer screening coverage, eligible female population by age band, and average screening interval are translated into annual exam volumes by region, followed by an equipment need estimate using throughput per system and utilization. Once the implied system base is formed, it is converted to annual revenues using replacement rates, new installations, and an average selling price ladder that reflects the 2D to 3D mix and service attachment.
To keep totals realistic, the output is checked with selective bottom-up approximations, including sampled price quotes discussed through channel conversations and a supplier revenue sense-check for key regions. Where gaps show up, assumptions are adjusted.
A few of the model inputs that matter most are screening program intensity, adoption of tomosynthesis in routine screening, reimbursement stability for mammography exams, radiologist capacity constraints, and capital equipment lead times. For forecasting, scenario analysis was applied around screening participation and 3D upgrade speed, then aligned to the consensus ranges heard in primary discussions so the forward path stays believable even when public data is uneven.
Data Validation & Update Cycle
Outputs are triangulated across independent signals, including implied installed base versus exam volume, pricing versus mix movement, and year-over-year growth versus healthcare spending and screening policy direction. When a region shows abnormal jumps, the assumptions are rechecked, then relevant experts are re-contacted to confirm whether the change is real or driven by timing effects such as delayed tenders.
Before sign-off, the model and narrative go through multi-step analyst review so definitions, units, and currency conversions stay consistent across all cuts of the data. Reports are refreshed annually, and interim updates are made when material events could shift demand or pricing. Right before delivery, a final pass is completed so clients receive the most current view available at that time.
Mordor Intelligence's Global Mammography Market Market Size Compared Against Other Published Estimates
Published values for the mammography market can differ even when they appear to measure the same scope, because scope and timing choices are not identical across studies. The biggest spreads usually come from what gets counted as part of the market, which year is treated as the starting point, and how equipment pricing and mix are carried forward.
The main gap comes from whether adjacent breast imaging and broader diagnostic imaging revenues are blended into the total, where Mordor Intelligence counts mammography-specific system and solution revenues tied to mammography use cases and keeps non-mammography imaging outside the model. Differences also show up when one estimate assumes faster 3D adoption or higher average selling prices without checking against purchase cycles, tender timing, and reimbursement realities by region, which can shift a single-year value meaningfully.
Benchmark comparison
| Source | Market Size | Gaps in Research Methodology |
|---|---|---|
| Mordor Intelligence | USD 3.89 B (2025) | |
| Global Consultancy A | USD 2.58 B (2024) | Uses an earlier base year and is more device-only in framing, which can understate totals when service attachment and upgrade-driven pricing uplift are treated lightly across regions. |
| Regional Consultancy B | USD 2.95 B (2025) | Often applies conservative adoption for 3D upgrades and a flatter ASP progression, and it may not fully normalize one-off tender timing effects that can inflate or depress a single year. |
The comparison shows that the spread is mostly explained by scope boundaries and how pricing and mix are projected year to year, rather than by a disagreement on the underlying clinical need. By tying the model to exam volume signals, utilization, replacement cadence, and realistic price ladders, the resulting number stays traceable to inputs that can be rechecked and repeated.


Key Questions Answered in the Report
How big is the Mammography Market?
The Mammography Market size is expected to reach USD 4.24 billion in 2026 and grow at a CAGR of 9.12% to reach USD 6.56 billion by 2031.
What product segment is gaining share most quickly?
Software and services are expanding at 11.56% CAGR, outpacing other product categories.
Who are the key players in Mammography Market?
GE Healthcare, Hologic Inc., Koninklijke Philips NV, Siemens Healthineers and Fujifilm Holdings Corporation are the major companies operating in the Global Mammography Market.
Which is the fastest growing region in Mammography Market?
Asia-Pacific is growing at a 10.02% CAGR through 2031 thanks to rising incidence and government-funded screening.
Which region has the biggest share in Mammography Market?
In 2025, the North America accounts for the largest market share in Mammography Market.
Page last updated on:





