
Ophthalmology Diagnostics Market Size and Share
Market Overview
| Study Period | 2020 - 2031 |
|---|---|
| Market Size (2026) | USD 9.47 Billion |
| Market Size (2031) | USD 12.32 Billion |
| Growth Rate (2026 - 2031) | 5.40 % |
| Fastest Growing Market | Asia-Pacific |
| Largest Market | North America |
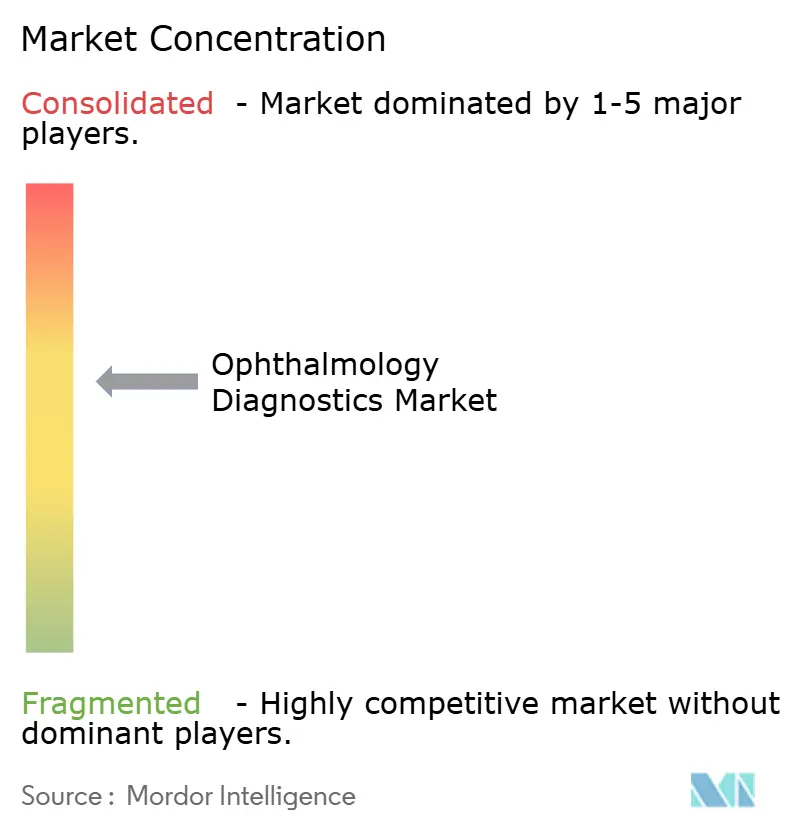
| Market Concentration | Medium |
Major Players *Disclaimer: Major Players sorted in no particular order Image © Mordor Intelligence. Reuse requires attribution under CC BY 4.0. | |
Ophthalmology Diagnostics Market Analysis by Mordor Intelligence
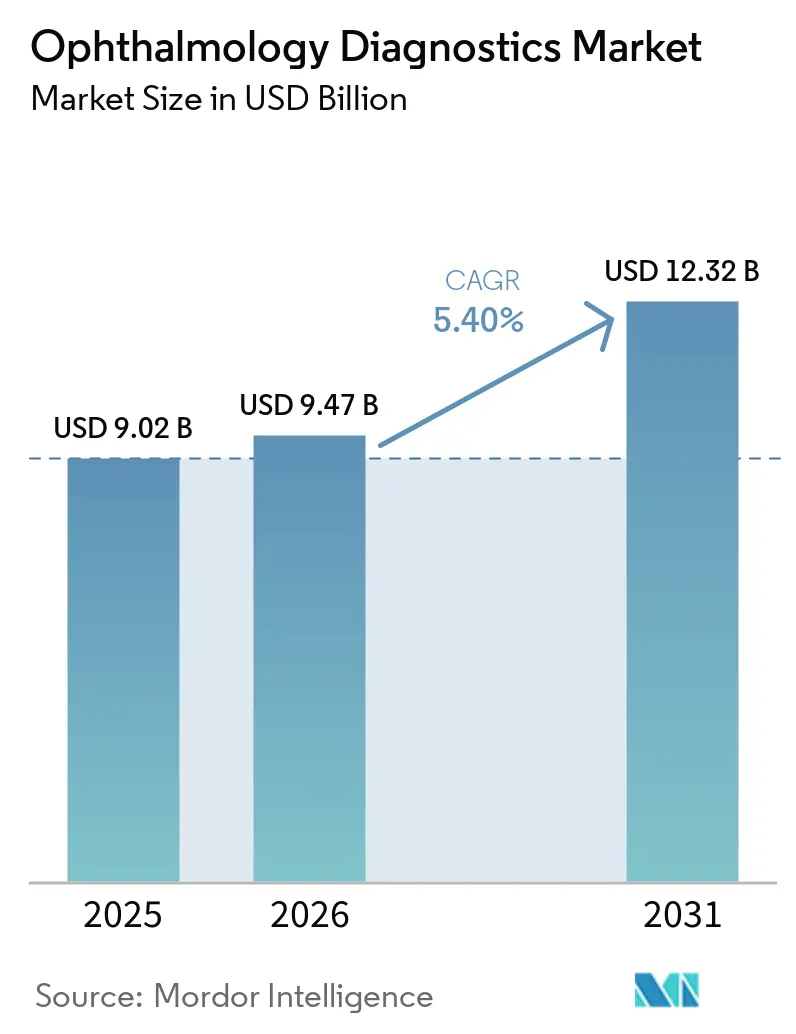
The Ophthalmology Diagnostics Market size is expected to grow from USD 9.02 billion in 2025 to USD 9.47 billion in 2026 and is forecast to reach USD 12.32 billion by 2031 at 5.40% CAGR over 2026-2031.
The adoption of autonomous artificial-intelligence screening in primary care, rising diabetes prevalence, and the private-equity-backed migration of diagnostic capital from hospitals to specialty clinics collectively push unit volumes upward. Momentum is amplified when payers reimburse AI screening for glaucoma, age-related macular degeneration, and diabetic retinopathy, a coverage inflection estimated to lift annual procedure growth by 1.2 percentage points. Near-term demand is strongest for ultra-widefield fundus cameras that embed algorithmic triage, reducing specialist review time by 70%. At the same time, swept-source optical coherence tomography (OCT) platforms defend the premium end of the product mix. Competitive behaviour is shifting toward subscription software models that reduce upfront capital outlay to one-tenth of that of traditional devices, eroding incumbents’ margin headroom. Reimbursement timelines, data-privacy mandates, and technician shortages remain structural frictions, yet are partially offset by handheld imaging tools and tele-ophthalmology networks that redistribute workload.
Key Report Takeaways
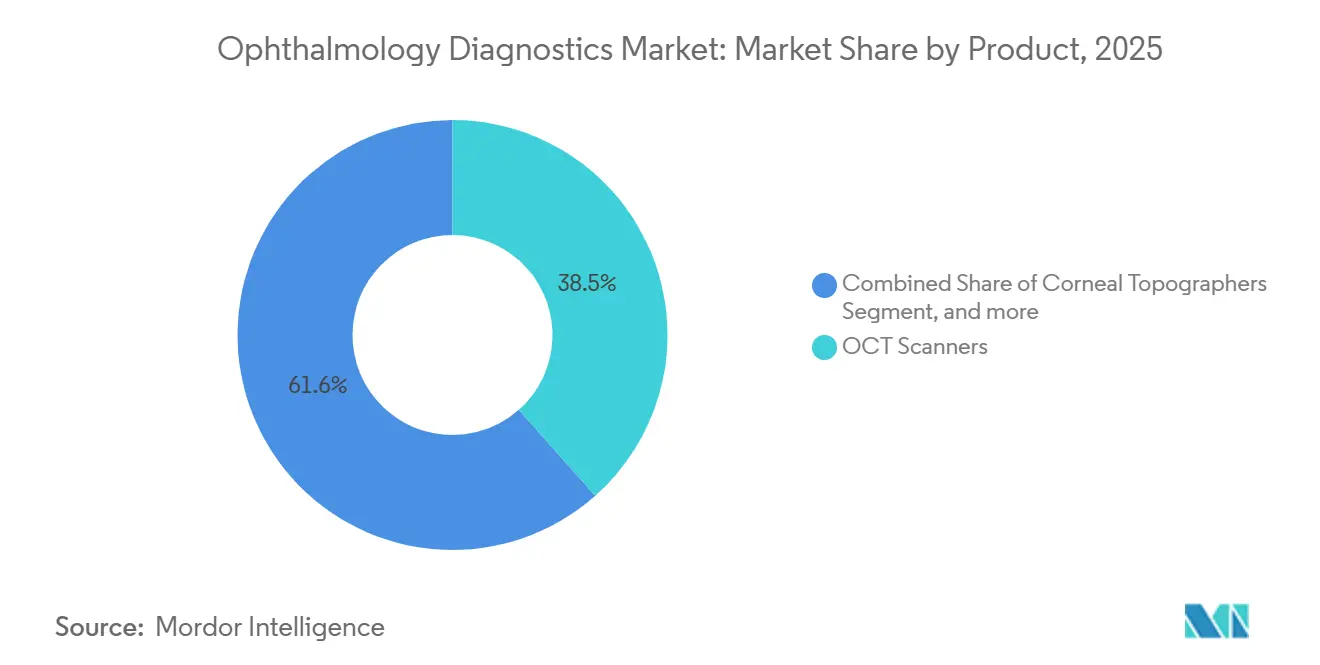
- By product, OCT scanners accounted for 38.45% of the revenue in 2025. In contrast, fundus cameras are projected to grow at the fastest rate, with a 7.58% CAGR through 2031, reflecting divergent price points and primary care adoption dynamics.
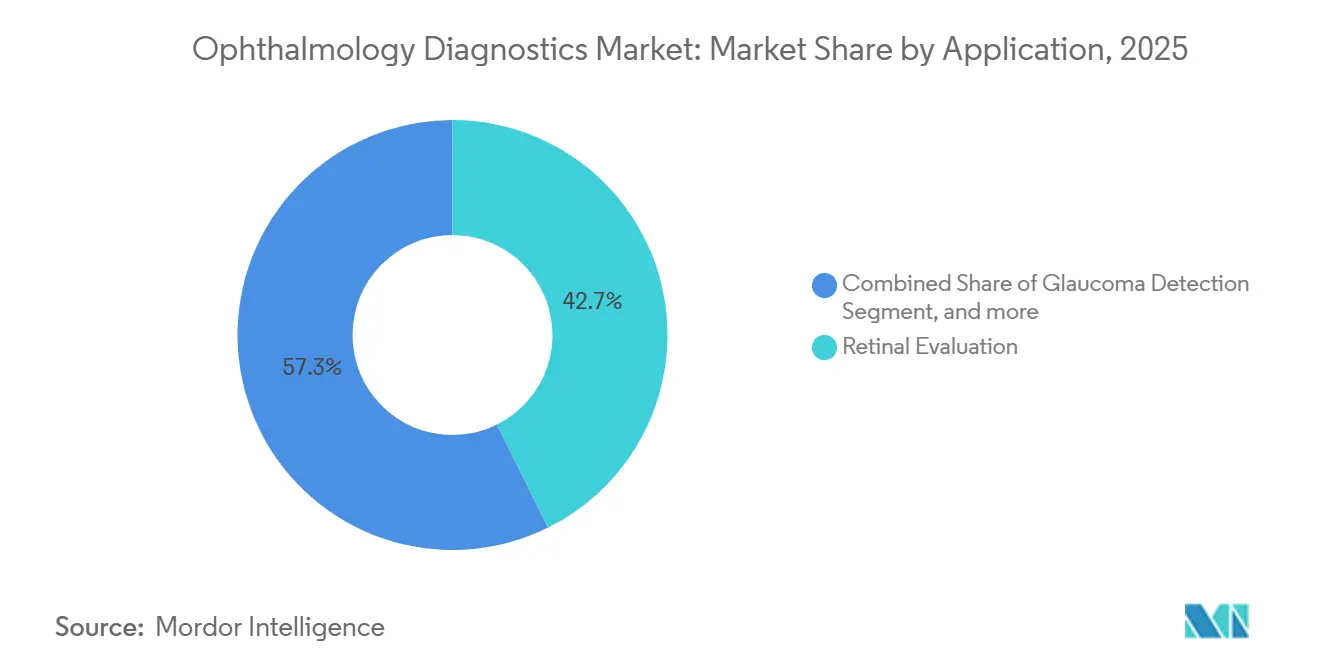
- By application, retinal evaluation led with a 42.67% revenue share in 2025, while surgical evaluation is advancing at a 7.34% CAGR, driven by the rebound in cataract surgery and gains in swept-source biometry accuracy.
- By end-user, hospitals retained a 57.54% share in 2025; however, specialty clinics showed the highest growth rate at an 8.43% CAGR, as group-practice consolidators negotiated discounts of 15–25% on equipment.
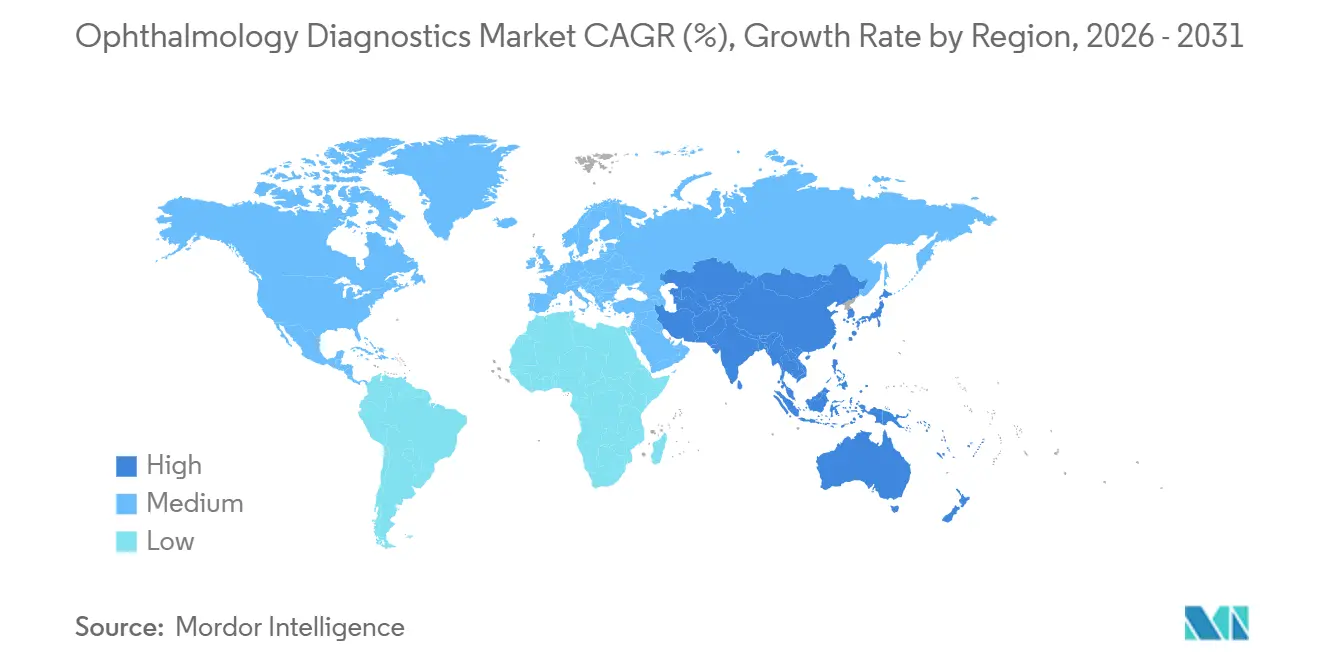
- By geography, North America commanded 41.87% of the 2025 revenue, and the Asia-Pacific region is forecast to post the fastest 6.43% CAGR through 2031, driven by the establishment of nationwide tele-ophthalmology hubs in India and the implementation of mandatory annual eye exams in China.
Note: Market size and forecast figures in this report are generated using Mordor Intelligence’s proprietary estimation framework, updated with the latest available data and insights as of January 2026.
Market Trends and Insights
Drivers Impact Analysis of Ophthalmology Diagnostics Market*
| Driver | (~) % Impact on CAGR Forecast | Geographic Relevance | Impact Timeline |
|---|---|---|---|
| Rising incidence of eye diseases due to aging population and diabetes | 1.80% | Global, with highest impact in Asia-Pacific and North America | Long term (≥ 4 years) |
| Growing adoption of OCT and AI-integrated imaging modalities | 1.50% | North America & Europe, expanding to Asia-Pacific | Medium term (2-4 years) |
| Favorable government programs for vision care | 0.90% | North America, Europe, Asia-Pacific (India, China) | Medium term (2-4 years) |
| Embedding ophthalmic diagnostics into point-of-care primary clinics via compact handheld devices | 0.70% | Global, with early gains in North America and urban Asia | Short term (≤ 2 years) |
| Integration of teleophthalmology platforms with cloud-based diagnostic analytics | 0.60% | North America, Europe, select Asia-Pacific markets | Medium term (2-4 years) |
| Source: Mordor Intelligence | |||
Rising Incidence of Eye Diseases Due to Aging Population and Diabetes
Diabetic retinopathy now affects 103 million adults worldwide, a 24% rise since 2021, while age-related macular degeneration cases are projected to reach 288 million by 2040: both trends multiply diagnostic workloads. American Diabetes Association guideline revisions in 2025 shortened screening intervals from 24 to 12 months, effectively doubling test frequency[1]American Diabetes Association, “Standards of Care 2025,” diabetes.org. Cataract procedures rebounded to 28 million in 2025, increasing demand for biometry and corneal topography equipment. India budgeted INR 12 billion (USD 144 million) to equip 3,000 primary centers with fundus cameras and autorefractors, illustrating government pull-through. The ophthalmology workforce deficit of 1 specialist per 17,000 population amplifies the imperative for automated diagnostics.
Growing Adoption of OCT and AI-Integrated Imaging Modalities
Swept-source OCT shipments expanded 18% year-over-year in 2025, fueled by deeper penetration and faster scan speeds that improve visualization of choroidal layers. Seven AI diagnostic algorithms earned U.S. FDA De Novo or 510(k) clearances between 2024 and 2025, including Notal Vision’s home-use OCT system, evidencing regulatory momentum. Cloud services, such as EyePACS, processed 1.2 million images in 2025, returning 92% of expected results within 24 hours and reducing unnecessary referrals. Reimbursement gaps outside the United States persist, with only four EU nations covering autonomous diabetic retinopathy screening as of 2025. IT integration costs per hospital run USD 50,000–150,000, tempering implementation velocity.
Favorable Government Programs for Vision Care
CPT 92229, introduced by Medicare in 2024 at USD 60 per bilateral AI screen, boosted U.S. primary-care test volume by 40% within 12 months. India’s Ayushman Bharat Digital Mission aims to embed tele-ophthalmology into 150,000 health and wellness centers by the end of 2025, reducing rural travel costs by INR 800 per visit. China’s Healthy China 2030 blueprint mandates annual eye exams for citizens over 60, expected to add 140 million diagnostic encounters per year after 2027. The European Union Medical Device Regulation harmonized CE-marking, but increased compliance spending for manufacturers, ultimately accelerating pan-EU AI launches. Saudi Arabia’s Vision 2030 funded 47 new vision centers outfitted with OCT and fundus cameras, widening access in underserved provinces.
Embedding Ophthalmic Diagnostics into Point-of-Care Primary Clinics via Handheld Devices
Handheld fundus cameras under 500 grams and priced below USD 10,000 enable on-site retinal imaging within routine primary-care visits. Optomed’s Aurora AEYE achieved 1,200 U.S. deployments by December 2025, winning 8% of diabetic-retinopathy screens formerly managed by tabletop devices. Smartphone-based Fundus-on-Phone scanned 2.3 million patients across India, Kenya, and Brazil in 2025, showing 94% concordance with standard fundus photography. Medicare reimburses handheld photography at 85% of tabletop rates, leaving a USD 12 per-exam gap that slows adoption in fee-for-service sites. Home OCT systems reduce clinic visits by 60% for macular degeneration monitoring, underscoring the potential for decentralization. AI Optics’ Sentinel camera runs for 8 hours on battery and meets the American Academy of Ophthalmology's imaging standards.
Restraints Impact Analysis of Ophthalmology Diagnostics Market*
| Restraint | (~) % Impact on CAGR Forecast | Geographic Relevance | Impact Timeline |
|---|---|---|---|
| High capital cost of advanced imaging systems | -0.8% | Global, most acute in emerging markets and small practices | Medium term (2-4 years) |
| Shortage of skilled ophthalmologists and technicians | -0.6% | Global, severe in rural areas and low-income countries | Long term (≥ 4 years) |
| Data privacy concerns hindering cloud deployment of diagnostic images | -0.3% | Europe, North America, select Asia-Pacific markets | Short term (≤ 2 years) |
| Source: Mordor Intelligence | |||
High Capital Cost of Advanced Imaging Systems
Swept-source OCT units list at USD 120,000–180,000, which exceeds the capital expenditure (cap-ex) envelope of many stand-alone practices whose annual equipment budgets typically sit below USD 200,000. Ultra-widefield cameras cost USD 80,000–150,000 and require 800–1,200 studies per year for a three-year payback at Medicare tariff levels. Leasing carries an interest rate of 6–8%, adding USD 15,000–25,000 to the cost of five-year ownership. Import tariffs of 15–30% inflate device prices in India, Brazil, and South Africa, while interest rates exceed 12%. National tenders move slowly; India delivered only 2,100 of 5,000 ordered cameras by December 2025 due to procurement delays.
Shortage of Skilled Ophthalmologists and Technicians
The global ratio is 1 ophthalmologist per 17,000 population, well below the WHO target of 1 per 10,000. U.S. practices reported a 25% vacancy rate for ophthalmic technicians in 2025, which elevated labor costs and led to throughput constraints. Residency slots have not expanded since 2020, resulting in the graduation of 475 physicians annually, despite a 12% rise in demand for cataract and retina services. Technician programs require 18–24 months and tuition ranging from USD 5,000 to USD 8,000, deterring entrants compared to faster medical-assistant tracks. Autonomous AI removes grader workload from 85% of regular retinopathy exams, but scope-of-practice laws still limit optometrists to 22 U.S. states.
*Our forecasts treat driver/restraint impacts as directional, not additive. The impact forecasts reflect baseline growth, mix effects, and variable interactions.
Ophthalmology Diagnostics Market Segment Analysis
By Product:
OCT Leadership Meets Fundus-Camera AccelerationOCT scanners generated 38.45% of the revenue in 2025, underscoring their dominance in retina, glaucoma, and posterior segment eye disorders, while fundus cameras posted the fastest 7.58% CAGR from 2026 to 2031. The Ophthalmology Diagnostics market size for fundus cameras is projected to expand as primary care practices deploy ultra-widefield devices under CPT code 92229 reimbursement. Ultra-widefield platforms capture 200-degree views in a single shot, easing exams in pediatric and cognitively challenged cohorts. Corneal-topography systems priced at USD 40,000–60,000 are gaining ground in refractive planning, although adoption tends to skew toward high-volume laser centers. Digital replacements are outpacing handheld ophthalmoscopes priced below USD 1,000; Welch Allyn reported a 12%-unit decline in 2025. Swept-source OCT, led by Topcon Triton and Zeiss PLEX Elite, captured 60% of 2025 installations by offering 100,000 A-scans per second, compared to 70,000 for spectral-domain peers, thereby trimming scan times and enhancing choroidal visualization. Regulatory hurdles are moderate; most systems can be cleared under FDA 510(k) pathways, allowing for 12–18-month development cycles.
Fundus-camera growth outpaces other categories because unit prices (USD 15,000–80,000) align with primary-care budgets. Ultra-widefield imaging enables referral-quality screening without dilation, and AI integration facilitates automated triage, reducing specialist workload by 70%. Camera makers now bundle software-as-a-service, shifting costs from capital expenditure to operating expenditure. Competitive gaps persist: smartphone attachments match 94% diagnostic concordance yet still face partial reimbursement. The product mix is expanding to include multimodal devices that combine OCT, OCT-A, and fundus photography, as evident in Heidelberg Engineering’s Spectralis platform, which captured 35% of European tertiary-center spend in 2025.



By Application:
Retinal Dominance, Surgical MomentumRetinal evaluation accounted for 42.67% of the 2025 revenue from mandatory screening for diabetic retinopathy and age-related macular degeneration. The Ophthalmology Diagnostics market share linked to surgical assessment is increasing the fastest, growing at a 7.34% CAGR as cataract procedures surpass 28 million annually and surgeons rely on swept-source biometry with accuracy of 10 microns[2]European Society of Cataract and Refractive Surgeons, “Clinical Survey 2025,” escrs.org. Barrett Universal II and other fourth-generation formulas, embedded in modern biometers, have improved IOL prediction in post-LASIK eyes, now accounting for 18% of developed-market cataract cases. OCT-angiography straddles application lines, helping detect early glaucoma via optic-nerve perfusion mapping, thus broadening its TAM. Glaucoma detection expanded by 6.1% in 2025, as guidelines encouraged earlier intervention for intraocular pressures above 21 mmHg. Autorefractor-based refraction assessment grows in parallel with a 4.2% uptick in eye-exam volumes as telehealth retailers scale. Corneal topography and pachymetry remain niche, but they rose 5.8% in the Asia-Pacific region as LASIK volumes climbed 14% during 2025.
By End-User:
Hospital Core, Specialty-Clinic AccelerationHospitals held 57.54% of the revenue in 2025, reflecting the entrenched presence of tertiary imaging for complex cases. However, specialty clinics are expected to grow at an 8.43% CAGR to 2031, as private-equity platforms assemble groups with 200-plus locations and command double-digit vendor discounts. EyeCare Partners deployed 120 OCTs and 200 fundus cameras in 2025, leveraging its network scale. Ambulatory surgery centers performed 40% of U.S. cataract surgeries in 2025, facilitating the migration of biometry and corneal topography outside hospital walls. Medicare site-neutral payment cuts reduced hospital reimbursement by 15% for diagnostic imaging, accelerating the shift toward outpatient care. Optical retail chains and mobile vans expanded 6.2% after Walmart and Costco installed digital phoropters to ease throughput. Tele-ophthalmology extended reach: Federally qualified centers deployed 1,200 handheld cameras, capturing 8% of the diabetic retinopathy screening volume.
Geography Analysis
North America Ophthalmology Diagnostics Market
North America generated 41.87% of the revenue in 2025, anchored by CPT 92229 reimbursement, which spiked primary-care screens by 40% in the first year. Ophthalmologist saturation in urban areas, combined with negotiated rate cuts of 8–12% by Medicare Advantage plans, tempers growth. Private-equity consolidation now covers 60% of U.S. practices with five or more physicians, aggregating purchasing leverage and reducing equipment prices by 15–25%. Canada lags in advanced imaging; only four provinces reimburse OCT-angiography for diabetic macular edema.
APAC Ophthalmology Diagnostics Market
Asia-Pacific is poised for a 6.43% CAGR, the swiftest regional climb, with India scaling tele-ophthalmology to 500 districts by 2027 and China mandating annual exams for seniors under Healthy China 2030[3]National Health Commission of China, “Healthy China 2030 Vision Care Roadmap,” nhc.gov.cn. India added 2,100 fundus cameras in 2025, yet still reaches only 15% of its primary-care targets. Japan’s myopia prevalence (40% of adults) drives swept-source OCT adoption, now 55% of new installations. Domestic Chinese vendors priced 40% below multinationals, winning a 22% share of the fundus-camera market, although false-negative rates are 8% higher in validation studies.
Europe Ophthalmology Diagnostics Market
Europe contributed 28% of 2025 revenue but faces GDPR-driven cloud hesitancy, which is pushing 40% of practices toward on-premise data stores and increasing IT spend. Germany and France reimburse OCT-angiography nationally; however, southern markets struggle with budget limits. The United Kingdom’s NHS placed 180 OCTs in community optometry sites, cutting glaucoma referral wait times from 12 to 3 weeks.
MEA and South America Ophthalmology Diagnostics Market
The Middle East & Africa posted 5.8% growth, driven by Saudi Vision 2030 funding for 47 vision centers in 2025. Sub-Saharan Africa still supports only 1 ophthalmologist per 250,000 people; smartphone-based screening by Peek Vision covered 400,000 patients in 2025. South America advanced 5.2%; Brazil tendered 1,200 cameras, but import tariffs and delivery delays curbed deployment.

Regulatory Landscape
In the United States, ophthalmology diagnostic devices (including OCT systems, fundus cameras, and AI software used for screening) commonly enter the market through FDA 510(k) pathways, with continued momentum in ophthalmic imaging and autonomous screening software clearances. In May 2026, Heidelberg Engineering received FDA 510(k) clearance for SPECTRALIS HRA+OCT and variants. In July 2026, iHealthScreen received an FDA 510(k) clearance (K253704) for iPredict-DR, an AI-powered software tool for automated diabetic retinopathy screening using retinal fundus images, reinforcing the pace of SaMD and imaging-platform updates moving into routine care settings.
In Europe, the EU Medical Device Regulation (MDR) and the staged roll-out of EUDAMED continue to shape compliance planning, documentation, and post-market obligations across the installed base of ophthalmic diagnostics. Following EU Regulation 2024/1860 (adopted June 2024) that set the framework for gradual EUDAMED deployment, the EUDAMED UDI/device registration module became mandatory in May 2026 for medical device registration, increasing the need for structured device master data management across product families. Standards updates also influence technical documentation and procurement requirements, including ISO 11979-1:2026 (published February 2026) for intraocular lens vocabulary and EN ISO 10322:2026 (published April 2026) for ophthalmic optics semi-finished blanks.
Value Chain Analysis
The value chain spans optical and imaging component suppliers (lenses, sensors, illumination, precision mechanics), system integration and manufacturing (OCT scanners, fundus cameras, biometers, topographers), and a growing software layer for AI-enabled screening, workflow, and cloud analytics. Leading OEMs such as Carl Zeiss Meditec, Topcon, NIDEK, Heidelberg Engineering, Canon, Visionix, and Lumibird combine in-house R&D with specialized upstream components. Compliance with interoperability requirements, for example DICOM OCT-A specifications referenced in hospital IT tenders, increasingly influences product design and validation prior to commercial release.
Downstream, distribution mixes direct sales to hospitals and specialty clinics with regional channel partners that support installation, training, servicing, and refurbishment, which is particularly relevant for high capital intensity swept-source OCT and ultra-widefield imaging platforms. Adoption of autonomous AI screening in primary care also adds new intermediaries, including tele-ophthalmology networks and image-management platforms that connect clinics to diagnostic analytics and payer workflows. The chain is further shaped by regulatory processes for AI-as-a-medical-device and software lifecycle management, including FDA approaches that allow controlled algorithm changes under defined plans, affecting how vendors structure subscriptions, updates, and service contracts across the device life.
Competitive Landscape
The ophthalmology diagnostics industry exhibits moderate concentration, with the five largest manufacturers—Zeiss Meditec, Topcon, Heidelberg Engineering, Canon, and Nidek—collectively accounting for 55% of the revenue in 2025. Patent thickets surrounding swept-source OCT and OCT angiography keep barriers high; Zeiss filed 47 imaging patents between 2024 and 2025. Heidelberg’s multimodal Spectralis platform won 35% European tertiary-center OCT bids in 2025 by combining OCT, OCT-A, and fundus photography. Alcon’s partnership with Visionix bundles autorefractors into surgical ecosystems, illustrating vertical bundling. Notal Vision commercialized home OCT at USD 4,800, disrupting in-clinic models by undercutting capital expenditures by 70%. Eyenuk processed 800,000 AI diabetic-retinopathy exams for USD 15 per test, one-quarter the cost of manual review, and won four Medicare Advantage contracts. Smartphone attachments, such as Fundus-on-Phone and Sentinel, achieve 94% diagnostic concordance yet face reimbursement ceilings. Traditional ophthalmoscope suppliers lost traction; Welch Allyn reported a 12%-unit decline in 2025. Standards bodies stiffen interoperability demands; DICOM’s 2024 OCT-A specification is now a gating factor in hospital IT tenders.
Ophthalmology Diagnostics Industry Leaders
Topcon Corporation
Ziemer Ophthalmic Systems AG
Alcon Inc.
NIDEK CO., LTD
Canon Inc.
- *Disclaimer: Major Players sorted in no particular order
Ophthalmology Diagnostics Market Companies Covered in this Report
- Alcon
- Bausch + Lomb Corporation
- Canon
- Carl Zeiss
- Coburn Technologies
- EssilorLuxottica
- HAAG-Streit
- Heidelberg Engineering
- Johnson & Johnson
- Lumenis
- Lumibird Group SA
- Marco Ophthalmic
- Metall Zug Group (Haag-Streit Holding)
- Nidek
- Optos plc (Nikon Corporation)
- Optovue Inc. (Visionix)
- Quantel Medical (Lumibird)
- Topcon
- Visionix Ltd.
- Ziemer Group

Market Opportunities and Future Outlook
A near-term opportunity is scaling autonomous diabetic retinopathy screening beyond specialist settings by pairing cleared AI software with fundus imaging fleets already being deployed into primary care and community clinics. In July 2026, iHealthScreen received an FDA 510(k) clearance (K253704) for iPredict-DR automated diabetic retinopathy screening software that works with retinal fundus images from iCare DRSplus cameras. This expands the pool of eligible sites that can operationalize reimbursed screening workflows where coverage exists and strengthens acceptance of stand-alone SaMD within screening programs.
Another whitespace area is cost-down and decentralization of testing, where low-cost devices and home-based screening concepts reduce dependence on scarce technicians and high-cost imaging rooms. Evidence from 2026 research includes prototypes such as an AI-integrated portable scanning slit-light device reported with material costs below USD 500, and ongoing clinical trials of a low-cost (USD 42) AI-driven at-home visual field screening approach using smartphone and VR headset hardware. These directions create room for vendors to combine handheld imaging, home monitoring, and cloud analytics into service models suited to specialty clinics and tele-ophthalmology programs, while also aligning product roadmaps to evolving data-governance and device-registration requirements such as the EU MDR and EUDAMED modules that became mandatory for registration in 2026.
Recent Industry Developments in Ophthalmology Diagnostics Market
- July 2026: iHealthScreen received US FDA 510(k) clearance (K253704) for iPredict-DR, an AI-powered software for automated diabetic retinopathy screening using retinal fundus images captured on iCare DRSplus cameras. The clearance advances the use of stand-alone screening software in primary care workflows and supports commercialization of autonomous screening pathways alongside connected imaging fleets.
- July 2025: Topcon Healthcare acquired Intelligent Retinal Imaging Systems (IRIS), expanding its position in cloud-based retinal screening and connected care workflows. The deal strengthened Topcon's ability to bundle imaging hardware with screening software and data services for primary care and community-based programs.
- April 2024: Optomed's Aurora AEYE handheld fundus camera earned FDA clearance, supporting deployment of compact retinal imaging in non-specialist settings. This clearance helped accelerate point-of-care screening models that shift volume from hospitals to clinics by lowering space and setup barriers for retinal imaging.


Ophthalmology Diagnostics Market Report Scope and Research Methodology
Market Definition and Coverage
We define the ophthalmology diagnostics market as revenues generated from eye diagnostic equipment and related diagnostic procedures used to detect, measure, and monitor ocular conditions in clinical settings.
Scope exclusions: In this methodology, vision correction products (such as contact lenses and spectacle lenses) and surgical treatment devices are excluded unless they are sold and used primarily for diagnostic testing.
Segments Covered in This Report
- By Product
- Corneal Topographers
- Fundus Cameras
- Ophthalmoscopes
- OCT Scanners
- Retinoscopes
- Refractors
- Other Products
- By Application
- Retinal Evaluation
- Glaucoma Detection
- Surgical Evaluation
- Refraction Assessment
- Other Applications
- By End-User
- Hospitals
- Specialty Clinics
- Other End-Users
- Geography
- North America
- United States
- Canada
- Mexico
- Europe
- Germany
- United Kingdom
- France
- Italy
- Spain
- Rest of Europe
- Asia-Pacific
- China
- Japan
- India
- Australia
- South Korea
- Rest of Asia-Pacific
- Middle East & Africa
- GCC
- South Africa
- Rest of Middle East & Africa
- South America
- Brazil
- Argentina
- Rest of South America
- North America
Data Sources, Market Sizing, and Validation
Desk Research
Desk research was used to build the base structure of the model and to keep assumptions realistic across regions and care settings. We relied on public sources such as the World Health Organization, the International Agency for the Prevention of Blindness, the US CDC, the US FDA device database, and OECD health statistics to capture disease burden, screening behavior, and the pace of technology adoption.
To convert these signals into market math, we also reviewed annual reports and investor presentations, and we checked reputable medical journals to understand test utilization context. Association websites were also reviewed to map clinical guidelines to preferred diagnostic workflows. Where needed, paid subscriptions were used for company financials and intelligence, and patent databases were used to gauge innovation momentum across imaging and refraction tools. These sources are not exhaustive, and other references were used to collect data, validate assumptions, and clarify gaps during research.
Primary Interviews and Surveys
Primary work focused on validating what gets purchased and used in day-to-day eye exams, and how replacement cycles and service contracts affect realized revenues. We spoke with hospital procurement stakeholders, specialty eye clinics, distributors, and technical experts across major regions, so utilization patterns, pricing ranges, and adoption timing could be cross-checked before aligning inputs to the model.
Distribution of primary research fieldwork respondents
| Company type | Respondent position | Region |
|---|---|---|
| Top tier: 30% | CXOs: 18% | APAC: 43% |
| Mid tier: 49% | Functional/Unit leaders: 27% | EMEA: 34% |
| Smaller Players: 21% | Managers: 55% | Americas: 23% |
Market-Sizing & Forecasting
The core sizing logic uses a top-down approach where the treated and screened eye-care demand pool is reconstructed by region and then translated into diagnostic volumes. Those volumes are then mapped to the mix of tests and equipment typically used, and finally converted into value using realistic average selling prices and service revenue assumptions.
To keep totals grounded, results are corroborated with selective bottom-up approximations using supplier revenue split checks, sampled ASP times installed-base additions, and channel feedback on high-movement product categories. When a country level data point is missing, we bridge gaps using proxy indicators such as ophthalmologist density, diabetes prevalence, age mix, outpatient visit levels, and typical exam frequency.
Forecasts are built using scenario analysis supported by simple trend fits. Inputs like aging population, diabetic eye disease screening uptake, replacement cycles for imaging systems, and pricing movement in key modalities are adjusted based on what experts expect in their markets. The final output remains repeatable because each step ties back to clear variables and documented assumptions that can be re-checked and updated.
Data Validation & Update Cycle
Outputs are tested through multiple cross-checks so that market value reflects more than a single data stream. We compare implied device shipments, installed-base growth, and utilization intensity against what interviews and public indicators suggest, and then investigate outliers before sign-off.
Before publication, estimates are reviewed in steps, including internal consistency checks across regions and product groups. Re-contacts are triggered when a variance cannot be explained by pricing, mix, or timing. Reports are refreshed annually, and material events such as policy changes, major recalls, or sharp pricing moves lead to interim updates when needed. Right before delivery, an analyst performs a fresh pass so clients receive the latest updated view.
Mordor Intelligence's Ophthalmology Diagnostics Market Size Compared Against Other Published Estimates
Published estimates for ophthalmology diagnostics often vary because the counted products and revenue streams are not consistent across sources, and the base year selected can shift the starting point. Differences also show up when one model leans heavily on manufacturer revenues, while another leans more on procedure activity and utilization.
For this market, the biggest gap drivers are usually whether slit lamps and broader optometry exam tools are included, how service contracts and software are treated, and how pricing is converted across currencies and timing. The spread also widens when growth is projected using aggressive adoption curves for imaging upgrades, without checking replacement cycles and installed-base constraints in clinics and hospitals.
Benchmark comparison
| Source | Market Size | Gaps in Research Methodology |
|---|---|---|
| Mordor Intelligence | USD 9.02 B (2025) | |
| Industry Publisher A | USD 9.48 B (2024) | Uses a different base year and tends to include a wider set of exam-room devices and tests, which can pull more optometry-adjacent revenues into the total and shift the value upward when converted to USD. |
| Global Advisory B | USD 7.10 B (2024) | Appears to apply a narrower product scope that emphasizes imaging-led diagnostics and may treat service and maintenance revenues inconsistently, which can keep the total lower even if unit adoption is rising. |
The table shows that scope and year alignment matter as much as the math itself, especially around what counts as a diagnostic revenue line versus a general exam tool. By keeping products tied to ophthalmic diagnostic use, validating utilization and replacement cadence with interviews, and then updating the pricing and mix assumptions on a regular schedule, the estimate stays traceable to real demand drivers, a modeling choice applied by Mordor Intelligence.


Key Questions Answered in the Report
What is the forecast value of the Ophthalmology Diagnostics market by 2031?
The ophthalmology diagnostics market is projected to reach USD 12.32 billion by 2031.
Which product category is expected to grow the fastest through 2031?
Fundus cameras, especially ultra-widefield models with integrated AI, are poised for the fastest 7.58% CAGR.
Which region shows the highest growth outlook?
Asia-Pacific is forecast to expand at a 6.43% CAGR driven by India's tele-ophthalmology hubs and China's mandatory senior eye exams.
How do handheld fundus cameras impact primary-care screening?
Handheld cameras allow in-office imaging, trimming diabetic-retinopathy referral time from weeks to minutes and capturing 8% of U.S. screening volume in 2025.
What is the major restraint limiting emerging-market adoption?
High capital cost of advanced OCT and fundus systems, compounded by 15-30% import tariffs and scarce low-interest financing options, slows uptake.
Which companies dominate swept-source OCT?
Zeiss, Topcon, and Heidelberg Engineering maintain leadership via patent portfolios and integrated multimodal platforms.
Page last updated on:


 Your data is secure and never sold or shared.


