Medical Fiber Optics Market Size and Share
Market Overview
| Study Period | 2020 - 2031 |
|---|---|
| Market Size (2026) | USD 1.51 Billion |
| Market Size (2031) | USD 2.03 Billion |
| Growth Rate (2026 - 2031) | 6.07% CAGR |
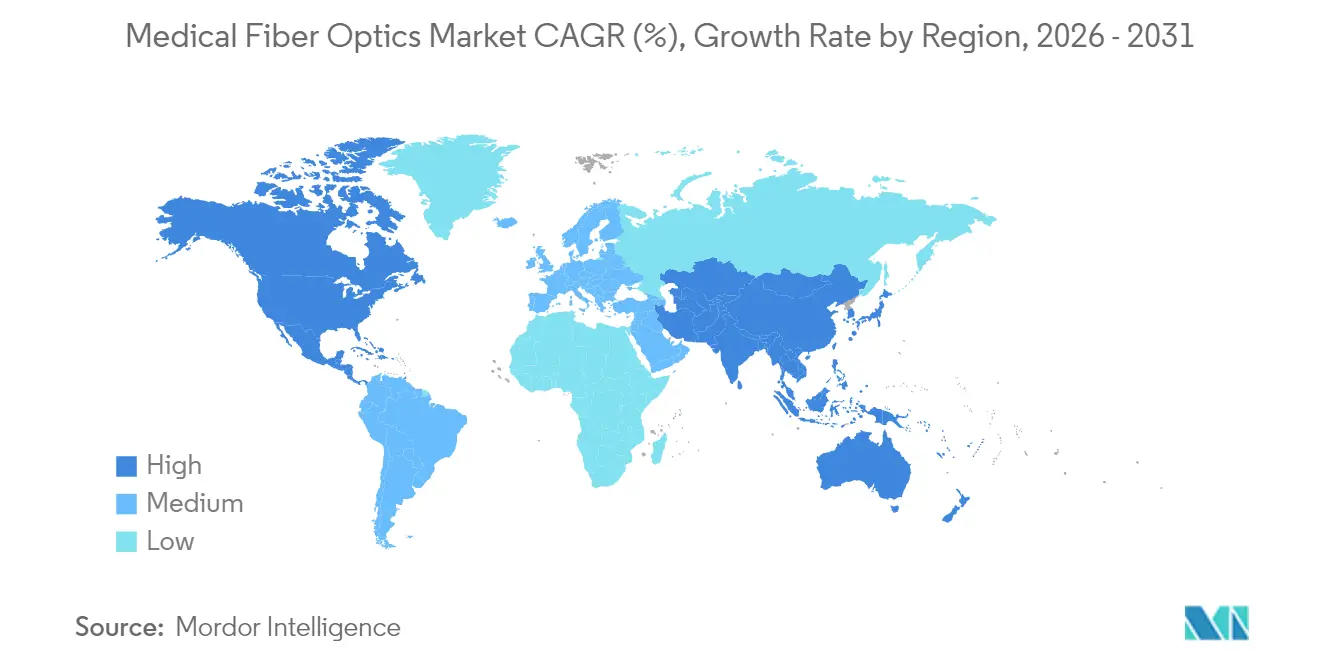
| Fastest Growing Market | Asia-Pacific |
| Largest Market | North America |
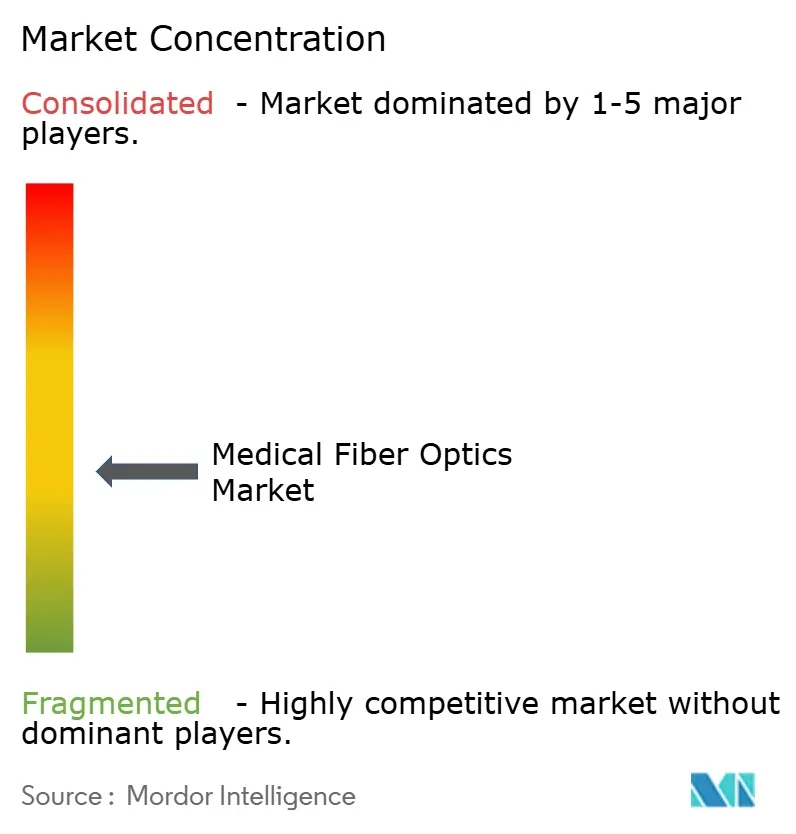
| Market Concentration | Medium |
Major Players *Disclaimer: Major Players sorted in no particular order Image © Mordor Intelligence. Reuse requires attribution under CC BY 4.0. | |
Medical Fiber Optics Market Analysis by Mordor Intelligence
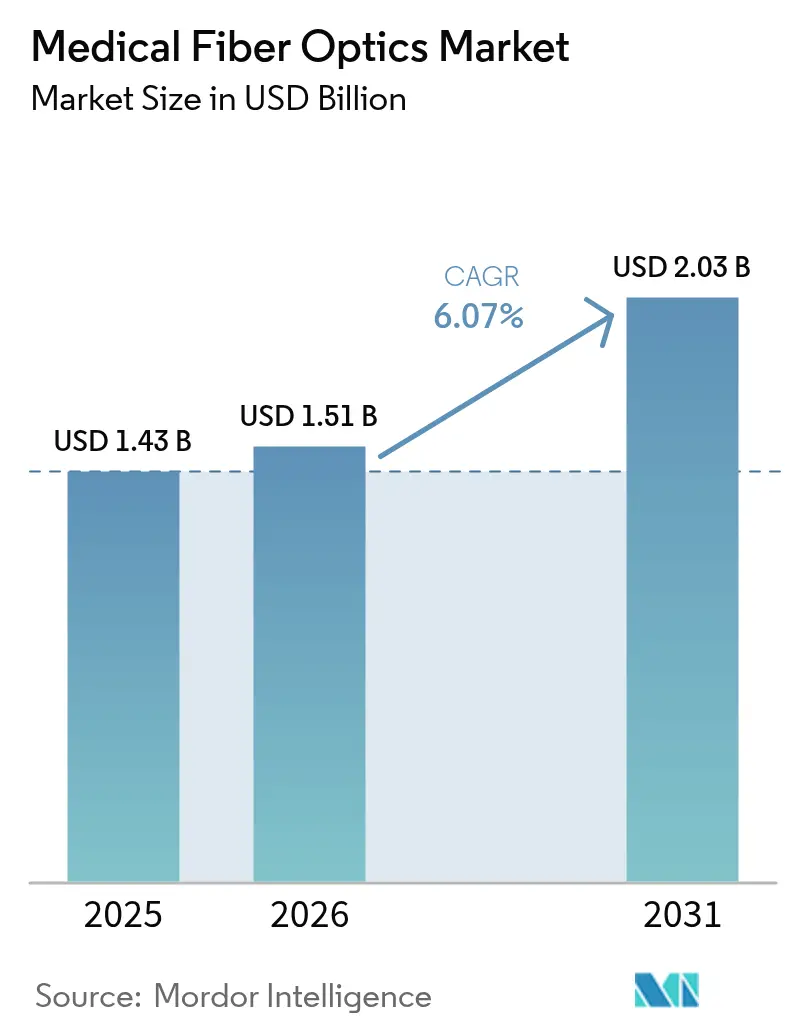
The Medical Fiber Optics Market size is projected to be USD 1.43 billion in 2025, USD 1.51 billion in 2026, and reach USD 2.03 billion by 2031, growing at a CAGR of 6.07% from 2026 to 2031.
Growth is propelled by wider use of thulium fiber lasers in lithotripsy, the integration of fiber Bragg grating (FBG) sensors for real-time monitoring, and a steady migration toward outpatient settings where disposable or low-maintenance optical systems lower procedural costs. Specialty optical fibers outperform multimode silica fibers for higher-power surgical applications, as greater beam quality is required, while chip-on-tip imaging continues to erode the legacy fiberscope base in low-acuity bronchoscopy and cystoscopy. Regional momentum is strongest in Asia-Pacific, supported by China’s USD 1 trillion hospital build-out and India’s production-linked incentive scheme aimed at USD 50 billion in domestic device output by 2030. Meanwhile, North American reimbursement parity between hospitals and ambulatory surgical centers (ASCs) is accelerating shifts in procedures toward portable, single-use optical assemblies.
Key Report Takeaways
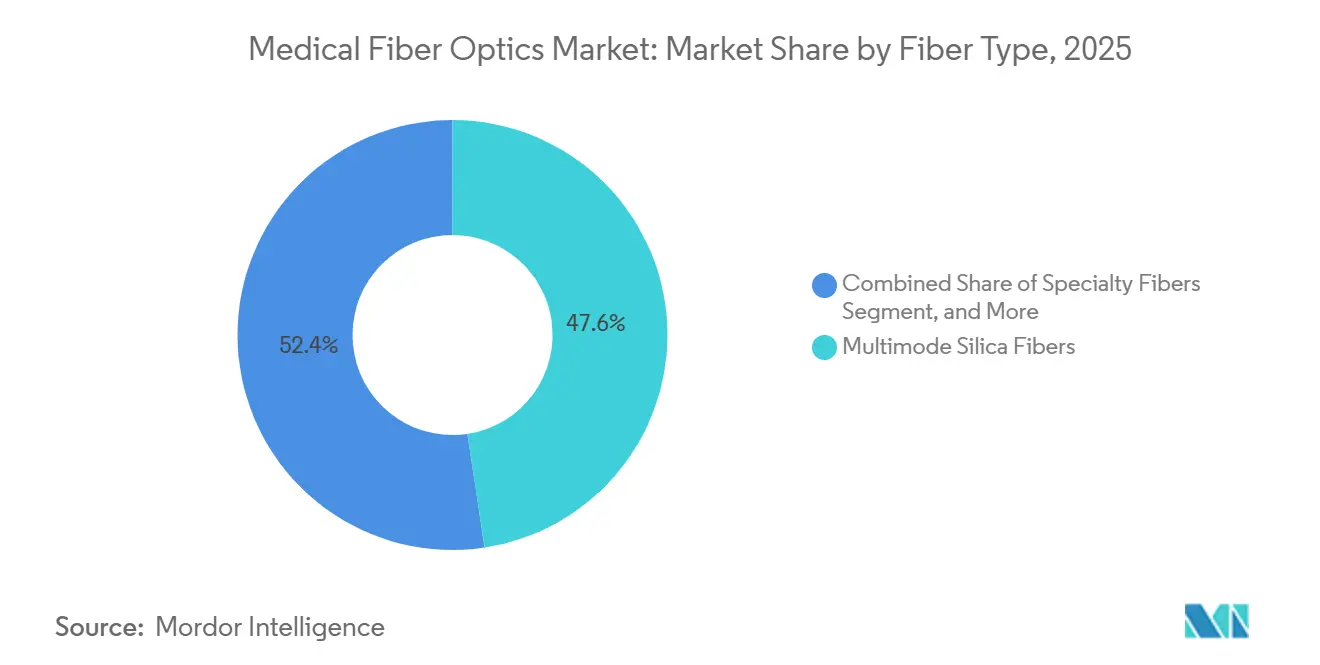
- By fiber type, multimode silica accounted for 47.62% of the medical fiber-optics market share in 2025, yet specialty fibers are forecast to grow at a 7.06% CAGR through 2031.
- By product type, imaging fiberscopes led with a 51.47% share in 2025, while fiber-optic sensors record the highest projected CAGR at 7.99% to 2031.
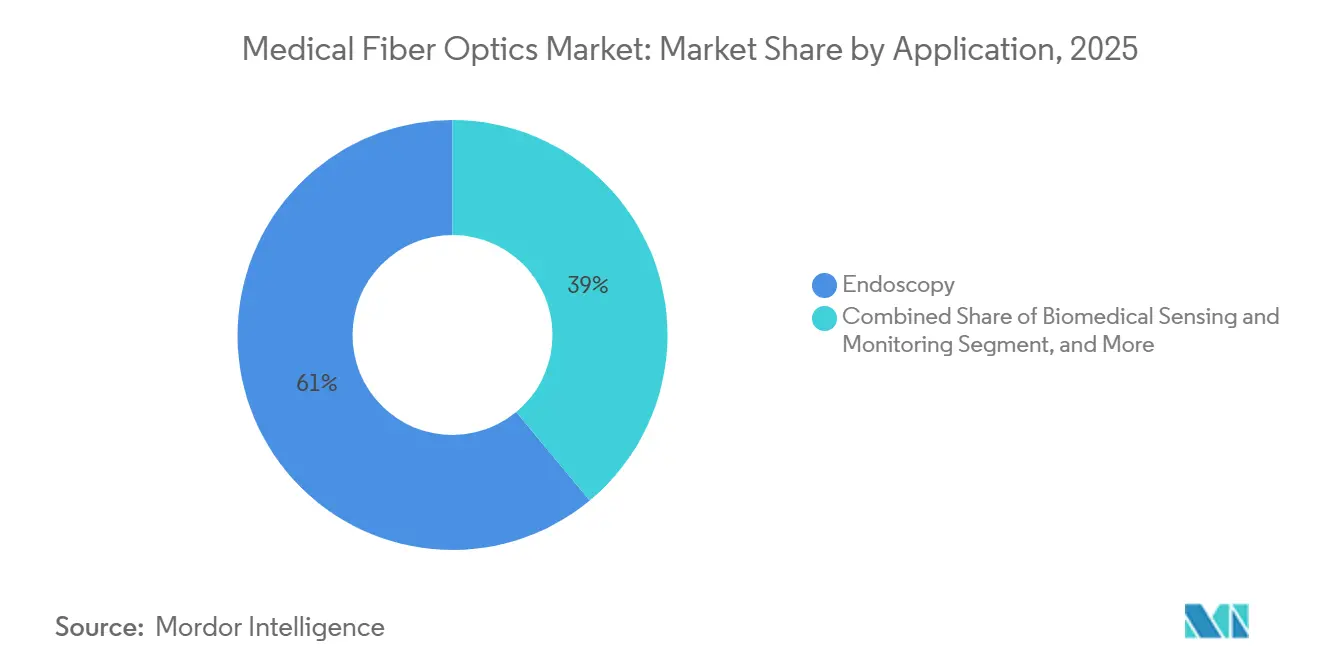
- By application, endoscopy accounted for 61.02% of the medical fiber-optics market in 2025; biomedical sensing is poised to expand at a 6.78% CAGR over 2026-2031.
- By end user, hospitals accounted for 44.38% of revenue in 2025, although ASCs are growing fastest at a 6.98% CAGR on the back of Medicare payment parity.
- By geography, North America accounted for 39.11% of 2025 revenue, while Asia-Pacific is projected to grow at a 9.35% CAGR, the strongest regional trajectory.
Note: Market size and forecast figures in this report are generated using Mordor Intelligence’s proprietary estimation framework, updated with the latest available data and insights as of 2026.
Global Medical Fiber Optics Market Trends and Insights
Drivers Impact Analysis*
| Driver | (~) % Impact on CAGR Forecast | Geographic Relevance | Impact Timeline |
|---|---|---|---|
| Rising Adoption of Minimally Invasive Surgeries | +1.8% | Global, led by North America & Europe | Medium term (2-4 years) |
| Growing Prevalence of Gastrointestinal & Pulmonary Diseases Driving Endoscopy Volumes | +1.5% | Global, acute in Asia-Pacific | Long term (≥ 4 years) |
| Demand For High-Resolution Imaging for Precision Diagnostics | +1.1% | North America, Europe, Japan | Short term (≤ 2 years) |
| Expansion of Fiber-Laser–Based Surgical Procedures Such as Lithotripsy | +0.9% | Global, early gains in US, Germany, South Korea | Medium term (2-4 years) |
| Emerging Integration of Fiber Bragg Grating Sensors for Real-Time Physiological Monitoring | +0.6% | North America & EU, spill-over to APAC | Long term (≥ 4 years) |
| Development of Sterilizable Polymer Optical Fibers Enabling Disposable Devices | +0.4% | Global, niche adoption in ASCs | Long term (≥ 4 years) |
| Source: Mordor Intelligence | |||


Rising Adoption of Minimally Invasive Surgeries
Minimally invasive techniques accounted for 62% of U.S. surgical cases in 2025, up from 54% in 2020, as robotic platforms shortened length of stay by 1.8 days and reduced infection rates by 35% compared with open surgery. Intuitive Surgical delivered 1,707 da Vinci systems in 2024, with 48% of usage concentrated in colorectal and urology, both of which are heavily dependent on fiber-optic illumination. Single-use robotic instruments with disposable light guides are gaining favor because they bypass the USD 280 per-scope-cycle reprocessing costs. Medicare’s 2024 authorization for ASC robotic prostatectomies lifted outpatient robotic cases by 22% within a year, reinforcing demand for compact medical fiber-optics market solutions tailored to ambulatory workflows.[1]Centers for Medicare & Medicaid Services, “Physician Fee Schedule,” CMS, cms.gov ISO 13485 certification remains a prerequisite for component suppliers, extending development by up to 12 months and raising the entry bar.
Growing Prevalence of Gastrointestinal & Pulmonary Diseases Driving Endoscopy Volumes
U.S. colorectal screening compliance among eligibles reached 72% in 2025 after the start age fell to 45 years, adding several million annual colonoscopies. China performed 28.6 million upper-GI endoscopies in 2024, a 12% upswing linked to province-wide gastric cancer programs. COPD prevalence in India climbed to 6.2% of adults, prompting a 19% jump in bronchoscopies for early lung-cancer work-up. Although flexible fiberscopes remain dominant, Ambu’s disposable chip-on-tip scopes seized 18% of bronchoscopy volume in 2025, chiefly in ICUs where infection risk is acute. Reimbursement still rewards reusable optics, with Medicare paying USD 220 for a biopsy colonoscopy compared with USD 195 for single-use devices, sustaining higher-end imaging bundles. Facilities must also budget USD 180,000 annually for ISO 11135 ethylene-oxide process validations, nudging customers toward durable, high-definition fiber sets.
Demand for High-Resolution Imaging for Precision Diagnostics
A 2024 multicenter trial showed that 4K endoscopy cut polyp-resection time by 14% and increased adenoma detection by 8 percentage points compared with 1080p systems.[2]J. Zhang et al., “4K Endoscopy Improves Polyp Detection,” BMJ Open Gastroenterology, bmj.com Olympus shipped 4,200 4K platforms in fiscal 2024, a 27% rise as hospitals chase value-based reimbursement thresholds. Multicore fiber bundles with more than 50,000 fibers/mm² have reduced manufacturing yields to 68% and raised component prices by 18% since 2023. Wavefront-shaped, single-fiber lensless prototypes have achieved 2 µm resolution in animals, hinting at future disruption, yet a commercial launch remains 3+ years away. In March 2025, the FDA’s draft guidance introduced mandatory image-quality metrics, adding up to 6 months to 510(k) approvals.
Expansion of Fiber-Laser–Based Surgical Procedures Such as Lithotripsy
Thulium fiber lasers captured 34% of U.S. lithotripsy by 2025, up from 18% in 2023, as their pulse profiles lowered stone retropulsion 62% relative to holmium lasers. IPG Photonics reported 23% medical-laser revenue growth in 2024 on TFL demand from ASCs where shorter anesthesia (38 minutes versus 52 minutes) adds throughput. Hollow-core photonic-crystal fibers lessen thermal tip damage by 41%, extending life from 80 to 140 cases and trimming consumables to USD 195 per procedure. The FDA recorded 127 reports of laser-fiber breakage in 2024, prompting universal adoption of ISO 11979 biocompatibility tests and in-line FBG integrity sensing. South Korea’s reimbursement listing in April 2024 triggered a 41% local volume leap by year-end.
Restraints Impact Analysis*
| Restraint | (~) % Impact on CAGR Forecast | Geographic Relevance | Impact Timeline |
|---|---|---|---|
| High Cost and Fragility of Silica Fiber Components | -1.2% | Global, acute in price-sensitive APAC | Short term (≤ 2 years) |
| Stringent Regulatory and Sterilization Compliance Requirements | -0.9% | North America, Europe, Japan | Medium term (2-4 years) |
| Limited Supply of Rare-Earth Dopants for Specialty Medical Fibers | -0.6% | Global, supply concentrated in China | Long term (≥ 4 years) |
| Substitution Threat from CMOS Chip-On-Tip Disposable Scopes | -1.4% | North America, Europe, early APAC adopters | Short term (≤ 2 years) |
| Source: Mordor Intelligence | |||
High Cost and Fragility of Silica Fiber Components
Coherent imaging bundles with ≥30,000 fibers/mm² cost USD 1,200-1,800 each and account for up to 28% of a flexible endoscope’s bill of materials; breakage averages 3.8 per 100 cases, resulting in USD 2,400 repair bills and elongating hospital replacement cycles to 7 years. Ultra-high-resolution yields fall below 60%, inflating prices another 32%. Apollo Hospitals cut new purchases by 14% in fiscal 2024, favoring refurb units and CMOS scopes. California scrutiny of PFAS jacketing could demand costly reformulation, with early estimates topping USD 4 million per product line.[3]California Department of Toxic Substances Control, “Safer Consumer Products Program,” dtsc.ca.gov
Stringent Regulatory and Sterilization Compliance Requirements
FDA 510(k) packages for fiber-optic scopes run USD 495,000 before clinical data, and Europe’s MDR adds USD 140,000 in annual audits plus six to nine months of delay. Ethylene-oxide residuals require 14-day aeration, immobilizing roughly USD 1.8 million in inventory for mid-tier firms. China upgraded fiber lasers to Class III devices in March 2024, requiring local trials and extending the clearance period to 18-24 months. Japan’s PMDA often demands duplicate biocompatibility, piling on USD 320,000 per variant.
*Our forecasts treat driver/restraint impacts as directional, not additive. The impact forecasts reflect baseline growth, mix effects, and variable interactions.
Segment Analysis
By Fiber Type: Specialty Fibers Gain as Laser Surgery Demands Precision Delivery
In 2025, multimode silica accounted for 47.62% of the medical fiber-optics market; its 5.8% CAGR to 2031 trails the overall pace, as hospitals are phasing in 4K systems that favor single-mode or specialty cores. Single-mode silica, holding 28.14%, rises at 5.9% CAGR, aided by FBG sensors and coherent imaging. The specialty-fiber slice, already 24.24% in 2025, is projected to grow at a 7.06% CAGR as thulium fiber lasers and hollow-core assemblies capture high-power applications. Rare-earth constraints strain supply, yet EDFA remains the only path to > 10 W of continuous-wave output. ISO 11146 beam-quality tests add USD 45,000 per design but also elevate entry barriers, sheltering incumbents.
Specialty architectures improve signal integrity across 400-2,000 nm, allowing multi-spectral imaging for intraoperative tumor mapping. Karl Storz reported 94% sensitivity for margin detection with a seven-wavelength photonic-crystal scope, underscoring clinical pull for broadband delivery. The medical fiber-optics market for specialty fibers is forecast to expand from USD 370 million in 2026 to nearly USD 520 million by 2031. Photonic-crystal and hollow-core formats are expected to seize 29% of specialty revenue by 2031 as hospitals demand safer high-power laser conduits.


By Product Type: Fiber-Optic Sensors Surge on Real-Time Monitoring Mandates
Imaging fiberscopes accounted for 51.47% of revenue in 2025, yet posted only a 5.6% CAGR, as chip-on-tip penetration widens in low-acuity airways and urology. Laser fibers (22.18%) gain 6.3% CAGR on TFL momentum, and illumination bundles (14.92%) slow to 5.2% as integrated LEDs displace external light cables. Fiber-optic sensors, from an 8.76% baseline, post the strongest 7.99% CAGR because hospitals increasingly embed FBG or Fabry-Perot elements to comply with device-integrity mandates. IEC 60601-2-18 traceability rules add USD 120,000 yearly to mid-size OEM quality budgets yet favor sensor-equipped devices by simplifying preventive maintenance.
By Application: Biomedical Sensing Outpaces Endoscopy as Monitoring Becomes Continuous
Endoscopy, accounting for 61.02% of 2025 spend, is forecast to grow at a 5.4% CAGR as volumes level off in North America and Europe. Conversely, biomedical sensing, representing 16.34%, grows at a 6.78% CAGR with FBG-based catheters feeding continuous data to ablation consoles.
By End User: Ambulatory Surgical Centers Lead Growth as Outpatient Shift Accelerates
Hospitals maintained a 44.38% revenue hold in 2025 but posted only a 5.3% CAGR because payer policy now reimburses ASC colonoscopies at parity, saving USD 820 per case. ASCs, 28.76% of sales, swell 6.98% CAGR as they populate with compact fiber-laser consoles and single-use scopes. The medical fiber-optics industry remains anchored in hospitals for high-acuity ERCP and EUS, yet ASCs will narrow the gap by 2031, reflecting payer preference for lower-cost venues.
Geography Analysis
North America accounted for 39.11% of 2025 revenue but will grow at only a 5.1% CAGR to 2031 as procedure counts mature and CMOS scopes encroach on fiber models. ASC parity moved 19% of colonoscopies out of hospitals within 12 months, favoring lightweight, portable towers priced below USD 35,000. Canada’s budget caps extend the scope of lifecycles to 7 years; Mexico’s private chains, conversely, installed 12 Olympus 4K suites in 2024 as medical tourism rises.
Germany’s 4.2 million colonoscopies plus the United Kingdom’s mandatory high-definition screening from 2026 underpin demand. France enlarged its screening age band, yet cut tariffs by 8%, forcing hospitals to run existing optics longer. MDR annual audits of USD 140,000 pressure small suppliers, nudging the ecosystem toward integrated giants.
Asia-Pacific is the medical fiber-optics market’s growth engine, with a 24.18% share in 2025 and a 9.35% CAGR through 2031. China tallied 28.6 million upper-GI procedures in 2024 and promises continued expansion under its USD 1 trillion hospital plan. India added 340 suites in 2024, mostly refurbished fiber systems at USD 18-22 thousand each. Japan’s aging society sustains volume yet drives 15-18% annual price cuts; local OEMs therefore pivot to hybrid CMOS-fiber scopes. South Korea’s TFL reimbursement lifted laser-fiber imports 41% in 2025. Australia pared approval time to 11 months after aligning with the FDA in 2024. Regulatory harmonization under ANVISA trims device clearance to 16 months, propelling specialty sensor entries.

Competitive Landscape
The top five vendors, Olympus, Boston Scientific, Karl Storz, Stryker, and Medtronic, reflect moderate fragmentation. Olympus benefits from vertical control of fibers and endoscopes, earning 18-22% gross margin and shipping 4,200 4K systems in fiscal 2024. Boston Scientific doubles down on disposables; its EXALT Model D achieved 18% U.S. duodenoscope penetration by Q4-2025 while still leveraging internal FBG know-how. Karl Storz pushes photonic-crystal imaging, logging 94% tumor-margin sensitivity to address a USD 280 million intraoperative niche.
Disruptors intensify rivalry: Ambu’s single-use bronchoscopes erase fiber bundles entirely, already handling 18% of U.S. cases. IPG Photonics rode thulium lasers to 23% medical-laser growth in 2024, eroding holmium incumbents. Corning’s polymer fibers empower disposable scopes under USD 200, reshaping cost curves. Coherent is prototyping holmium-doped substitutes to ease rare-earth chokepoints, targeting 2026 validation.
Regulation also shapes contest dynamics. ISO 13485 onboarding costs of USD 180,000 plus USD 95,000 annually deter green-field entrants, anchoring advantage with credentialed suppliers. Intuitive Surgical’s 14 new patents on hollow-core laser channels and FBG force sensing suggest vertical expansion that could recast supplier relations post-2027.
Medical Fiber Optics Industry Leaders
Integra LifeSciences
Coherent, Inc.
Schott AG
FiberopticsTechnology, Inc
MKS Instruments (Newport Corporation)
- *Disclaimer: Major Players sorted in no particular order

Recent Industry Developments
- April 2025: Coherent Corp introduced the Axon FL fiber coupling module that raises beam delivery efficiency for photodynamic therapy systems, simplifying clinical integration.
- January 2025: Boston Scientific acquired Bolt Medical, adding advanced imaging technology to its endoscopy portfolio and broadening gastrointestinal treatment options.
- October 2024: SCHOTT AG invested EUR 50 million (USD 54 million) to enlarge its Malaysian plant, raising medical fiber capacity by 40% for Asia-Pacific customers.
- July 2024: Boston Scientific secured FDA clearance for the LithoVue Elite single-use digital ureteroscope with integrated fiber-optic illumination, expanding disposable endoscopy into urology.


Global Medical Fiber Optics Market Report Scope
Medical fiber optics are thin transparent fibers of glass or plastic that are enclosed by the material of a lower index of refraction and that transmit light throughout their length by internal reflections; a bundle of such fibers is used in various instruments such as an endoscope.
The medical fiber optics market is segmented by fiber type (single-mode optical fiber and multimode optical fiber), application (endoscopic imaging, laser signal delivery, biomedical sensing, illumination, and other applications), and geography (North America, Europe, Asia-Pacific, Middle East, and Africa, South America). The market report also covers the estimated market sizes and trends for 17 countries across major regions globally. The report offers the value (USD) for the above segments.
| Multimode Silica Fibers |
| Single-mode Silica Fibers |
| Specialty Fibers |
| Imaging Fiberscopes |
| Laser Fibers |
| Illumination Fibers |
| Fiber-optic Sensors |
| Others |
| Endoscopy |
| Biomedical Sensing & Monitoring |
| Laser Surgery |
| Phototherapy & Photodynamic Therapy |
| Dental Procedures |
| Others |
| Hospitals |
| Ambulatory Surgical Centers |
| Specialty Clinics |
| Research Laboratories & Academic Institutes |
| Others |
| North America | United States |
| Canada | |
| Mexico | |
| Europe | Germany |
| United Kingdom | |
| France | |
| Italy | |
| Spain | |
| Rest of Europe | |
| Asia-Pacific | China |
| Japan | |
| India | |
| Australia | |
| South Korea | |
| Rest of Asia-Pacific | |
| Middle East & Africa | GCC |
| South Africa | |
| Rest of Middle East & Africa | |
| South America | Brazil |
| Argentina | |
| Rest of South America |
| By Fiber Type | Multimode Silica Fibers | |
| Single-mode Silica Fibers | ||
| Specialty Fibers | ||
| By Product Type | Imaging Fiberscopes | |
| Laser Fibers | ||
| Illumination Fibers | ||
| Fiber-optic Sensors | ||
| Others | ||
| By Application | Endoscopy | |
| Biomedical Sensing & Monitoring | ||
| Laser Surgery | ||
| Phototherapy & Photodynamic Therapy | ||
| Dental Procedures | ||
| Others | ||
| By End User | Hospitals | |
| Ambulatory Surgical Centers | ||
| Specialty Clinics | ||
| Research Laboratories & Academic Institutes | ||
| Others | ||
| By Geography | North America | United States |
| Canada | ||
| Mexico | ||
| Europe | Germany | |
| United Kingdom | ||
| France | ||
| Italy | ||
| Spain | ||
| Rest of Europe | ||
| Asia-Pacific | China | |
| Japan | ||
| India | ||
| Australia | ||
| South Korea | ||
| Rest of Asia-Pacific | ||
| Middle East & Africa | GCC | |
| South Africa | ||
| Rest of Middle East & Africa | ||
| South America | Brazil | |
| Argentina | ||
| Rest of South America | ||


Key Questions Answered in the Report
How fast will specialty fibers grow in the medical fiber optics market?
Specialty fibers are projected to expand at a 7.06% CAGR from 2026-2031 as laser surgery shifts toward thulium and hollow-core delivery systems.
What is driving Asia-Pacific demand for medical fiber optics?
Large-scale infrastructure programs in China and India plus new reimbursement for thulium fiber laser lithotripsy in South Korea underpin a 9.35% regional CAGR.
Are chip-on-tip scopes replacing fiber-optic imaging devices?
In low-acuity bronchoscopy and cystoscopy, single-use CMOS devices have already taken 18-22% share, but fiber bundles remain dominant in high-definition GI and therapeutic platforms.
Why are fiber Bragg grating sensors gaining traction?
FBG sensors deliver millisecond temperature or strain feedback, cutting collateral injury by up to 40% in ablation and complying with emerging integrity-monitoring guidelines.
How significant are regulatory costs for new fiber-optic devices?
FDA 510(k) clearance, ISO sterilization validation, and MDR audits together can surpass USD 600,000 and add up to 18 months before commercial launch.
Page last updated on:


