Online Tutoring Market Size and Share
Market Overview
| Study Period | 2020 - 2031 |
|---|---|
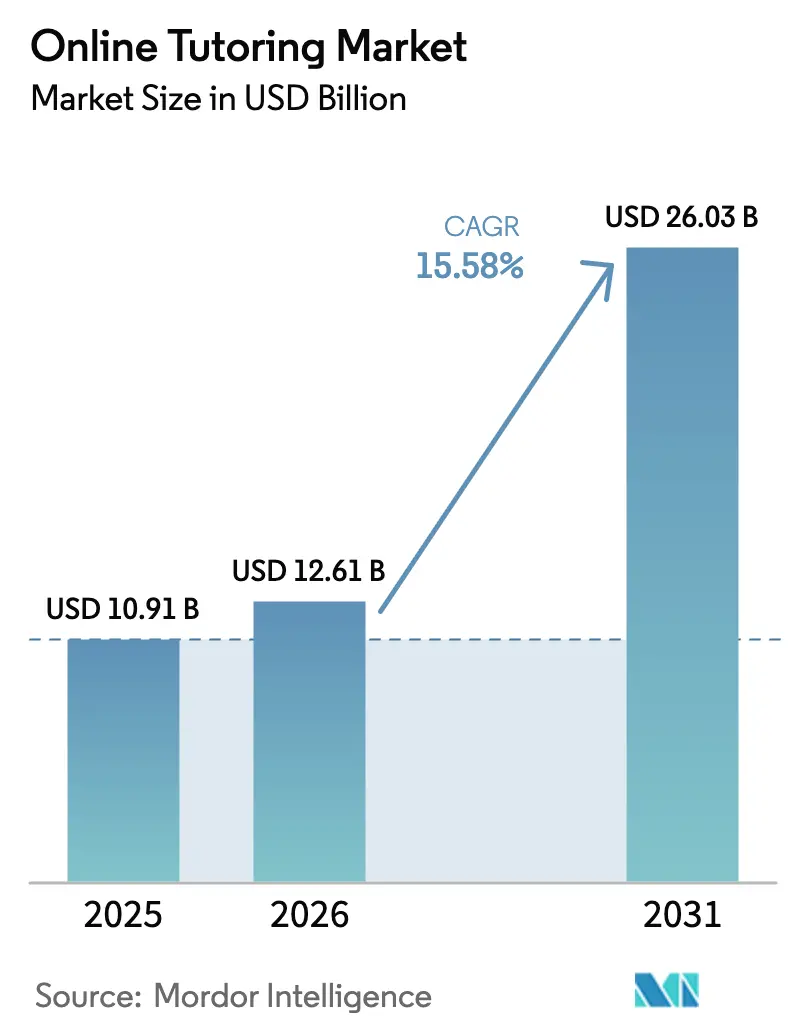
| Market Size (2026) | USD 12.61 Billion |
| Market Size (2031) | USD 26.03 Billion |
| Growth Rate (2026 - 2031) | 15.58% CAGR |
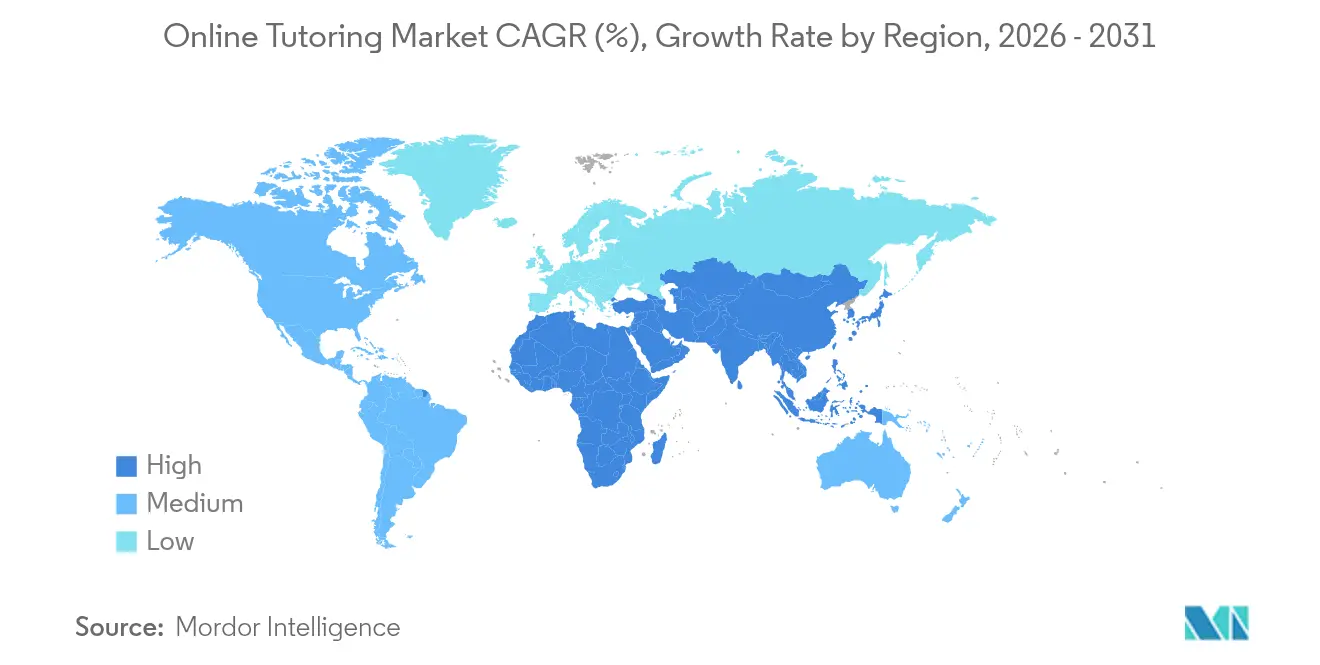
| Fastest Growing Market | Asia Pacific |
| Largest Market | North America |
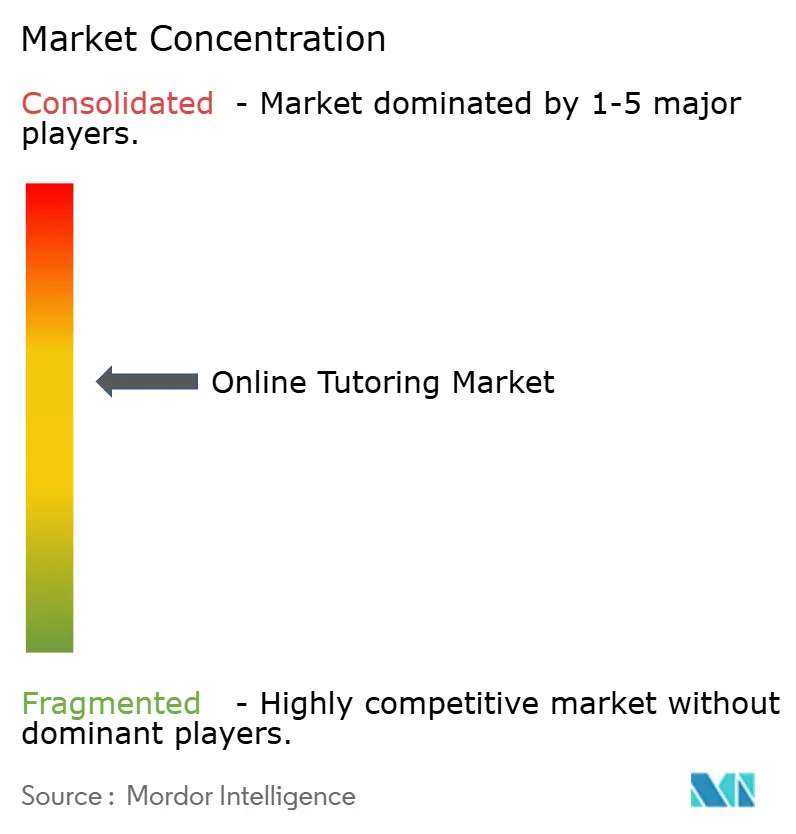
| Market Concentration | Medium |
Major Players *Disclaimer: Major Players sorted in no particular order Image © Mordor Intelligence. Reuse requires attribution under CC BY 4.0. | |
Online Tutoring Market Analysis by Mordor Intelligence
online tutoring market size in 2026 is estimated at USD 12.61 billion, growing from 2025 value of USD 10.91 billion with 2031 projections showing USD 26.03 billion, growing at 15.58% CAGR over 2026-2031. Continued migration from emergency remote instruction to purpose-built digital learning ecosystems keeps demand elevated, while artificial-intelligence copilots and automated content-generation tools improve tutor productivity and platform margins. Federal Work-Study (FWS) funding now subsidises college students who serve as K-12 tutors, easing labour shortages and lowering service prices. Government digital-education mandates across several regions guarantee institutional demand, and corporate upskilling budgets channel adult learners to premium certification tutoring. Venture funding softness curtails start-up expansion, yet incumbent platforms leverage strong cash flow and data-privacy compliance to consolidate share.
Key Report Takeaways
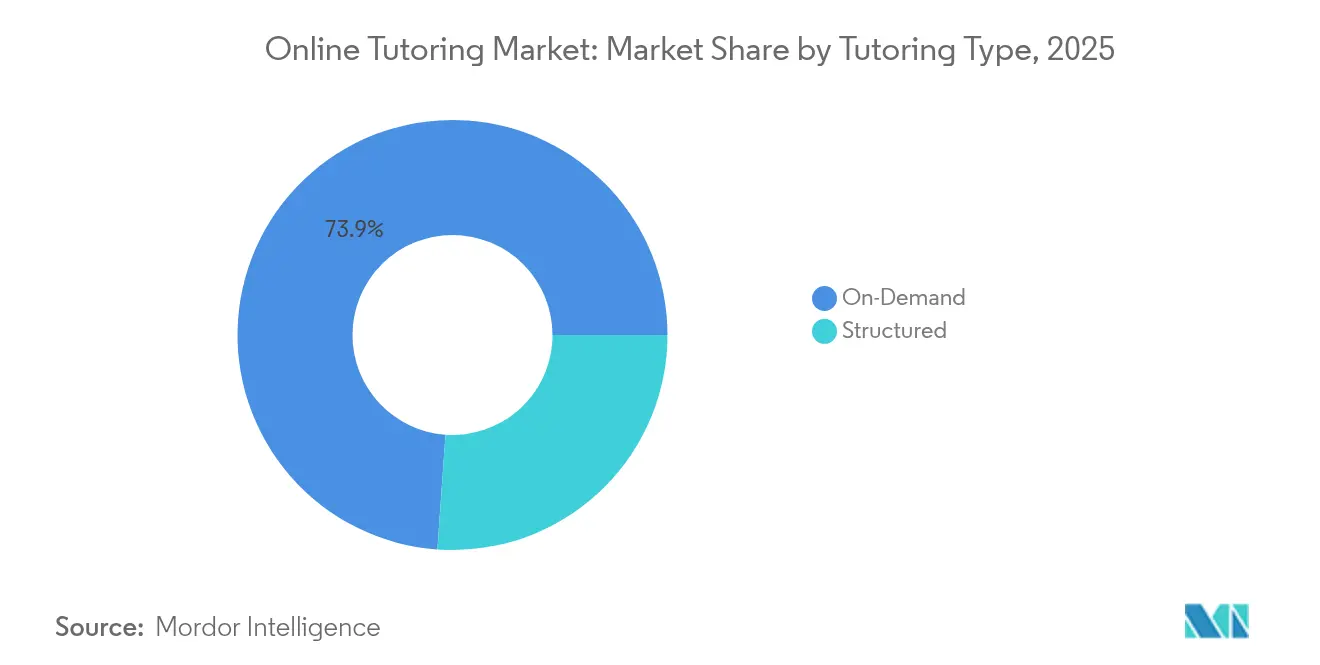
- By tutoring type, on-demand tutoring led with 73.88% revenue share in 2025, while structured tutoring is projected to grow at 17.55% CAGR through 2031.
- By course duration, short-term programs captured 57.72% of the online tutoring market size in 2025 and are forecast to expand at 16.84% CAGR through 2031.
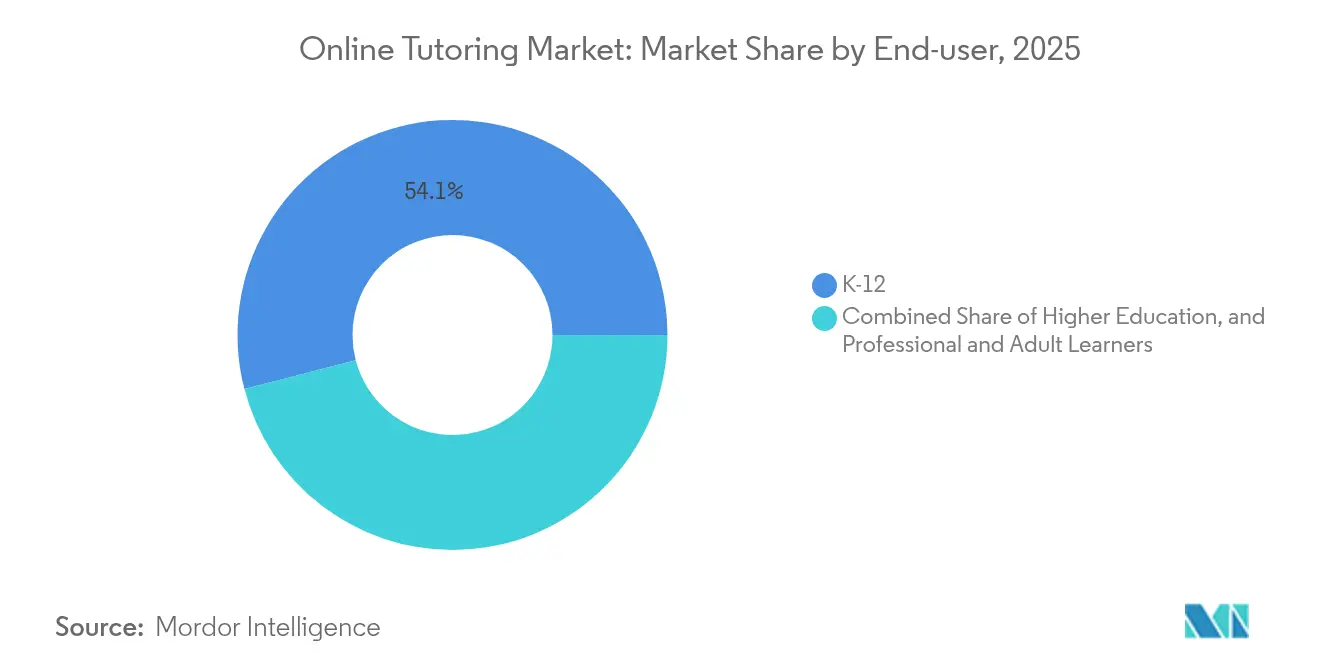
- By end-user, the K-12 segment held 54.05% of the online tutoring market share in 2025; professional and adult learning shows the fastest growth at 15.76% CAGR to 2031.
- By course subject, STEM accounted for 62.14% share of the online tutoring market size in 2025, while professional certification tutoring is set to advance at 18.12% CAGR through 2031.
- By geography, North America captured 35.12% of the online tutoring market size in 2025; Asia-Pacific shows the fastest growth at 17.74% CAGR to 2031.
Note: Market size and forecast figures in this report are generated using Mordor Intelligence’s proprietary estimation framework, updated with the latest available data and insights as of 2026.
Global Online Tutoring Market Trends and Insights
Driver Impact Analyis*
| Driver | (~) % Impact on CAGR Forecast | Geographic Relevance | Impact Timeline |
|---|---|---|---|
| Growing demand for e-learning | +4.2% | Global | Medium term (2-4 years) |
| Rising academic competition | +3.8% | Asia-Pacific core, spill-over to North America | Long term (≥ 4 years) |
| Government digital-education mandates | +2.9% | Asia-Pacific, EU regulatory zones | Medium term (2-4 years) |
| Federal Work-Study funding unlocks P-12 tutoring in US | +1.7% | United States | Short term (≤ 2 years) |
| AI copilots cut tutor prep-time, boosting unit economics | +2.1% | Global, early adoption in North America | Short term (≤ 2 years) |
| Corporate upskilling imperatives | +2.5% | Global enterprise hubs | Medium term (2-4 years) |
| Source: Mordor Intelligence | |||
Growing Demand for E-Learning
Professionals now treat learning as a continuous activity, turning to short, targeted tutoring sessions to close skills gaps that internal training leaves unaddressed. Digital sessions deliver retention rates of 25-60%, well above classroom averages, strengthening institutional willingness to reimburse employees for online support [1]MIT RAISE, “Generative AI and Student Data Privacy,” mit.edu. As large employers publicise learning outcomes, individual learners view online tutoring as a proven path to advancement, creating a self-reinforcing demand loop.
Rising Academic Competition
Shadow education has become embedded in Asia-Pacific, where high-stakes exams channel students toward supplemental study and lift demand across mathematics, science, and language subjects. Competition is spreading to North America as selective university admissions tighten, encouraging families to invest in tutoring that demonstrates measurable progress
Government Digital-Education Mandates
National and regional authorities now fund hardware, connectivity, and digital-content procurement. China and India direct subsidies toward cloud-based tutoring platforms, while the U.S. National Educational Technology Plan asks districts to blend classroom instruction with vetted online supports [2]U.S. Department of Education, “National Educational Technology Plan 2025,” ed.gov. In Europe, OECD-backed policy alignment encourages cross-border adoption of compliant platforms. These mandates create long-term institutional contracts that smooth revenue cycles.
Federal Work-Study Funding Unlocks P-12 Tutoring in US
Updated FWS rules allow universities to pay eligible students for virtual tutoring of local K-12 learners. Pilots at several public institutions demonstrate sustainable wage structures that lower family costs and expand tutor supply. Because reimbursements flow from existing federal allocations, school districts can scale programmes without new budget approvals.
Restraint Impact Analysis*
| Restraint | (~) % Impact on CAGR Forecast | Geographic Relevance | Impact Timeline |
|---|---|---|---|
| Data-privacy and cyber-security concerns | -2.4% | Global, heightened in EU and US | Medium term (2-4 years) |
| Free learning resources cannibalising paid sessions | -1.8% | Global | Long term (≥ 4 years) |
| Ed-tech VC pull-back slows platform roll-outs | -1.9% | Global, concentrated in venture-dependent markets | Short term (≤ 2 years) |
| Tutor burnout in peak-season causing quality leakage | -1.3% | Global | Medium term (2-4 years) |
| Source: Mordor Intelligence | |||
Data-Privacy and Cyber-Security Concerns
More than 1,600 educational data breaches have been logged since 2016, prompting universities and school districts to apply stricter vendor-vetting rubrics. New security audits raise compliance costs and lengthen sales cycles, advantages that favour capitalised incumbents and slow the pace of start-up innovation
Free Learning Resources Cannibalising Paid Sessions
Khan Academy offers comprehensive mathematics and SAT practice at no charge, and its AI assistant Khanmigo now personalises guidance that once required a human tutor. While premium services continue to secure enrolments in certification and specialised subjects, free content tempers average revenue per user in commodity segments.
*Our forecasts treat driver/restraint impacts as directional, not additive. The impact forecasts reflect baseline growth, mix effects, and variable interactions.
Segment Analysis
By Tutoring Type: Immediate Access Fuels On-Demand Leadership
On-demand sessions captured 73.88% revenue in 2025, reflecting learner preference for rapid problem resolution and flexible scheduling. That dominance delivers scale efficiencies that underpin the online tutoring market. The segment’s breadth covers homework help, test prep check-ins, and last-minute concept reviews, which typically command lower per-hour prices yet generate high volume.
Structured tutoring, growing at 17.55% CAGR, appeals to institutions that require curriculum alignment and outcome tracking. This cohort often purchases annual licences, creating predictable recurring revenue that stabilises the online tutoring market. Platforms are increasingly merging real-time availability with sequenced lesson plans, signalling a hybrid future.


By Course Duration: Short Modules Outpace Semester-Length Programs
Short-term modules secured 57.72% of the online tutoring market size in 2025 and will advance at 16.84% CAGR to 2031. Bite-sized lessons align with adult attention spans and just-in-time business needs, enabling platforms to upsell multi-module bundles. Retention metrics show stronger recall when concepts are delivered in 20-minute segments, helping providers justify premium pricing.
Long-duration courses maintain relevance in credit-bearing university partnerships and language proficiency tracks. These engagements extend customer lifetime value and deepen the online tutoring market through multi-semester contracts. Providers increasingly break long syllabi into discrete micro-lessons to blend the two models.
By End-User: K-12 Base Supports Expansion into Professional Training
K-12 learners represented 54.05% market demand in 2025, underpinning tutor utilisation rates during afternoon peaks. District-level contracts and FWS subsidies entrench this segment. Yet adult and professional learners post a 15.76% CAGR, reflecting reskilling mandates tied to digital transformation across industries.
Higher education occupies a transitional role, mixing remedial support for undergraduates with career-oriented certificates for alumni. Corporate managers often reimburse coaching for cloud-computing, data-analytics, and cybersecurity skills, expanding the online tutoring market size through high-value courses that exceed USD 80 per hour.
By Course Subject: STEM Core Meets Certification Upsurge
STEM subjects held 62.14% revenue share in 2025, cementing their place at the heart of the online tutoring market. Standardised curricula let platforms scale content libraries efficiently, and outcomes are easily benchmarked through grade improvement and exam pass rates.
Professional certification tutoring, forecast at 18.12% CAGR, now draws software engineers, cloud architects, and project managers who need credentials for promotion. This category commands premium pricing and low churn, boosting overall profitability across the online tutoring industry.
Geography Analysis
North America retained 35.12% revenue share in 2025, buoyed by widespread broadband access, district-level procurement, and the FWS model that offsets tutoring costs for families. USDA distance-learning grants steer USD 60 million each year toward rural connectivity, ensuring small communities access online tutoring platforms . Data-privacy compliance obligations such as FERPA and state statutes increase operational costs but also serve as entry barriers that protect established firms.
Asia-Pacific records the fastest growth at 17.74% CAGR through 2031. National programmes in China and India that require digital-content adoption funnel public funds toward domestic and international providers. Shadow-education culture reinforces household spending on supplementary study, and rising middle-class income widens the customer base . Rapid mobile-internet expansion accelerates rural uptake, while corporate demand for certification tutoring scales in parallel with regional technology hiring.
Europe forms a mature yet steady market where multinational regulation harmonises quality standards. GDPR enforcement prioritises data sovereignty, prompting platforms to invest in EU-hosted infrastructure. OECD digital-education frameworks encourage cross-border recognition of learning outcomes, facilitating language tutoring and professional certificate portability. Emerging pockets in the Middle East and Africa benefit from government smart-city investments that bundle online education with telecom deployments, laying groundwork for future online tutoring market expansion.

Competitive Landscape
The online tutoring market is moderately consolidated. Well-capitalised incumbents deploy predictive analytics to refine tutor-student matching and invest in proprietary large-language models that generate adaptive content. Partnerships with textbook publishers embed tutoring links directly into e-books, lowering acquisition costs.
Regulatory compliance differentiates competitors: platforms boasting ISO 27001 certification and GDPR alignment close institutional deals faster, especially in Europe and North America. AI copilots reduce tutor preparation time from hours to minutes, lifting gross margins and enabling lower price points without eroding profitability.
White-space opportunities persist in professional certification and government-funded K-12 programmes. Vendors that integrate with federal student-aid APIs or local payroll systems streamline billing and gain procurement preference. Geographic diversification mitigates regional funding cycles, and cross-licensing of content libraries accelerates entry into new subject verticals, reinforcing the scale-economics advantage.
Online Tutoring Industry Leaders
TAL Education Group
Chegg Inc.
BYJU’S (Think & Learn Pvt Ltd.)
Varsity Tutors LLC (Nerdy Inc.)
Pearson plc
- *Disclaimer: Major Players sorted in no particular order

Recent Industry Developments
- June 2025: BYJU'S completed the sale of its U.S. subsidiaries Epic and Tynker for USD 95 million and USD 2.2 million respectively, recouping a fraction of the original purchase prices as part of bankruptcy proceedings.
- April 2025: Kollegio raised USD 2.8 million in seed funding to expand AI-driven college-planning partnerships with higher-education institutions.
- April 2025: Panorama Education acquired Class Companion, adding generative-AI tutoring capabilities to its Panorama Solara platform
- March 2025: Edge Tutor secured USD 1 million in pre-Series A funding to strengthen its white-label services across the Americas and EMEA.


Research Methodology Framework and Report Scope
Market Definitions and Key Coverage
Our study defines the online tutoring market as paid, live or asynchronous academic or skill-based instruction delivered through internet-enabled platforms to K-12 learners, higher-education students, and adult up-skilling seekers worldwide. The valuation covers platform subscription fees, session packages, and institution-outsourced tutoring contracts, expressed in constant 2024 US dollars.
Scope exclusion: classroom-based private coaching and pure self-paced MOOCs without tutor interaction are outside the remit.
Segmentation Overview
- By Tutoring Type
- Structured
- On-Demand
- By Course Duration
- Short-Term Courses
- Long-Term / Semester-Length Courses
- By End-User
- K-12
- Higher Education
- Professional and Adult Learners
- By Course Subject
- STEM
- Language Learning
- Test Preparation
- Arts and Hobbies
- Professional Certification
- By Geography
- North America
- United States
- Canada
- Mexico
- South America
- Brazil
- Argentina
- Rest of South America
- Europe
- Germany
- United Kingdom
- France
- Italy
- Spain
- Russia
- Rest of Europe
- Asia-Pacific
- China
- Japan
- India
- South Korea
- Australia and New Zealand
- Rest of Asia-Pacific
- Middle East and Africa
- Middle East
- Saudi Arabia
- UAE
- Turkey
- Rest of Middle East
- Africa
- South Africa
- Nigeria
- Kenya
- Rest of Africa
- Middle East
- North America
Detailed Research Methodology and Data Validation
Primary Research
Our analysts interviewed district technology coordinators, large tutoring platform product leads, private equity investors, and frontline tutors across North America, Europe, Asia-Pacific, and the Middle East. The discussions validated pricing corridors, active-user conversion ratios, and typical weekly session counts, which we then reconciled with the desk findings.
Desk Research
We first mapped the demand pool by extracting enrollment and digital adoption indicators from tier-one public sources such as the UNESCO Institute for Statistics, OECD Education at a Glance, the US National Center for Education Statistics, India's AISHE portal, and Eurostat. Policy notes from bodies like UNICEF and Broadband Commission clarified government digital-learning drives. Financial filings and investor decks, screened on D&B Hoovers and Dow Jones Factiva, offered revenue clues for listed edtech providers, while press releases and patent logs signaled emerging AI tutoring tools. These publicly available inputs formed the foundational dataset; many other credible documents were also consulted for cross-checks and gap filling.
Market-Sizing & Forecasting
A top-down and bottom-up hybrid model underpins the numbers. We began with student enrollments and broadband household counts, applied region-specific online tutoring penetration rates, and multiplied by verified average spend per learner. Supplier roll-ups and sampled ASP-times-volume checks refined totals. Key variables such as smartphone penetration among 13-to-18-year-olds, parental discretionary spend trends, venture funding inflows to edtech, and standardized-test participation rates feed a multivariate regression that projects growth through 2030. Where platform disclosures were partial, weighted imputation bridged gaps before final triangulation.
Data Validation & Update Cycle
Outputs run through variance dashboards that flag outliers against historical ratios and peer benchmarks. Senior reviewers sign off only after anomalies are resolved. Reports refresh annually, and any material event, such as a large funding round, major regulatory shift, or macro shock, triggers an interim update.
Why Our Online Tutoring Baseline Stands Up to Scrutiny
Published estimates often differ because firms slice the market in unique ways, pick varying price points, or refresh data on unequal cadences.
Key gap drivers include whether offline franchise revenue sneaks into totals, how aggressively free trial traffic is monetized, and the currency conversion windows applied. According to Mordor Intelligence, keeping the lens strictly on paid digital tutoring sessions and using rolling four-quarter averages for price and volume yields a balanced view.
Benchmark comparison
| Market Size | Anonymized source | Primary gap driver |
|---|---|---|
| USD 10.91 B (2025) | Mordor Intelligence | - |
| USD 12.06 B (2025) | Global Consultancy A | Blends center-based classes with digital services |
| USD 12.80 B (2025) | Trade Journal B | Relies on vendor-reported bookings with limited audit |
| USD 30.24 B (2025) | Market Tracker C | Counts corporate training SaaS and uses year-end FX only |
The comparison shows that once scope inflation and unverified revenue inputs are stripped away, Mordor's disciplined variable set and yearly refresh cycle provide decision-makers with a dependable, transparent baseline they can replicate with publicly traceable data points.


Key Questions Answered in the Report
How big is the Online Tutoring Market?
The Online Tutoring Market size is expected to reach USD 12.61 billion in 2026 and grow at a CAGR of 15.58% to reach USD 26.03 billion by 2031.
What is the current value of the online tutoring market?
The online tutoring market is valued at USD 12.61 billion in 2026 and is projected to reach USD 26.03 billion by 2031.
Which delivery model holds the largest share?
On-demand tutoring leads with 73.88% revenue share in 2025.
Which segment is growing the fastest?
Professional certification tutoring shows the highest growth at 18.12% CAGR through 2031.
Why is Asia-Pacific the primary growth engine?
Government digital-education mandates and a culture of academic competition push Asia-Pacific to an 17.74% CAGR, outpacing all other regions.
How do AI copilots benefit tutoring platforms?
AI copilots cut tutor preparation time from hours to minutes, boosting platform unit economics and allowing lower price points without sacrificing quality.
Page last updated on:


