
Technology, Media and Telecom
5th MayPricing Strategy for Semiconductor Components
3 Min Read
The Web Conferencing Market Report Segments the Industry Into by Component (Solution, Services), Deployment (Cloud/Hosted, On-Premises, Saas, and, Hybrid), End-Use (Education, Government, Healthcare, and More), Organization Size (Large Enterprises, Small and Medium Enterprises), Subscription Model (One-Time License, Monthly/Annual Subscription, and Freemium/Pay-as-You-Go), and Geography.
Market Overview
| Study Period | 2020 - 2031 |
|---|---|
| Market Size (2026) | USD 7.98 Billion |
| Market Size (2031) | USD 14.01 Billion |
| Growth Rate (2026 - 2031) | 11.92 % CAGR |
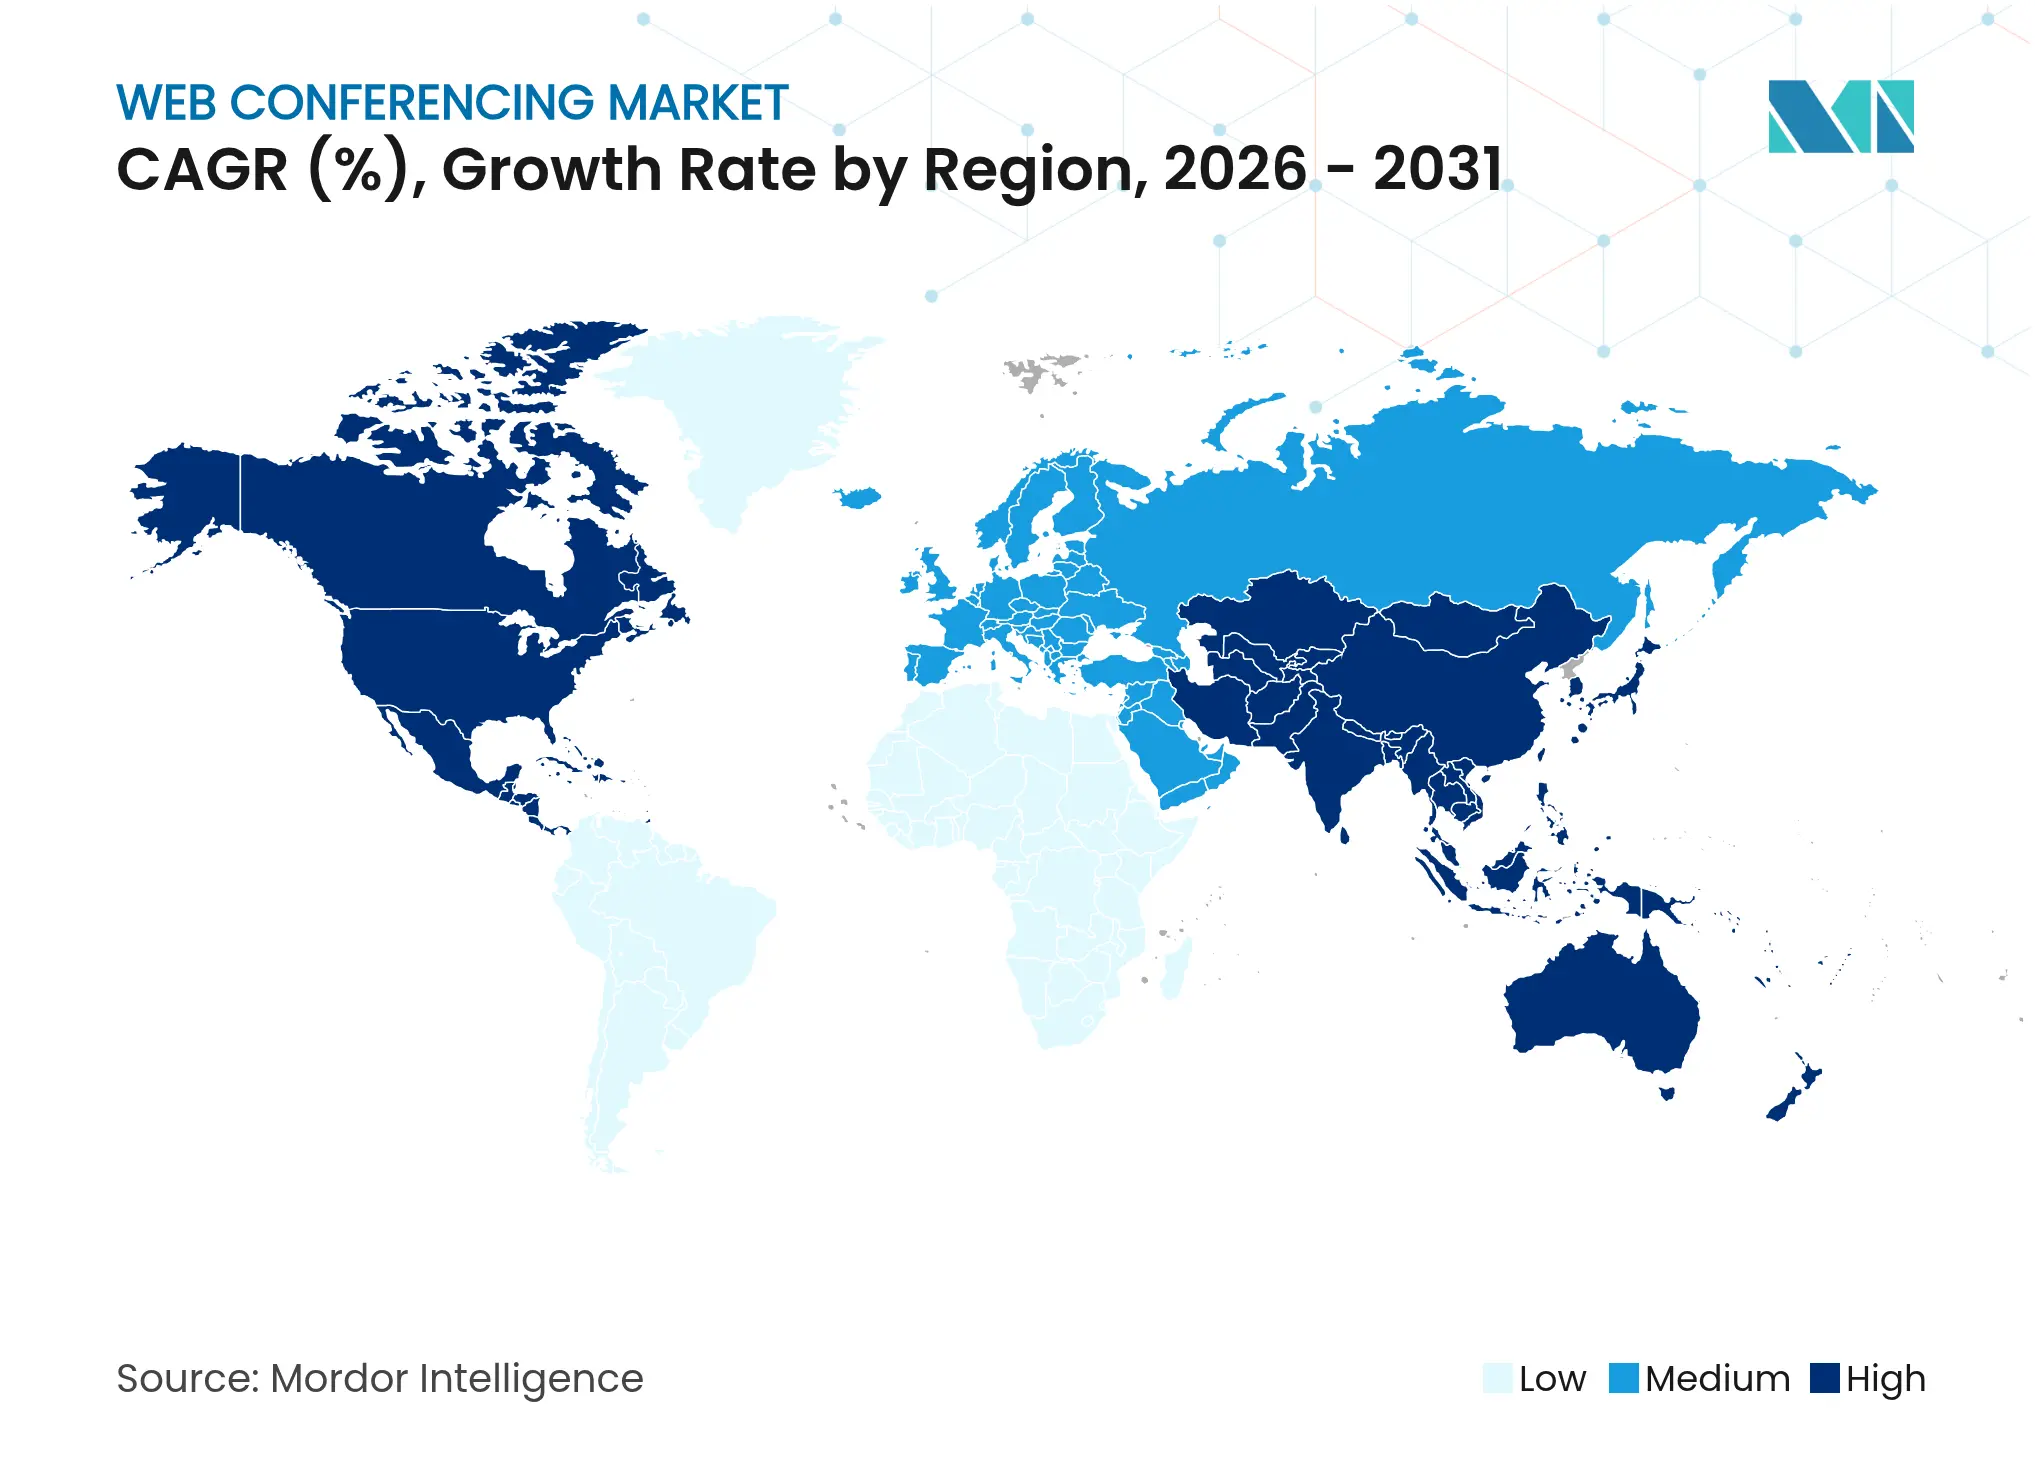
| Fastest Growing Market | Asia Pacific |
| Largest Market | North America |
| Market Concentration | Medium |
Major Players *Disclaimer: Major Players sorted in no particular order. Image © Mordor Intelligence. Reuse requires attribution under CC BY 4.0. |
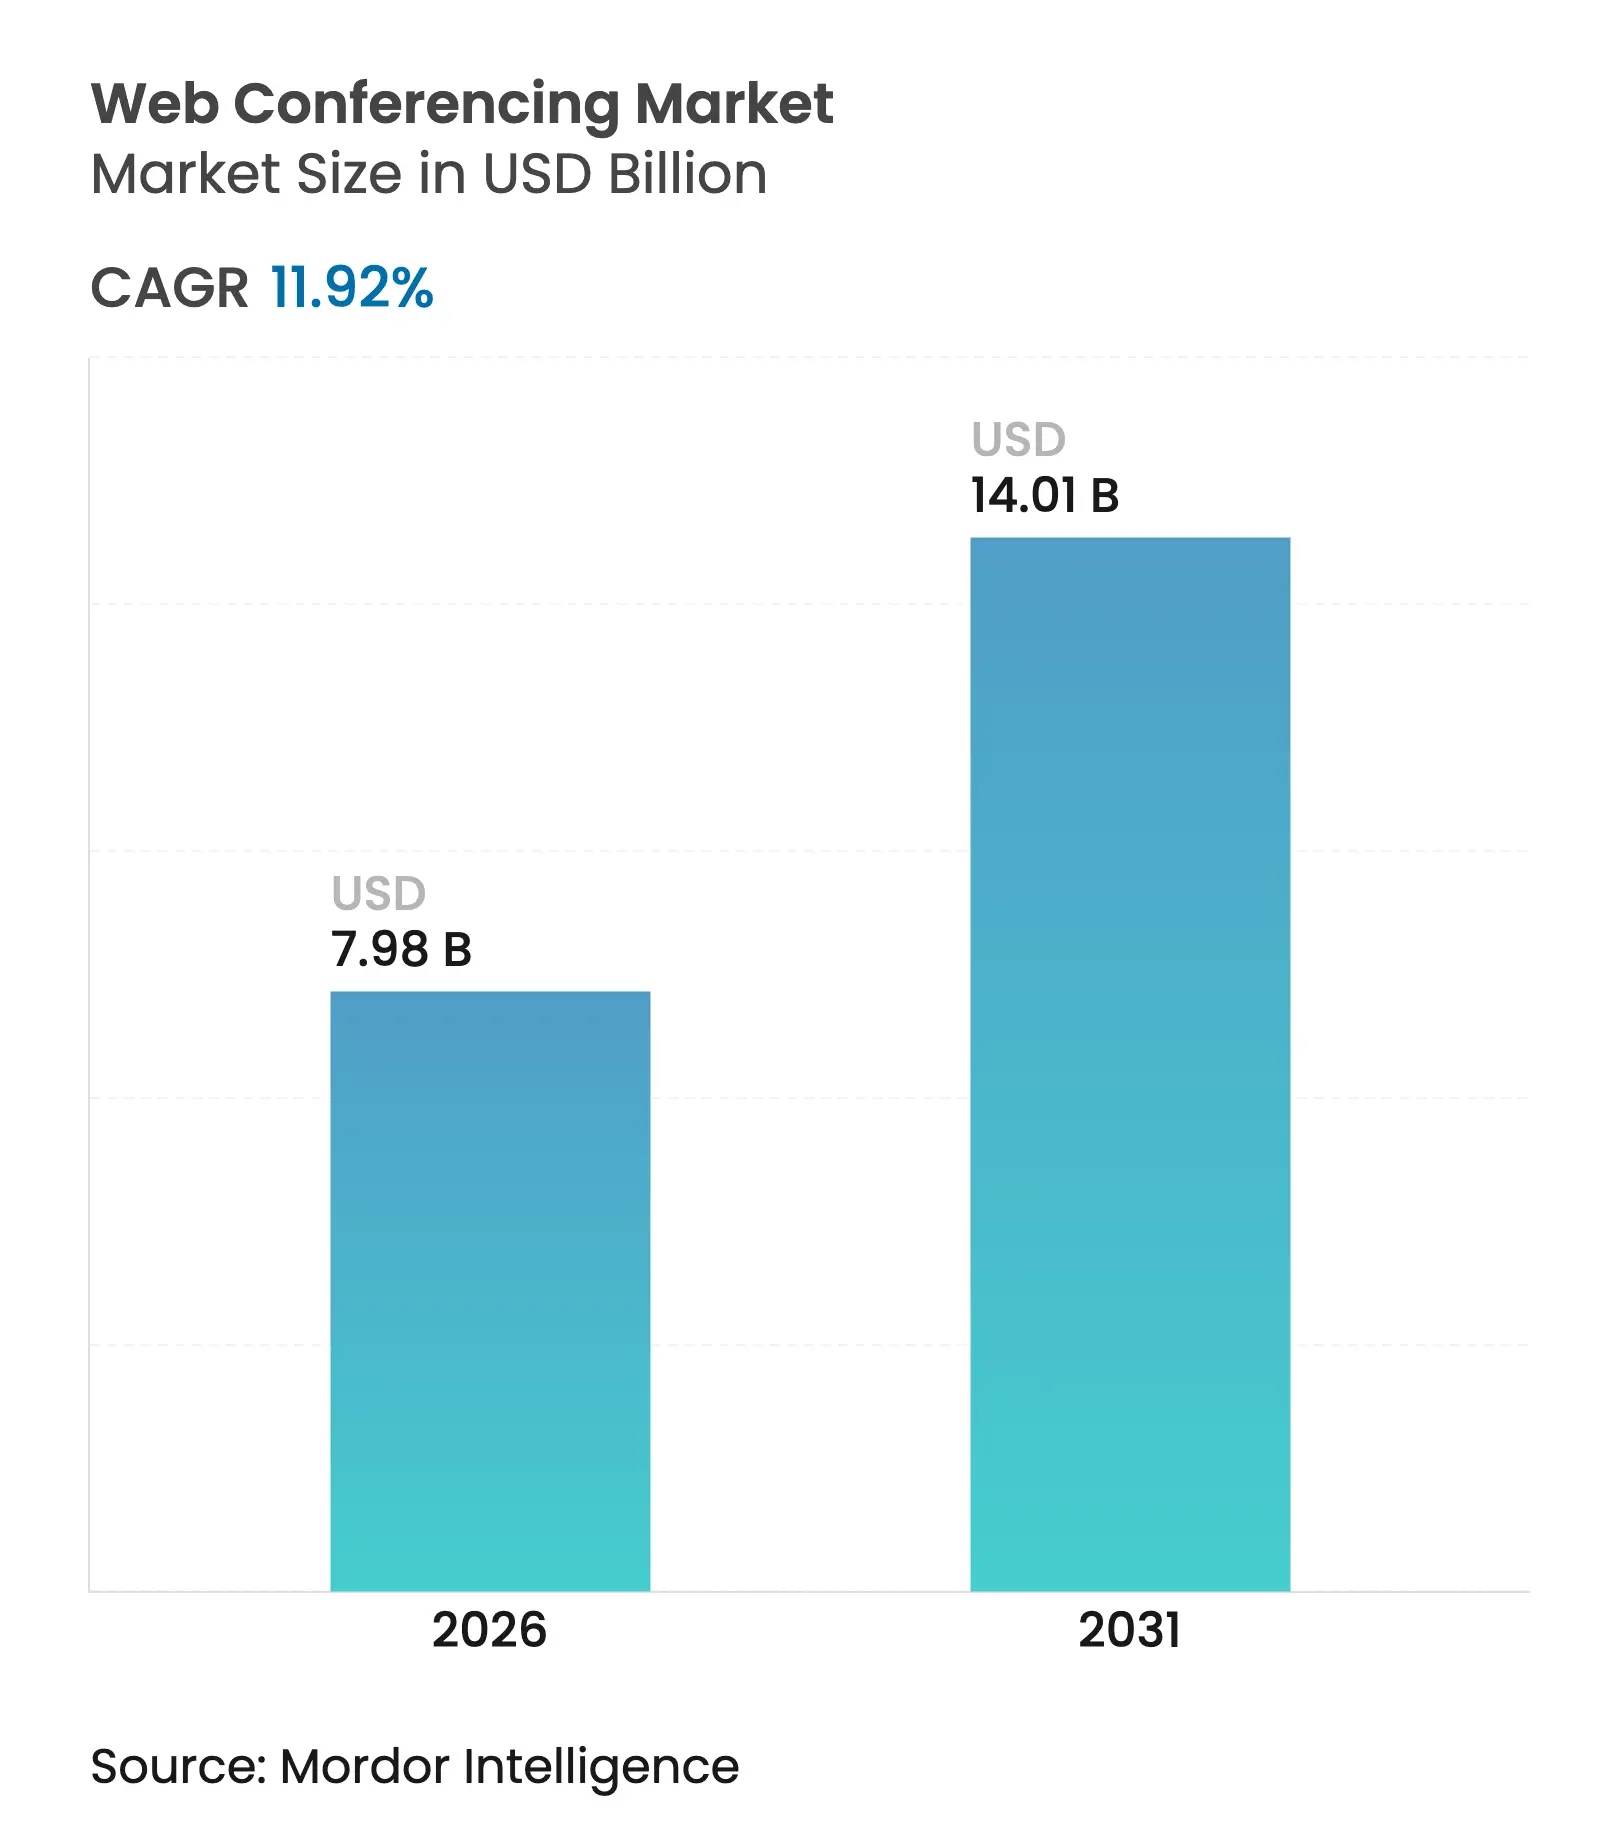
The web conferencing market size is expected to grow from USD 7.13 billion in 2025 to USD 7.98 billion in 2026 and is forecast to reach USD 14.01 billion by 2031 at 11.92% CAGR over 2026-2031. Demand continues to shift from emergency remote-work enablement toward long-term hybrid-work infrastructure, propelled by corporate sustainability goals, AI-driven accessibility, and the bundling of conferencing within broader UCaaS suites. North America retains first-mover advantage, yet Asia-Pacific’s cellular-first collaboration habits and rapid 5G rollouts underpin the highest regional growth outlook. Solutions still account for nearly two-thirds of spending, but the faster-growing Services segment shows that enterprises now prioritize expert integration and managed support. Cloud/Hosted deployments dominate volumes, while SaaS’s pay-as-you-go model attracts organizations managing variable seat counts, indicating a clear preference for consumption-based pricing. Competitive intensity remains moderate—no single vendor controls more than 30% share—creating room for vertical specialists, security innovators, and new regional entrants.
Key Report Takeaways
Note: Market size and forecast figures in this report are generated using Mordor Intelligence's proprietary estimation framework, updated with the latest available data and insights as of 2026.
Drivers Impact Analysis
| Driver | ( ~ ) % Impact on CAGR Forecast | Geographic Relevance | Impact Timeline | |||
|---|---|---|---|---|---|---|
Ubiquity of
hybrid-work operating models
Ubiquity of
hybrid-work operating models
| +2.9% | Global (highest in North America and Europe) | Medium term (2–4 years) |
( ~ ) % Impact
on CAGR Forecast
:
+2.9%
|
Geographic
Relevance
:
Global (highest in
North America and Europe)
|
Impact Timeline
:
Medium term (2–4
years)
|
Expansion of UCaaS
bundles by telecom carriers
Expansion of UCaaS
bundles by telecom carriers
| +1.8% | Global, strong in Asia-Pacific and North America | Long term (≥4 years) | |||
AI-powered live
captioning and translation
AI-powered live
captioning and translation
| +1.2% | Global, early in North America and Europe | Short term (≤2 years) | |||
Corporate
sustainability mandates
Corporate
sustainability mandates
| +0.9% | Global, led by Europe and North America | Medium term (2–4 years) | |||
Cellular-first
collaboration in emerging markets
Cellular-first
collaboration in emerging markets
| +0.7% | Asia-Pacific, Latin America, Middle East and Africa | Long term (≥4 years) | |||
Quantum-resistant
encryption readiness
Quantum-resistant
encryption readiness
| +0.3% | Global, early in defense and financial services | Long term (≥4 years) | |||
| Source: Mordor Intelligence | ||||||
Ubiquity of Hybrid-Work Operating Models
Hybrid work has become structural: 27% of employees now operate under hybrid arrangements, and 86% prefer a hybrid meeting format[1]Owl Labs, “State of Hybrid Work 2024,” owllabs.com. This preference elevates requirements for spatial audio, intelligent cameras, and multimodal content-sharing that seamlessly bridge physical and virtual rooms. The talent angle is equally decisive; 40% of workers report they would leave if flexible work were withdrawn, confirming that hybrid policies are a retention lever rather than a temporary perk. Economic ripple effects reinforce adoption: employees working in-office on hybrid schedules spend USD 61 per day, intensifying focus on balancing attendance with productivity. Platform providers are reacting accordingly—Microsoft’s decision to retire Skype and fold users into Teams underscores the shift from point tools to integrated collaboration suites.
AI-Powered Live Captioning and Translation Boosts Accessibility
Real-time captioning and translation reshape collaboration by removing language barriers. Enterprises note a 96% ROI improvement when automated translation replaces human interpreters. Attendance data highlight the opportunity: multilingual meetings have risen 79%, and 88% of participants are non-native English speakers. Microsoft’s Copilot+ PC Live Captions currently translates 44 languages into English captions on the fly. Vendors further differentiate through security; Zoom’s adoption of NIST-approved Kyber-768 post-quantum encryption demonstrates how accessibility and compliance enhancements can proceed in tandem.
Expansion of UCaaS Bundles by Telecom Carriers
Telecom operators increasingly package conferencing inside UCaaS portfolios, converting a once stand-alone purchase into a multi-service subscription. A 2025 survey found that 56% of organizations plan to boost UCaaS spending during the year. Carriers leverage existing billing relationships, creating new reach for collaboration services and raising competitive hurdles for pure-play vendors. Cisco’s Webex carrier alliances show how incumbents adapt by embracing channel distribution rather than direct enterprise competition.
Corporate Sustainability Mandates to Cut Travel-Related CO₂
Environmental regulations make virtual meetings a lever for measured carbon reductions. Research shows that switching from in-person to virtual conferencing can lower CO₂ emissions by up to 94%. Alongside environmental gains, firms report savings of up to 60% in travel budgets, further reinforcing the business case. MIT studies add a nuanced layer: disabling video feeds can slice an additional 96% from a single meeting’s environmental footprint, encouraging platform features that default to audio-first modes when appropriate.
Restraint Impact Analysis
| Restraint | ( ~ ) % Impact on CAGR Forecast | Geographic Relevance | Impact Timeline | |||
|---|---|---|---|---|---|---|
Persistent meeting
fatigue lowers usage intensity
Persistent meeting
fatigue lowers usage intensity
| -1.4% | Global, acute in North America and Europe | Short term (≤2 years) |
( ~ ) % Impact
on CAGR Forecast
:
-1.4%
|
Geographic
Relevance
:
Global, acute in
North America and Europe
|
Impact Timeline
:
Short term (≤2
years)
|
Fragmented regional
data-sovereignty rules
Fragmented regional
data-sovereignty rules
| -0.8% | Global, highest complexity in Europe and Asia-Pacific | Medium term (2–4 years) | |||
Rising enterprise
SASE budgets divert spend
Rising enterprise
SASE budgets divert spend
| -0.6% | Global, large enterprises | Medium term (2–4 years) | |||
Saturation in
large-enterprise seat penetration
Saturation in
large-enterprise seat penetration
| -0.4% | North America and Europe | Long term (≥4 years) | |||
| Source: Mordor Intelligence | ||||||
Persistent Meeting Fatigue Lowers Usage Intensity
Academic work links prolonged screen exposure with emotional exhaustion; 49% of U.S. employees report “Zoom fatigue,” and self-view features magnify the drain. Companies respond by instituting no-meeting periods and promoting asynchronous channels, trends that temper per-user conferencing minutes and could restrain revenue for usage-based pricing plans.
Fragmented Regional Data-Sovereignty Rules
A patchwork of GDPR, HIPAA and emerging AI regulations forces vendors to keep data inside specific jurisdictions, increasing cost and limiting global feature uniformity. European requirements for local processing push platform providers toward regional hosting partnerships, while U.S. initiatives such as CISA’s hardening guidance tighten end-to-end encryption expectations cisa. Pexip’s differentiated EU-hosted offering illustrates how compliance specialization can become a competitive wedge.
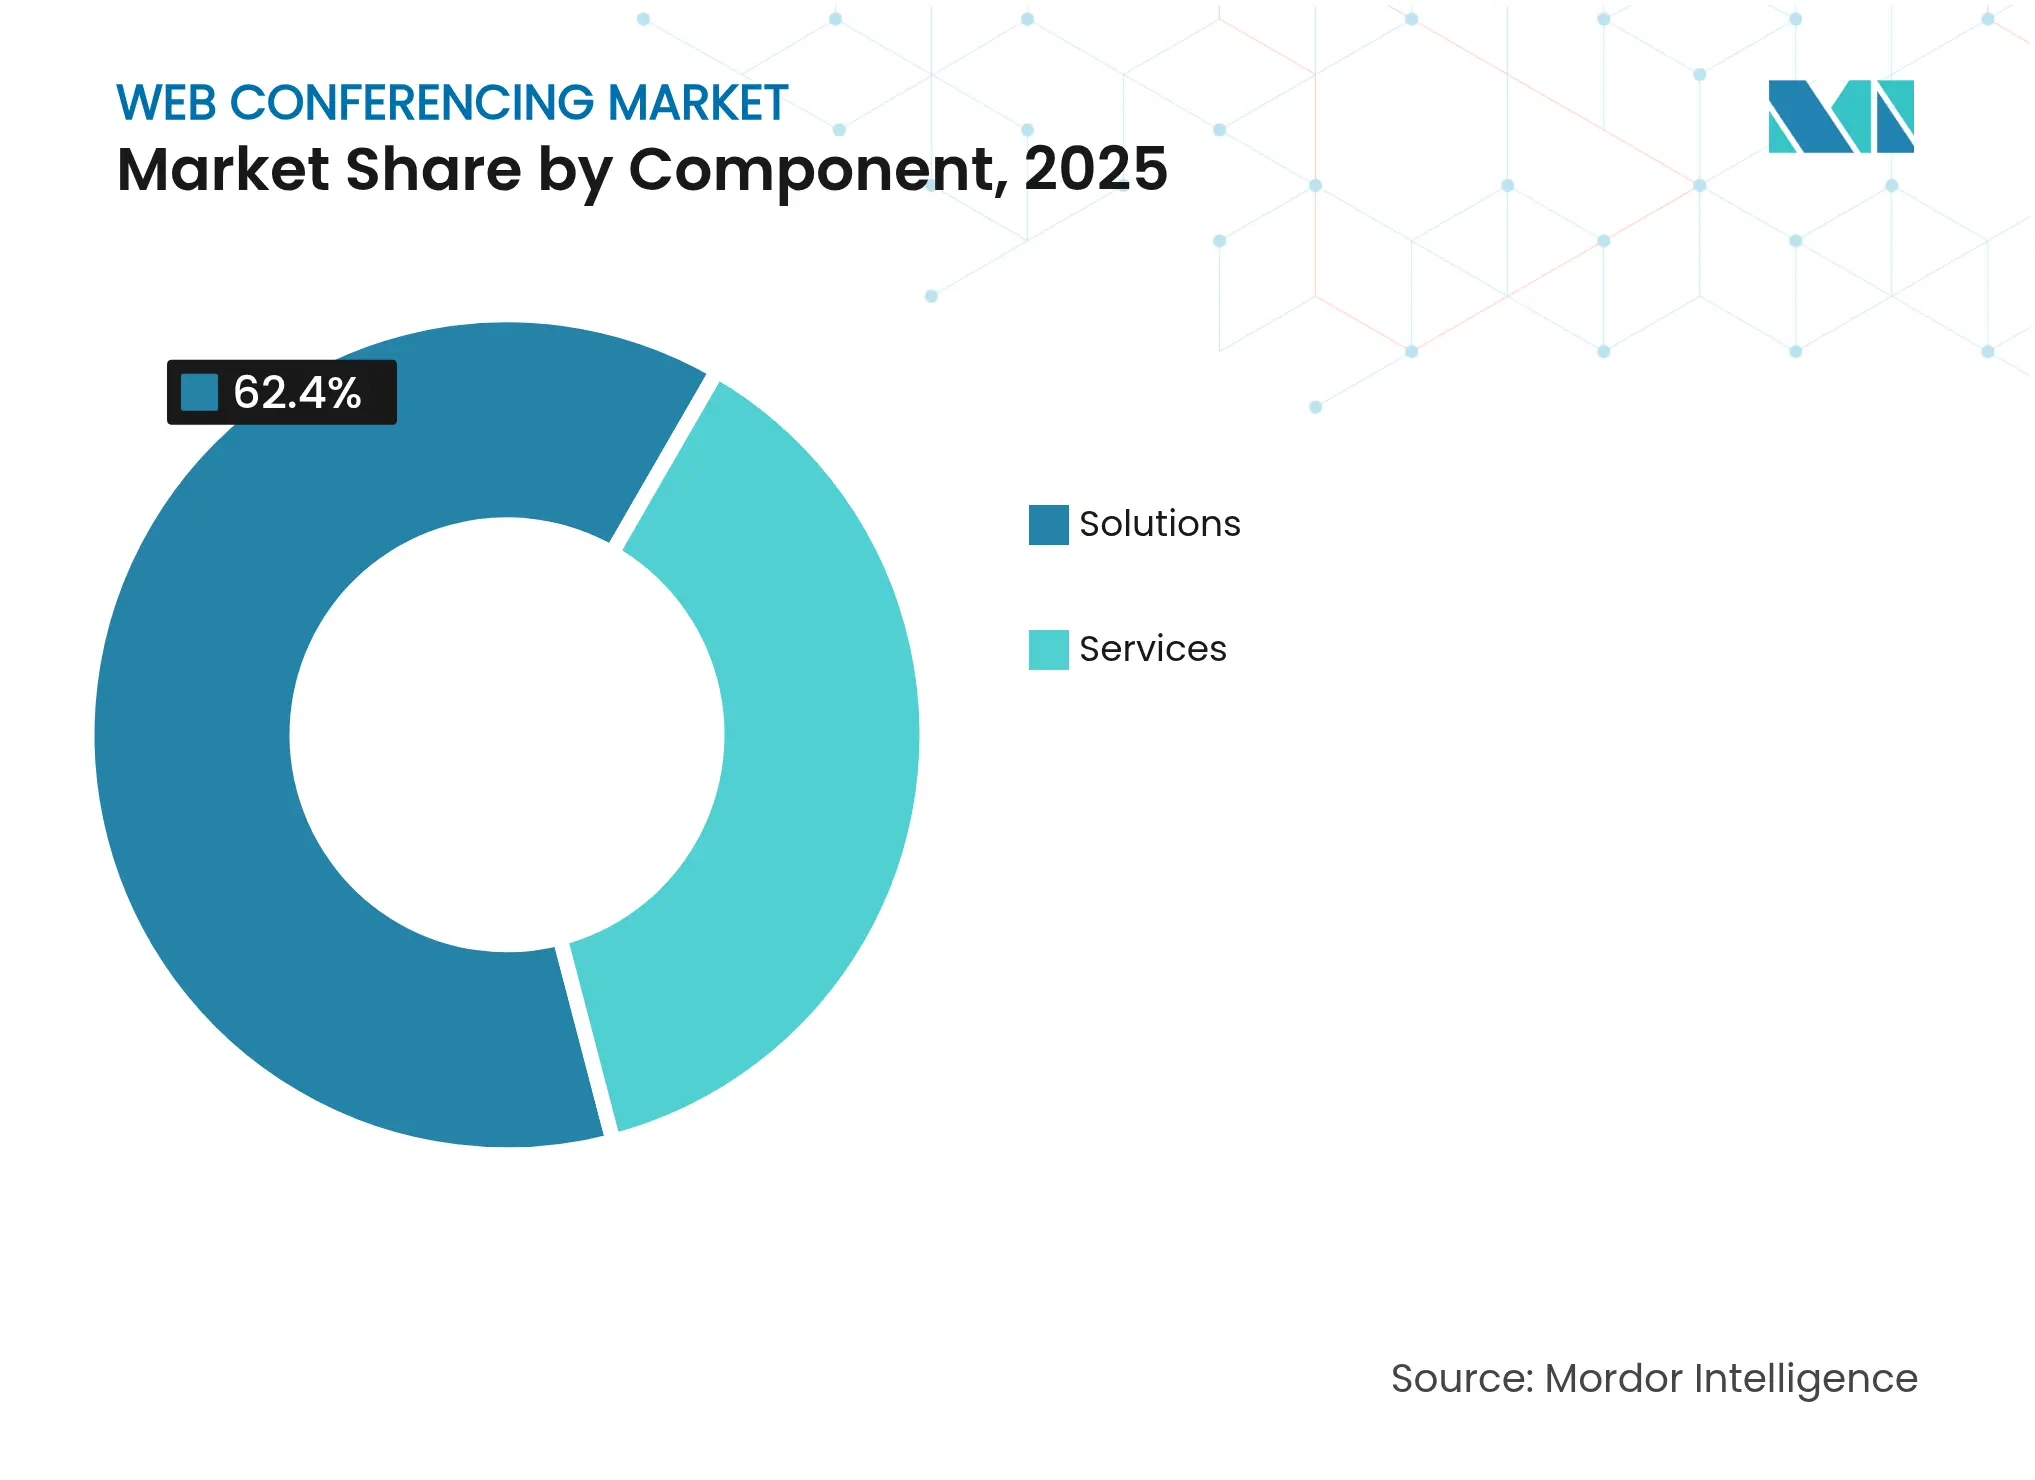
By Component: Services Growth Outpaces Solutions Dominance
Services generated faster growth even as Solutions preserved a 62.40% revenue lead in 2025. Enterprises pursuing hybrid-work optimization increasingly rely on professional and managed services to integrate video APIs, automate meeting workflows and enforce security policies. The web conferencing market size for service engagements is forecast to climb at 12.51% CAGR, reflecting this shift toward outcome-oriented spending. Conversely, core software revenues mature, prompting vendors to embed AI transcription and translation to stave off commoditization.
The pivot toward service-led value is evident in Zoom’s May 2025 partner-program overhaul, which aims for half of corporate bookings through the channel by FY26. As client projects grow in complexity, specialist integrators gain leverage in the web conferencing market, while platform providers face margin pressures from larger partner ecosystems.
Note: Segment shares of all individual segments available upon report purchase
By Deployment: SaaS Models Drive Cloud Evolution
Although Cloud/Hosted deployments represented 71.60% of 2025 spending, SaaS’ 14.02% CAGR signals the preferred path forward for cost-aligned scaling. The web conferencing market benefits from enterprises treating collaboration as an operating expense that flexes with seat counts, rather than a capitalized license. Consumption billing resonates with industries managing seasonal labor or project-based teams.
Vodafone’s first satellite video call using an unmodified smartphone highlights how connectivity advances erase the last geographical shadows for SaaS platforms. Hybrid deployment remains relevant for sectors needing on-premise data control, yet the trajectory clearly favors cloud economics.
By Organization Size: SME Adoption Challenges Enterprise Dominance
Large enterprises still contribute 60.70% of 2025 revenues, but SMEs represent the fastest-rising cohort. A 13.68% CAGR underscores democratization as simplified onboarding pairs with freemium entry tiers. The web conferencing market size unlocked by SMEs continues to expand as they migrate from consumer apps to enterprise-grade video platforms that now offer small-business bundles.
These reshaping pressures major providers to balance high-touch enterprise features with self-service simplicity. Investor enthusiasm around integrated productivity browsers such as Arc reflects the trend toward unified, lightweight toolsets that resonate with smaller firms’ lean IT resources.

Recognized by Experts. Trusted by Leaders.
A trusted intelligence partner to global decision-makers across 90+ countries.


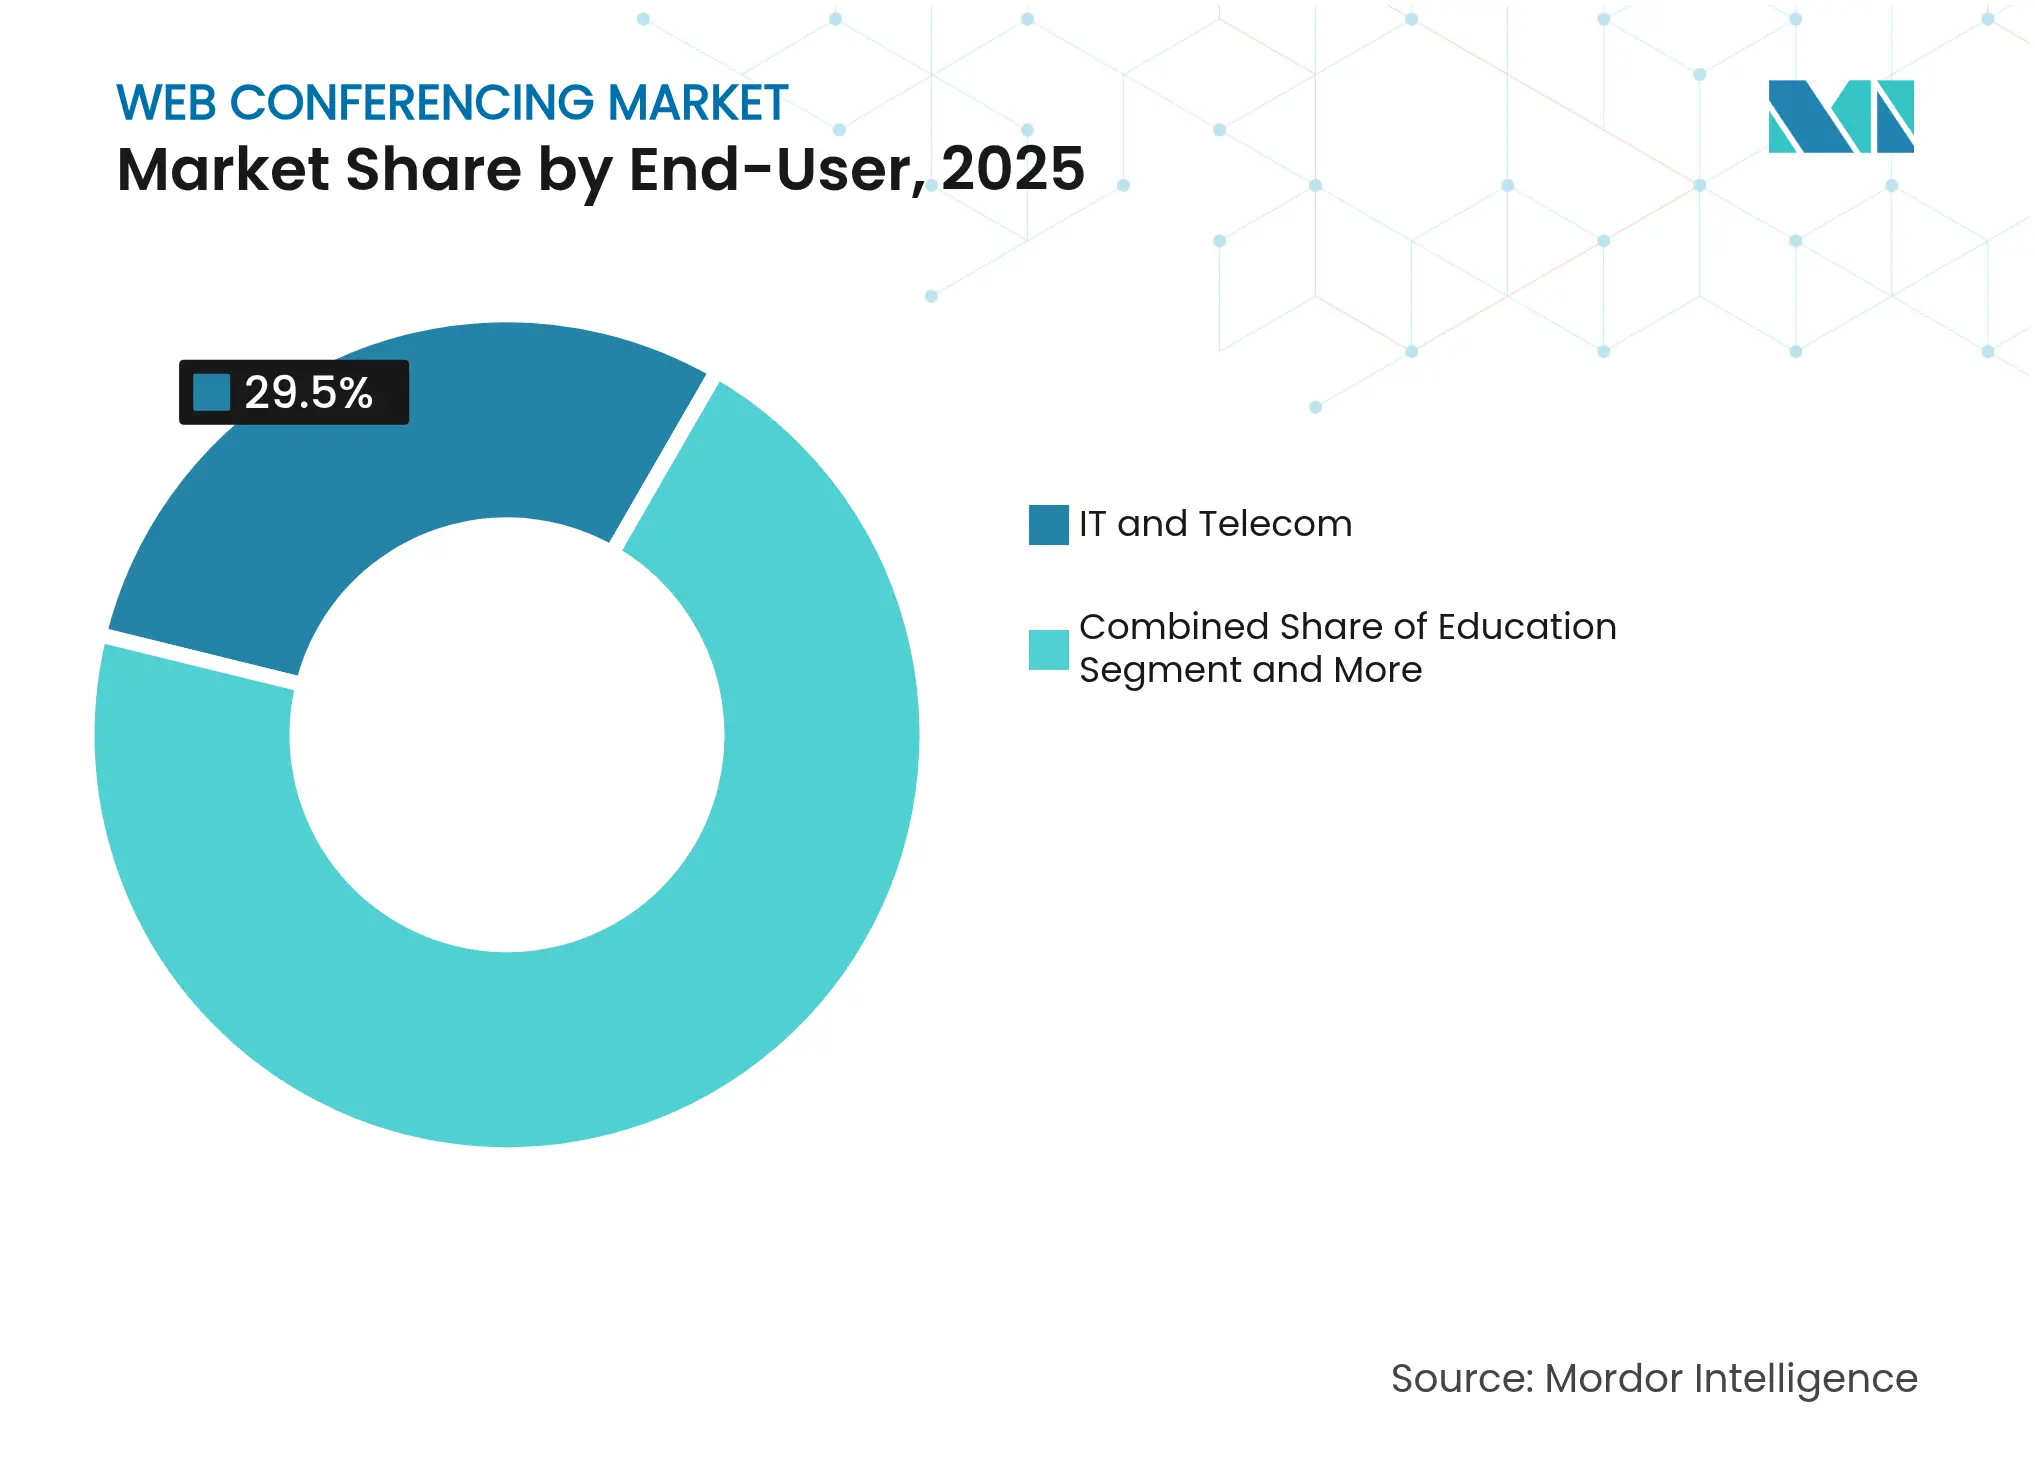
By End-User: Healthcare Acceleration Challenges IT Leadership
IT and Telecommunications customers commanded 29.50% revenue in 2025, yet Healthcare’s 13.13% CAGR redefines growth momentum. Telemedicine, digital front-door initiatives and HIPAA-compliant clinical collaboration systems fuel specialized demand for encrypted video workflows. In monetary terms, the segment’s expansion will lift its slice of the web conferencing market share over the forecast horizon as virtual care becomes mainstream.
Parallel gains occur in Government, Education and BFSI, each seeking secure engagement channels. The diversity of requirements—ranging from classroom breakout rooms to authenticated banking consultations—encourages modular platform architectures that can toggle industry-specific compliance controls.
Note: Segment shares of all individual segments available upon report purchase
By Subscription Model: Freemium Expansion Reshapes Monetization
Monthly and annual plans still generate 57.60% of 2025 turnover, yet freemium accounts grow at 14.92% CAGR. Vendors leverage free tiers for user acquisition, upselling advanced features such as AI note-taking or expanded meeting caps. The web conferencing market reflects a consumerization dynamic where experience quality during the first free call often dictates brand loyalty.
Pay-per-minute and elastic pricing inside freemium frameworks reduce adoption risk for sporadic users, while enterprise administrators favor predictable bundles. Striking a balance between generous free allowances and credible upgrade triggers emerges as a pivotal revenue-growth lever.
North America anchors 40.60% of global spending, underpinned by early enterprise digitization and stringent regulatory requirements. Although penetration among large firms nears maturity, continuing AI feature rollouts and zero-trust mandates sustain replacement cycles. Canada’s manufacturing digitization and Mexico’s cross-border supply-chain coordination add incremental demand, while U.S. state agencies prioritize security-cleared platforms.
Asia-Pacific offers the strongest upside with an 12.02% CAGR. Network reach sets the stage: India’s 5G footprint already covers 80% of its population. Mobile-native collaboration norms allow employers to leapfrog desktop setups, especially in micro-enterprise clusters across Southeast Asia. China, Japan and South Korea reinforce scale through industrial automation initiatives that embed video-enabled maintenance and remote inspection into factory workflows.
Europe combines high adoption with regulatory intricacy. GDPR’s strict data-processing rules and pending AI governance shape procurement, favoring vendors capable of demonstrating regional hosting and transparent algorithmic accountability. Sustainability imperatives amplify web conferencing’s appeal as firms document emissions savings to satisfy EU Corporate Sustainability Reporting Directive requirements. Nordic countries push advanced green-energy use cases, while Southern Europe’s infrastructure grants spur cloud migration.
Market Concentration
No participant exceeds a 30% revenue share, keeping the web conferencing market fragmented enough for niche challengers. Leaders like Microsoft, Zoom, IBM, Google and Cisco enrich platforms with AI assist, end-to-end encryption and workflow APIs to widen moats. The middle tier comprises telecom UCaaS providers—Verizon, AT& T and BT—that bundle conferencing to protect voice revenues. Below them, vertical specialists such as Pexip (healthcare, defense) and Lifesize (manufacturing) differentiate through compliance depth and deployment flexibility.
Strategic plays fall into three patterns. First, integrated-suite champions focus on platform breadth: Microsoft Teams embeds phone, chat and low-code apps; Google Workspace tightens Gmail and Meet synergies. Second, SME champions emphasize affordability and simplicity, often starting freemium to capture grassroots adoption. Third, vertical innovators build domain-specific add-ons—surgical camera feeds for healthcare, edge streaming for media. Security remains a potent battlefield: Zoom’s Kyber-768 deployment aims to pre-empt quantum-era threats[2]Zoom Video Communications, “Zoom Implements Post-Quantum End-to-End Encryption,” thehackernews.com.
M&A and partnerships continue. Microsoft integrates industry connectors through ISV programs, while Cisco pursues carrier alliances to place Webex inside operator rate-plans. Emerging disruptors test alternative transport layers—satellite broadband, edge acceleration—to serve regions where terrestrial networks lag.

*Disclaimer: Major Players sorted in no particular order
1. INTRODUCTION
2. RESEARCH METHODOLOGY
3. EXECUTIVE SUMMARY
4. MARKET LANDSCAPE
5. MARKET SIZE AND GROWTH FORECAST (VALUE)
6. COMPETITIVE LANDSCAPE
7. MARKET OPPORTUNITIES AND FUTURE OUTLOOK
Market Definitions and Key Coverage
Our study defines the web-conferencing market as all subscription-based and licensed software platforms that let users share voice, video, screen content, and whiteboards in real time through an internet browser or lightweight client. Revenue covers recurring fees and upfront licenses paid by enterprises, public agencies, and education bodies.
Scope exclusion: Stand-alone telephony bridges, pure video-hardware sales, and asynchronous collaboration tools such as email or shared drives are outside the model.
Segmentation Overview
Detailed Research Methodology and Data Validation
Primary Research
Mordor analysts interviewed IT managers, systems integrators, and channel partners across North America, Europe, and Asia-Pacific. These conversations validated average selling prices, churn triggers, and the pace at which large accounts shift from on-premise to cloud suites. Inputs from education and healthcare buyers grounded adoption assumptions in cost-sensitive segments.
Desk Research
We started with open datasets from the ITU on global fixed and mobile broadband lines, OECD statistics on remote-work prevalence, and trade association portals such as the Alliance for Telecommunications Industry Solutions for protocol adoption. Company 10-Ks, SEC filings, and investor decks revealed seat counts, monthly active users, and average subscription prices. Regulatory notices from the FCC and EU Digital Markets Act drafts offered visibility on compliance costs. Paid datasets, including D&B Hoovers for vendor revenue splits and Dow Jones Factiva for deal news, helped map competitive intensity. The sources listed illustrate our approach; many additional public records guided gap checks and clarification.
Market-Sizing & Forecasting
A top-down service revenue build multiplies the reachable user pool, derived from enterprise seat counts and higher education enrollment, by verified license penetration and average price. Target figures are then balanced through selective bottom-up checks, such as regional supplier roll-ups and sampled ASP times active seats, before final calibration. Key variables tracked include hybrid work adoption, average video minutes per employee per week, broadband quality indices, vendor price dispersion, and regulatory data residency mandates. Forecasts use multivariate regression with scenario bounds that were stress tested with our primary experts. Gaps in bottom-up data are bridged through region-specific substitution ratios sourced from comparable markets.
Data Validation & Update Cycle
Outputs pass two-step analyst reviews where anomaly flags, currency reconversions, and year-on-year variance thresholds are resolved. Models refresh annually; material events such as large M&A or new compliance rules trigger interim updates, and a last-mile sense check is completed before release.
Why Mordor's Web Conferencing Baseline Inspires Confidence
Benchmark comparison
Published estimates often diverge because each firm chooses different revenue streams, price points, and refresh cadences.
By aligning scope strictly to live, synchronous software revenue and by revisiting penetration drivers every year, we reduce noise that inflates or deflates other figures.
| Market Size | Anonymized source | Primary gap driver | ||
|---|---|---|---|---|
USD 7.13 B (2025) | Mordor Intelligence | - | Anonymized source:Mordor Intelligence | Primary gap driver:- |
USD 15.80 B (2025) | Global Consultancy A | includes hardware bundles and UCaaS voice seats | ||
USD 14.38 B (2024) | Industry Journal B | models gross bookings, not net recognized revenue | ||
USD 10.20 B (2023) | Regional Consultancy C | older base year and limited country coverage |
Pricing Strategy for Semiconductor Components
3 Min Read
Accelerating Additive Manufacturing Adoption in India
3 Min Read
When decisions matter, industry leaders turn to our analysts. Let’s talk.