Online Furniture Market Size and Share
Market Overview
| Study Period | 2020 - 2031 |
|---|---|
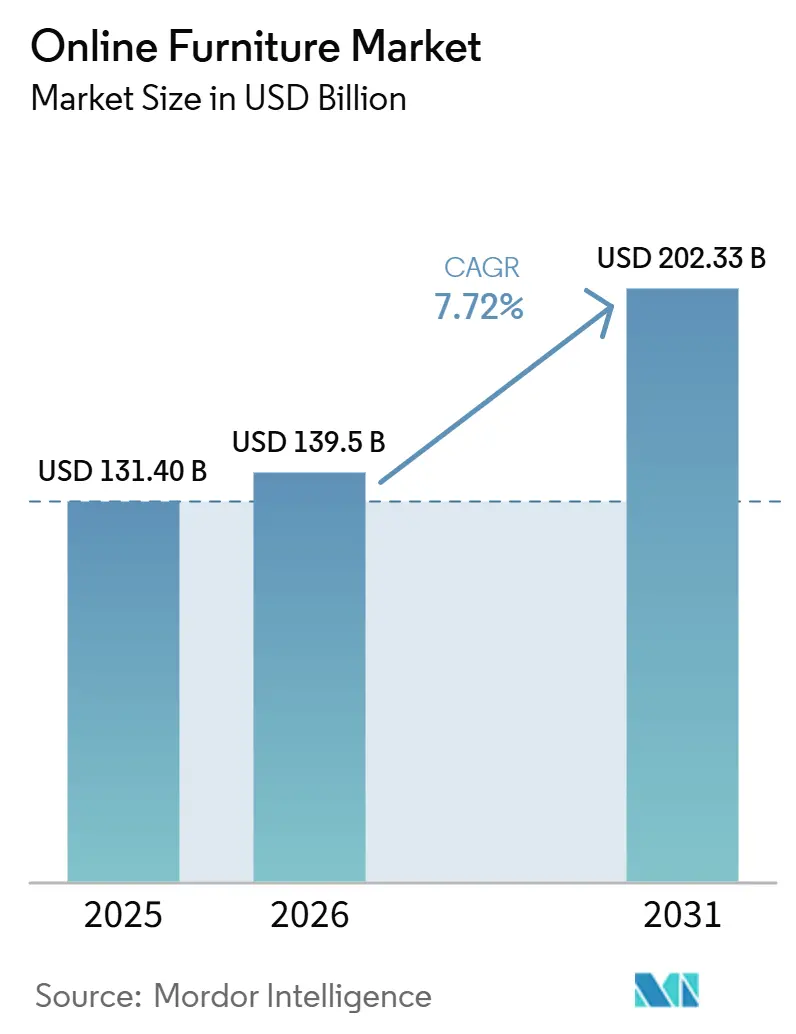
| Market Size (2026) | USD 139.5 Billion |
| Market Size (2031) | USD 202.33 Billion |
| Growth Rate (2026 - 2031) | 7.72% CAGR |
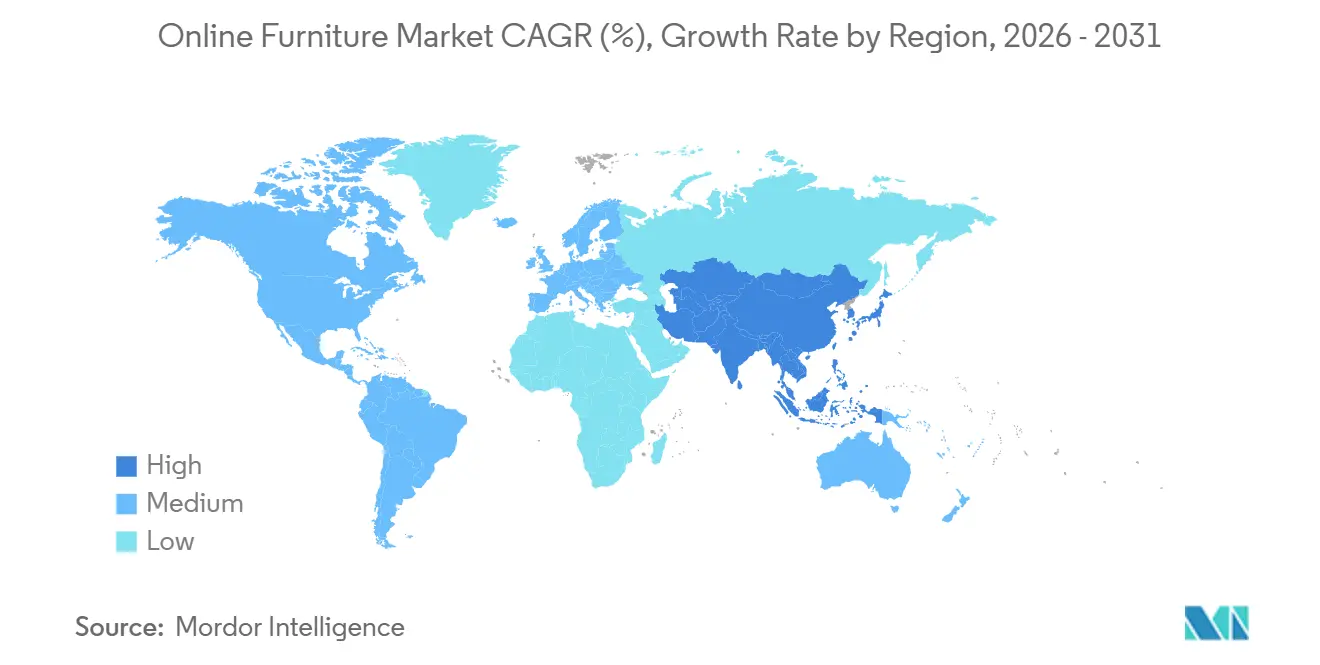
| Fastest Growing Market | Asia-Pacific |
| Largest Market | North America |
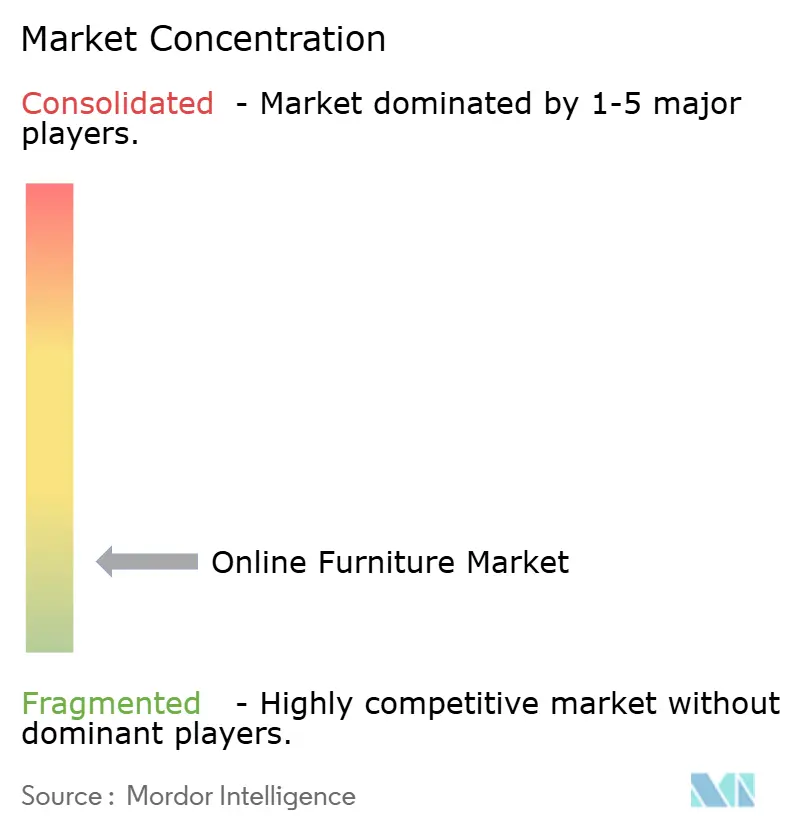
| Market Concentration | Low |
Major Players *Disclaimer: Major Players sorted in no particular order Image © Mordor Intelligence. Reuse requires attribution under CC BY 4.0. | |
Online Furniture Market Analysis by Mordor Intelligence
The global online furniture market size is expected to increase from USD 131.40 billion in 2025 to USD 139.50 billion in 2026 and reach USD 202.33 billion by 2031, growing at a CAGR of 7.72% over 2026-2031. The adoption of augmented reality and 3D visualization is improving purchase confidence and reducing returns in complex categories, while installment-based payment options are increasing conversion and average order values for high-ticket purchases. Logistics capabilities that blend micro-fulfillment, buy online, pickup in store, and white-glove services are unlocking growth for bulky products by reducing delivery friction and damage risk. E-commerce marketplaces retain scale advantages in traffic and trust. Yet, data-rich direct-to-consumer brands are expanding faster as they capture margin, control merchandising, and personalize the journey with first-party data. Regional dynamics are diverging, with North America holding the largest base and Asia-Pacific expanding at the fastest rate, driven by rising smartphone adoption and marketplace infrastructure. Regulatory attention on consumer finance, data privacy, and sustainability is shaping checkout design and returns programs, especially as authorities increase oversight of buy-now-pay-later practices and mandate stronger authentication[1]“Buy Now Pay Later Integration: The Complete Merchant Guide for 2026,” Paymid Guide, paymid.com.
Key Report Takeaways
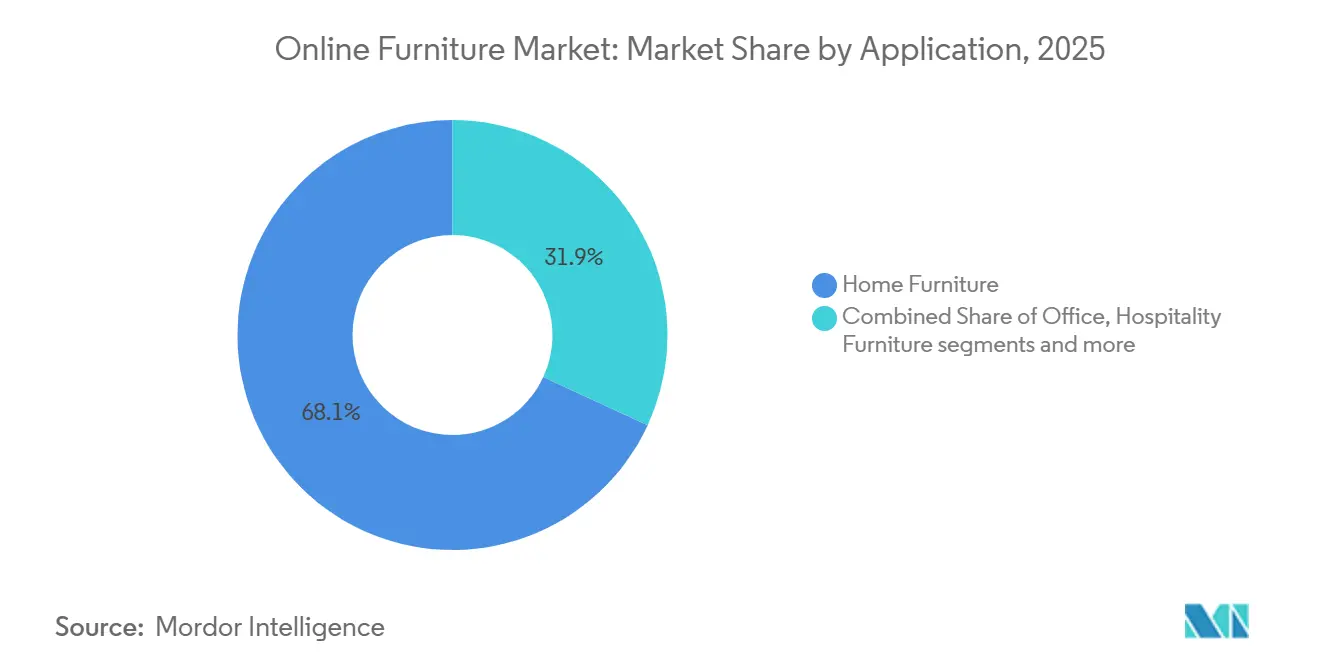
- By application, home furniture led with 68.11% revenue share in 2025, while office furniture is expected to expand at an 8.78% CAGR through 2031.
- By price range, the mid-range segment accounted for 44.13% of the online furniture market in 2025, while the premium segment is forecast to expand at a 9.58% CAGR through 2031.
- By material, wood commanded a 44.35% share of the online furniture market in 2025, while plastic and polymer are projected to advance at an 8.18% CAGR to 2031.
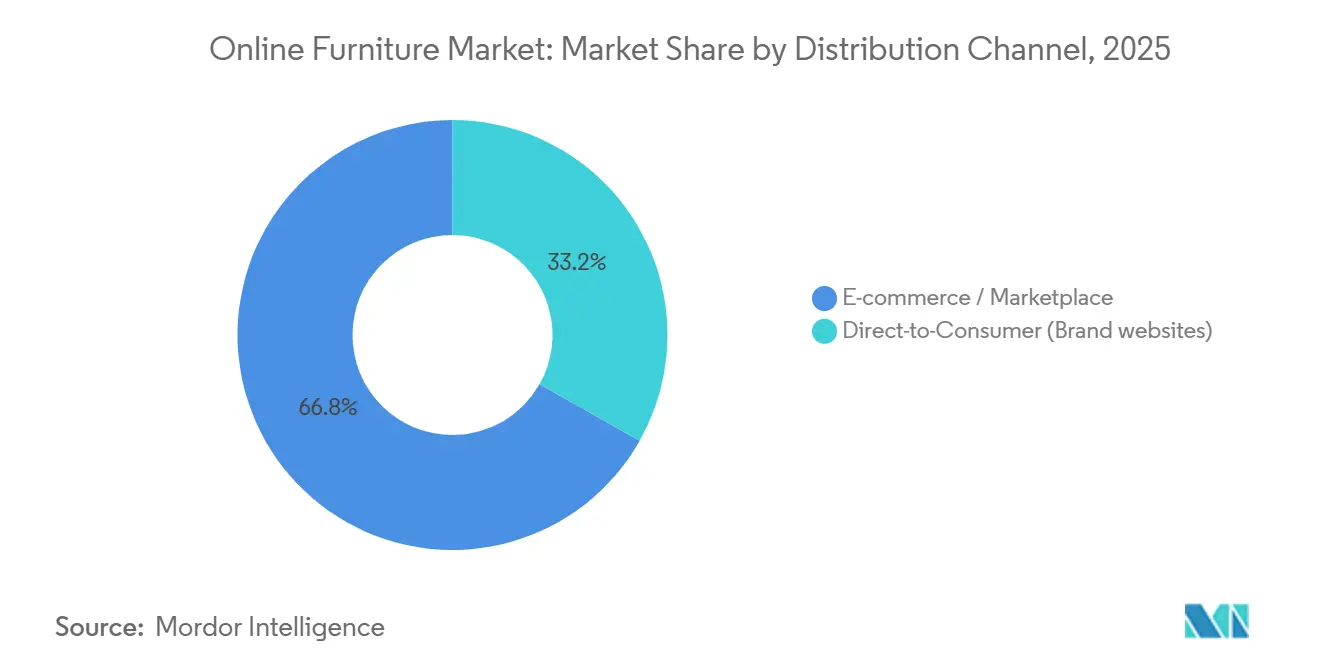
- By distribution channel, e-commerce marketplaces captured 66.81% of the online furniture market in 2025, while direct-to-consumer is expected to expand at a 10.02% CAGR through 2031.
- By geography, North America held a 36.17% share in 2025, while Asia-Pacific is forecast to is expected to expand at 8.43% CAGR through 2031.
Note: Market size and forecast figures in this report are generated using Mordor Intelligence’s proprietary estimation framework, updated with the latest available data and insights as of January 2026.
Global Online Furniture Market Trends and Insights
Drivers Impact Analysis*
| Driver | ~ (%) Impact on CAGR Forecast | Geographic Relevance | Impact Timeline |
|---|---|---|---|
| AR/3D visualization adoption boosts conversion and reduces returns | 1.50% | Global, spearheaded by North America & Europe | Short term (≤ 2 years) |
| Payment flexibility (BNPL/installments) raises conversion and AOV for high-ticket purchases | 2.00% | North America, expanding to Asia-Pacific & Latin America | Medium term (2-4 years) |
| Omnichannel logistics (white-glove, BOPIS, micro-fulfillment) reduce friction for bulky items | 1.30% | Global, with mature adoption in North America; Asia-Pacific catch-up | Medium term (2-4 years) |
| Rising internet/smartphone penetration and marketplace reach expand addressable demand | 2.50% | Asia-Pacific core, spill-over to Middle East & Africa and Latin America | Long term (≥ 4 years) |
| AI interior-design assistants enable basket bundling and full-room visualization | 1.00% | North America & Europe early movers; Asia-Pacific following | Short to Medium term |
| Circular resale/refurbishment platforms expand supply and trust for value-conscious buyers | 0.90% | Europe leading, North America accelerating; nascent in Asia-Pacific | Medium to Long term |
| Source: Mordor Intelligence | |||
AR/3D Visualization Adoption Boosts Conversion and Reduces Returns
AR and 3D configuration tools have moved from pilots to core purchase enablers for the online furniture market, lifting conversion in high-consideration categories by making size, fabric, and fit tangible on mobile and desktop. Retailers using interactive 3D and AR report higher basket values as shoppers preview premium finishes at home and gain confidence to upgrade when options are visible in context. Case studies in modular categories show first-attempt delivery rates improving when customers configure pieces accurately before checkout, lowering costly re-delivery cycles and damage risk. As retailers integrate room planners and 3D visualization into product detail pages, return rates fall because the dominant failure modes relate to size and color mismatch that AR addresses. Retailers are also streamlining product content creation by generating scalable 3D assets in place of costly photography, which speeds assortment refreshes and supports faster A/B testing of imagery to drive click-throughs. Standards work around measurement precision is emerging and will likely strengthen consumer trust as accuracy benchmarks for dimensional representation mature, especially for large pieces that strain last-mile operations.
Payment Flexibility (BNPL/Installments) Raises Conversion and AOV for High-Ticket Purchases
Installment options have become table stakes for the online furniture market, where average ticket sizes are high, and purchase decisions involve financing trade-offs. Retailers that add BNPL at checkout report measurable gains in conversion and average order value because installment framing reduces friction for purchases of USD 500 to USD 5,000 that would otherwise cause cart abandonment. Category leaders are extending partnerships across markets to widen access, as shown by BNPL expansion programs serving regulated consumers with term options[2]“Affirm expands Wayfair buy now, pay later to UK, Canada,” eCommerceNews UK, ecommercenews.uk. DTC brands are also integrating BNPL to capture high-intent shoppers at the moment of consideration, with programs that offer short-term pay-in-four plans and longer financing windows at checkout. Though regulators are increasing scrutiny of late fees and underwriting transparency, compliance around clear disclosures and authentication aligns with consumer protection goals and strengthens trust in a category where many purchases coincide with major life events. As adoption deepens, BNPL becomes less a promotion and more a conversion layer that brands must optimize through A/B testing of offer placement, rate presentation, and eligibility flows to protect margin while capturing incremental volume.
Omnichannel Logistics (White-Glove, BOPIS, Micro-Fulfillment) Reduce Friction for Bulky Items
Bulky and fragile furniture requires precise logistics orchestration that now spans showrooms, dark stores, micro-fulfillment, and specialized last-mile partners. The last mile can account for more than half of the end-to-end shipping cost for big and bulky goods, which is why route optimization, appointment scheduling, and proactive communication have become decisive service elements for the online furniture market. Leading retailers pair physical showcases with local fulfillment to shorten distances and reduce handling, improving speed for big-ticket items while providing tactile experiences that raise conversion. Brands are using orchestration platforms and delivery partners to raise first-attempt success rates, while bringing assembly and room-of-choice placement into the core promise for higher satisfaction and lower returns. BOPIS remains a valuable flexibility feature that also drives add-on purchases during pickup, making it an effective hybrid tactic for mid-ticket goods and accessory categories that complement big pieces. Together, these tactics reduce damage and rescheduling risks that erode margin, helping operators deliver on speed and reliability expectations for room-of-choice delivery.
Rising Internet/Smartphone Penetration and Marketplace Reach Expand Addressable Demand
Rising smartphone adoption and broader market coverage are opening the online furniture market to consumers in cities and regions where access to well-curated physical stores has been limited. India illustrates this transition with rapid growth in organized retail and platform-driven access, expanding the base of shoppers who are comfortable making considered purchases online. Marketplace ecosystems in China and Southeast Asia connect sellers to payments, logistics, and trust signals, lowering the barrier to entry for new brands while standardizing service elements consumers expect for large items. Mobile-first behavior is now the norm in many markets, and app-native journeys that blend visualization, ratings, and installments are driving share gains for platforms and DTC brands alike. As cross-border rules around data security and authentication evolve, platforms that operationalize compliance without adding friction will capture higher intent traffic for high-ticket purchases that demand confidence at checkout. Over the forecast period, penetration gains from Tier II and Tier III cities are expected to remain a durable driver of demand in Asia-Pacific as payment adoption and logistics networks continue to mature.
Restraints Impact Analysis*
| Restraint | (~) (%) Impact on CAGR Forecast | Geographic Relevance | Impact Timeline |
|---|---|---|---|
| High reverse-logistics costs and damage risk for large, fragile items | -0.50% | Global, particularly acute in North America & Europe | Short term (≤ 2 years) |
| Last-mile white-glove delivery complexity and cost escalation | -0.40% | Urban centers globally; exacerbated in North America dense metros | Medium term (2-4 years) |
| Urban access constraints (elevators/stairs/time windows) raise delivery/return costs | -0.30% | Dense urban markets globally, most severe in Asia-Pacific & Europe metros | Short to Medium term |
| Quality variance/"fast furniture" sustainability scrutiny elevates return risk | -0.30% | North America & Europe leading; regulatory pressure intensifying globally | Medium to Long term |
| Source: Mordor Intelligence | |||
High Reverse-Logistics Costs and Damage Risk for Large, Fragile Items
Returns on furniture are costly due to dimensional weight, damage risk, and refurbishment needs that often exceed the economic value of recovered goods. Online return rates in furniture are materially higher than in-store rates and can entail additional costs for shipping, inspection, cleaning, and repackaging, which is why returnless refunds and localized returns hubs are becoming common for low-resale-value items. The damage risk is magnified when items move through reverse networks without original packaging, turning potentially resellable items into liquidation stock that retailers monetize through specialized recommerce partners[3]“ClearCycle - Recommerce and Overstock Solutions for Retailers,” ClearCycle, clearcycle.co.uk. Retailers are using data to minimize preventable returns by improving pre-purchase sizing confidence and by tightening fraud checks that identify remorse-driven requests. Still, process costs remain a drag on profitability for heavy goods. Circular channels that refurbish and resell large items are growing and can reclaim value while reducing environmental impact and landfill waste, which helps offset reverse logistics burdens over time. The near-term headwind persists for the online furniture market, underscoring the need for better visualization, packaging integrity, and network design to protect margins.
Last-Mile White-Glove Delivery Complexity and Cost Escalation
White-glove delivery adds complexity due to two-person crews, restrictive building policies, and room-of-choice placement and assembly that extend service time per stop. Delivery surcharges for oversized items have increased, intensifying cost pressures for shipments that exceed weight and size thresholds common in furniture categories. Retailers and delivery partners are trimming failure rates with tighter appointment windows and proactive updates, but urban constraints and labor availability keep costs elevated. Investments in micro-fulfillment and hybrid fleet models help shorten routes and reduce handling events, and platforms that orchestrate carrier selection and capacity can reduce waste across the delivery chain. Store networks that double as local hubs create inventory proximity, supporting faster delivery turnarounds for big items. Even with these advances, unit economics for heavy goods will remain sensitive to wage inflation, building-access constraints, and policy changes that affect delivery time windows.
*Our forecasts treat driver/restraint impacts as directional, not additive. The impact forecasts reflect baseline growth, mix effects, and variable interactions.
Segment Analysis
By Application: Office Furniture Fuels Growth Amid Hybrid-Work Momentum
In the online furniture market, home furniture accounted for 68.11% of the market in 2025, as households continued to invest in living spaces that support entertainment, relaxation, and work-from-home needs. Meanwhile, the office furniture segment is projected to record a CAGR of 8.78% through 2031, driven by hybrid work schedules that encourage enterprises to refresh shared workspaces and remote employees to upgrade their home office setups. Ergonomic designs and sit-stand configurations have broadened appeal among remote professionals and small businesses that demand durable performance at accessible prices. Within home categories, sofas and dining sets drive revenue, while bedroom and seating see steady unit growth from modular and space-efficient designs that align with urban living. Hospitality, education, and healthcare remain smaller bases but are resilient, with demand tied to property refresh cycles and institutional standards for durability and cleanability. Brands that embed visualization, provide clear material disclosure, and offer installment options at the category level build confidence in higher-priced configurations in the online furniture market[4]Rod Reynolds, “3D and AR in Furniture Ecommerce: A Complete Guide for Retailers, Brands, and Manufacturers,” iEnhance Insights, ienhance.co.
The long-term outlook for the online furniture market favors a diversified application mix in which enterprise and residential spending both contribute to a steadier cycle. Commercial refits for collaborative layouts complement at-home upgrades that converge toward corporate-grade ergonomics, reducing the gap between consumer and contract quality expectations. Subscription-based furniture and take-back programs are gaining traction among renters and mobile professionals who value flexibility and sustainability. As visualization improves and delivery reliability rises, more high-consideration SKUs move online, supporting a wider array of use cases from entry-level setups to premium rooms. Compliance needs differ by context, yet broader preferences for certified low-emission materials and recyclable inputs now influence assortment decisions in both residential and commercial channels.


By Price Range: Premium Segment Captures Affluent Consumers via Financing and Curation
In the online furniture market, the mid-range segment accounted for 44.13% of the market in 2025, supported by brands that effectively balance quality and affordability to meet the needs of mainstream households. Meanwhile, the premium segment is projected to record a CAGR of 9.58% through 2031, driven by curated product assortments, flexible installment options, and immersive visualization tools that enhance buyer confidence and showcase high-end furniture more effectively during the online purchasing process. Premium buyers value craftsmanship and sustainability credentials and respond to clear materials disclosure and in-room previews that de-risk selection. Financing reframes large outlays into manageable installments, narrowing the perceived gap between mid-range and premium for design-forward items.
Across price bands, consumers in the online furniture market now expect transparency on durability, origins, and recyclability, and they favor brands that enable self-service repairs and replacements. Mid-range leaders raise value perception through modularity and bundle pricing that address small-space needs. Economy tiers remain relevant in cost-sensitive situations, yet must balance price with minimum durability and service levels under rising fulfillment costs. Premium lines that integrate circular services and trade-in credits build loyalty and lifetime value, aligning brand identity with sustainability. Over the forecast horizon, premium’s momentum is supported by installment adoption, aspirational positioning, and room-planning tools that promote whole-space solutions rather than single-SKU purchases.
By Distribution Channel: DTC Brands Challenge Marketplace Dominance with First-Party Data and Margin Capture
E-commerce accounted for 66.81% in 2025 due to its traffic scale, shipping programs, and aggregated trust signals. Direct-to-consumer is the fastest-growing channel, projected to expand at a 10.02% CAGR, as brands leverage first-party data for personalization, control merchandising, and capture stronger unit economics that support service enhancements in the online furniture market. DTC operators integrate BNPL directly in checkout, deploy AR content assets faster than marketplace templates allow, and cultivate community through loyalty and take-back programs. Platform improvements in search and recommendations keep marketplaces central to discovery, yet differentiation often requires brand-owned content and service guarantees that extend beyond marketplace policies.
The future state is hybrid, with retailers blending marketplace reach and DTC control to meet shoppers where they browse and buy. Physical locations that double as local fulfillment nodes help DTC brands bridge the last-mile gap for big items and provide tactile experiences for color and fabric verification. Third-party orchestration platforms reduce complexity as brands flex between internal fleets and partners based on service level, location, and order characteristics. Marketplace commission structures and ad auctions create incentives for DTC growth, while platform programs that feature curated brands will continue to evolve. Over the forecast period, the online furniture market will reflect both models, with DTC share gains where brand story, materials credibility, and white-glove service are decisive.
By Material: Plastic & Polymer Innovation Unlocks Cost and Weight Efficiencies
Wood led with 44.35% in 2025, benefiting from consumer preference for durability, refinishing potential, and timeless aesthetics. Plastics and polymers are the fastest-growing material group, with a 8.18% CAGR, supported by innovations in recycled inputs and lighter designs that reduce freight costs under dimensional-weight pricing in the online furniture market. Metal remains an important substrate in outdoor and contract categories for strength and code compliance, while blends of natural and synthetic fabrics broaden performance and maintenance capabilities. As service and delivery costs climb, lighter materials that meet durability thresholds will win share in categories suited to modular designs that ship efficiently and assemble easily at home.
Sustainability preferences shape material selections across tiers, with certifications and recycled content signaling responsible sourcing. Lighter polymer frames paired with durable upholstery and cleanable performance fabrics support long service lives at lower ownership costs. Wood remains the anchor for heirloom pieces and premium rooms, but its share reflects supply and compliance dynamics that can raise input costs and documentation needs. Reuse and take-back programs create secondary pathways for materials and finished goods, aligning material choices with circular models that reclaim value. Over time, composite innovations will broaden the material palette, while clear disclosure of inputs and finishing processes builds trust among sustainability-minded shoppers.
Geography Analysis
North America held 36.17% of the online furniture market share in 2025 as mature e-commerce infrastructure, high household spending on furnishings, and rapid fulfillment expectations supported sustained online adoption. Scale players have added flagship and large-format stores that double as local fulfillment hubs, improving speed for big and bulky items while providing tactile experiences that raise conversion for premium tickets. As mortgage rates stabilize, replacement cycles for key rooms should improve, which supports categories that benefit from visualization and installment options at checkout. Regulatory oversight of financing practices and chemical disclosures raises compliance needs for sellers, yet transparency and authentication build trust in a category with long ownership horizons. The United States and Canada also show active experimentation with recommerce and localized returns processing that shorten reverse legs for heavy goods while tapping circular resale partners to reclaim value.
Asia-Pacific is the fastest-growing region with an expected 8.43% CAGR as mobile-first consumption, marketplace infrastructure, and new store openings expand the addressable base for the online furniture market. India’s shift from unorganized to organized retail showcases the role of hybrid strategies, where stores serve as experience anchors while platforms and brand sites capture nationwide demand. Chinese platforms continue to set logistics benchmarks, and Southeast Asia’s dense urban cores support rapid last-mile models that favor modular goods designed for elevators and compact dwellings. Payment ecosystems that include wallets and installment plans reduce friction for high-consideration items. At the same time, strong marketplace policies on delivery and returns set minimum service levels that new entrants must match. Over 2026-2031, regional leaders that integrate visualization, localized delivery, and installment options are positioned to capture uplift from rising urban incomes and household formation.
Europe’s online penetration is already high in key markets, and growth is steadier as digital journeys mature and sustainability standards advance. Strong Customer Authentication requirements and GDPR standards add additional steps at checkout and in data handling, elevating trust in high-value categories of the online furniture market. The region’s regulatory push for durability and repairability favors brands that offer modular designs, replaceable parts, and take-back programs that keep products in circulation longer. Retailers pair online planning tools with appointment-based consultation to support complex kitchen and storage projects that drive high basket values without heavy store footprints. Omnichannel models leverage stores as service nodes that support BOPIS and short-haul delivery in urban cores, helping control last-mile cost and service variability under dense traffic conditions. Over the forecast period, compliance-driven differentiation and circular programs will continue to shape the competitive playbook as consumers weigh performance, sustainability, and delivery reliability in purchase decisions.

Competitive Landscape
The online furniture market is fragmented beneath a tier of scale players that combine platform reach, store networks, and strong fulfillment capabilities. Platform leaders anchor discovery and logistics velocity, while DTC innovators carve out share with curated assortments, transparent materials narratives, and owned checkout that embeds BNPL and AR content. Wayfair’s store expansion strategy uses large-format locations as sales engines and local fulfillment nodes, with customer metrics indicating strong new-customer acquisition and higher conversion rates for considered purchases. IKEA continues to scale hybrid models, leveraging remote planning services and store networks to enable BOPIS and short-haul delivery for heavy goods, and integrating circular programs that support trade-ins and resale. Competitive intensity increasingly hinges on logistics orchestration, visualization, and financing integration that together raise confidence and reduce friction from product discovery through room-of-choice placement.
M&A and capital allocation continue to reshape distribution and product pipelines across the online furniture market. GigaCloud’s acquisition of New Classic Home Furnishings expands its B2B reach into wholesale distribution and broadens SKU coverage in North America. Twin Star Home’s acquisition of Walker Edison strengthens omnichannel capabilities and consolidates design, sourcing, and distribution under one platform. DTC brands and niche specialists are investing in showrooms and visualization to bridge tactile gaps for premium orders and use recycled-content materials to align with sustainability preferences while controlling dimensional weight for delivery. BNPL partnerships deepen category coverage by integrating to expand consumer eligibility and offer longer terms for higher-priced carts. Together, these actions reflect a shift toward controlled customer journeys, margin protection, and capital-light expansion supported by orchestration tech and specialized partners.
Innovation in recommerce and service models is also advancing across the online furniture market. Recommerce infrastructure helps retailers monetize returns on large items by refurbishing and reselling them through secondary channels, reducing reverse logistics hours and waste while improving recovery rates. Marketplaces and community platforms in Southeast Asia are adding bulky-item delivery services with assembly and coverage, which addresses a key obstacle to secondhand adoption during peak demand periods. In soft furnishings, specialty players are scaling with showroom rollouts and trade portals that enable custom projects at speed, supported by manufacturing and fabrication improvements that reduce cycle times and expand assortment. As the forecast period unfolds, leaders will emphasize clarity in materials and pricing, integrated financing at checkout, and reliable fulfillment, while using physical touchpoints selectively to de-risk premium purchases in the online furniture market.
Online Furniture Industry Leaders
Amazon.com, Inc.
Alibaba Group
JD.com, Inc.
Wayfair Inc.
Inter IKEA Holding B.V. (IKEA)
- *Disclaimer: Major Players sorted in no particular order

Recent Industry Developments
- April 2026: Bed Bath & Beyond Inc. completed the acquisition of The Container Store for USD 150 million, integrating its retail locations and home services business, including custom closets, flooring, and design elements, while cross-selling home categories.
- February 2026: Affirm expanded its BNPL partnership with Wayfair into the United Kingdom and Canada, enabling installment payments for furniture and home décor purchases.
- February 2026: Klarna partnered with a direct-to-consumer furniture brand to offer installment payment options at checkout in the United States and Canada.
- December 2025: Klarna expanded BNPL offerings through a partnership with a DTC furniture brand, adding pay-in-full, pay-in-4, and financing options.


Global Online Furniture Market Report Scope
| Home Furniture | Chairs |
| Tables (side tables, coffee tables, dressing tables, etc.) | |
| Beds | |
| Wardrobes | |
| Sofas | |
| Dining Tables/Dining Sets | |
| Kitchen Cabinets | |
| Other Home Furniture (bathroom furniture, outdoor furniture, etc.) | |
| Office Furniture | Chairs |
| Tables | |
| Storage Cabinets | |
| Desks | |
| Sofas and Other Soft Seating | |
| Other Office Furniture | |
| Hospitality Furniture | |
| Educational Furniture | |
| Healthcare Furniture | |
| Other Applications (public places, retail malls, government offices, etc.) |
| Economy |
| Mid-Range |
| Premium |
| Wood |
| Metal |
| Plastic & Polymer |
| Other Materials |
| E-commerce / Marketplace |
| Direct-to-Consumer (Brand websites) |
| North America | Canada |
| United States | |
| Mexico | |
| South America | Brazil |
| Peru | |
| Chile | |
| Argentina | |
| Rest of South America | |
| Europe | United Kingdom |
| Germany | |
| France | |
| Spain | |
| Italy | |
| BENELUX (Belgium, Netherlands, and Luxembourg) | |
| NORDICS (Denmark, Finland, Iceland, Norway, and Sweden) | |
| Rest of Europe | |
| Asia-Pacific | India |
| China | |
| Japan | |
| Australia | |
| South Korea | |
| South East Asia (Singapore, Malaysia, Thailand, Indonesia, Vietnam, and the Philippines) | |
| Rest of Asia-Pacific | |
| Middle East and Africa | United Arab Emirates |
| Saudi Arabia | |
| South Africa | |
| Nigeria | |
| Rest of the Middle East and Africa |
| By Application | Home Furniture | Chairs |
| Tables (side tables, coffee tables, dressing tables, etc.) | ||
| Beds | ||
| Wardrobes | ||
| Sofas | ||
| Dining Tables/Dining Sets | ||
| Kitchen Cabinets | ||
| Other Home Furniture (bathroom furniture, outdoor furniture, etc.) | ||
| Office Furniture | Chairs | |
| Tables | ||
| Storage Cabinets | ||
| Desks | ||
| Sofas and Other Soft Seating | ||
| Other Office Furniture | ||
| Hospitality Furniture | ||
| Educational Furniture | ||
| Healthcare Furniture | ||
| Other Applications (public places, retail malls, government offices, etc.) | ||
| By Price Range | Economy | |
| Mid-Range | ||
| Premium | ||
| By Material | Wood | |
| Metal | ||
| Plastic & Polymer | ||
| Other Materials | ||
| By Distribution Channel | E-commerce / Marketplace | |
| Direct-to-Consumer (Brand websites) | ||
| By Geography | North America | Canada |
| United States | ||
| Mexico | ||
| South America | Brazil | |
| Peru | ||
| Chile | ||
| Argentina | ||
| Rest of South America | ||
| Europe | United Kingdom | |
| Germany | ||
| France | ||
| Spain | ||
| Italy | ||
| BENELUX (Belgium, Netherlands, and Luxembourg) | ||
| NORDICS (Denmark, Finland, Iceland, Norway, and Sweden) | ||
| Rest of Europe | ||
| Asia-Pacific | India | |
| China | ||
| Japan | ||
| Australia | ||
| South Korea | ||
| South East Asia (Singapore, Malaysia, Thailand, Indonesia, Vietnam, and the Philippines) | ||
| Rest of Asia-Pacific | ||
| Middle East and Africa | United Arab Emirates | |
| Saudi Arabia | ||
| South Africa | ||
| Nigeria | ||
| Rest of the Middle East and Africa | ||


Key Questions Answered in the Report
What is the current size and growth outlook for the online furniture market?
The online furniture market size was USD 131.40 billion in 2025 and is forecast to reach USD 202.33 billion by 2031, reflecting a 7.72% CAGR over 2026-2031.
Which region leads and which is growing fastest in online furniture?
North America led with 36.17% in 2025, while Asia-Pacific is the fastest-growing region with an expected 8.43% CAGR through 2031.
Which applications and price tiers are driving growth online?
Home furniture led with 68.11% in 2025, and office furniture is growing fastest at 8.78% CAGR; mid-range held 44.13% share, while premium is growing fastest at 9.58% CAGR.
How are AR and BNPL changing online furniture purchasing behavior?
AR and 3D visualization increase buyer confidence and reduce returns for large items, while BNPL improves conversion and raises average order values for high-ticket purchases.
Which channels and materials are gaining share online?
Marketplaces held 66.81% in 2025, but DTC channels are growing at 10.02% CAGR; wood led with 44.35% and plastic or polymer is growing fastest at 8.18% CAGR.
Page last updated on:


