Market Overview
| Study Period | 2020 - 2031 |
|---|---|
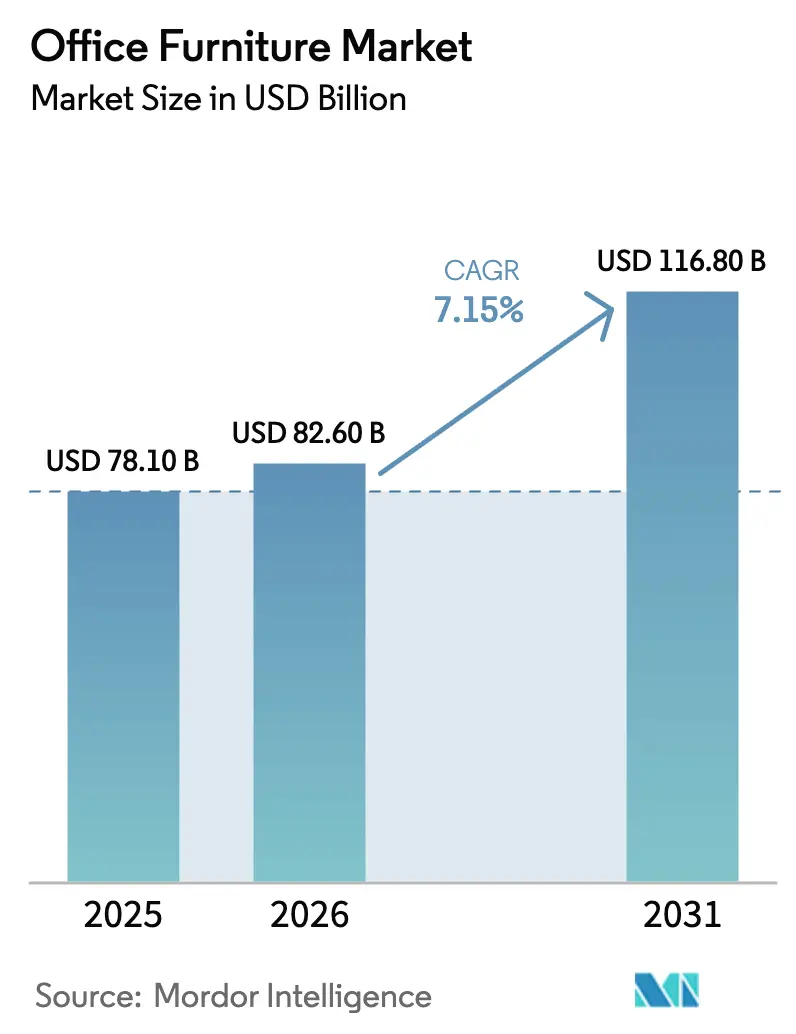
| Market Size (2026) | USD 82.60 Billion |
| Market Size (2031) | USD 116.80 Billion |
| Growth Rate (2026 - 2031) | 7.15% CAGR |
| Fastest Growing Market | Asia Pacific |
| Largest Market | Asia Pacific |
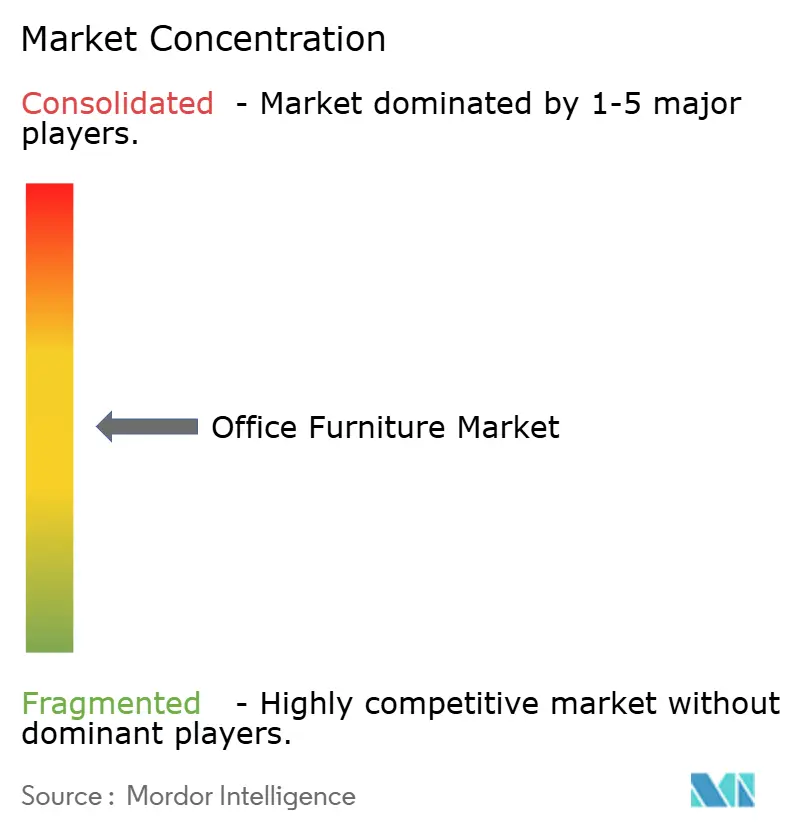
| Market Concentration | Medium |
Major Players *Disclaimer: Major Players sorted in no particular order Image © Mordor Intelligence. Reuse requires attribution under CC BY 4.0. | |
Office Furniture Market Analysis by Mordor Intelligence
The office furniture market size is projected to expand from USD 78.10 billion in 2025 and USD 82.60 billion in 2026 to USD 116.80 billion by 2031, registering a CAGR of 7.15% between 2026 to 2031. Hybrid work has matured into a stable operating model, so companies are outfitting offices as collaboration hubs with ergonomic seating, technology-integrated workstations, and flexible partitions that enable quick reconfiguration. The office furniture market is also responding to regulatory and buyer scrutiny on sustainability, which is shifting purchase decisions toward products with credible materials traceability, circular design, and lower embodied carbon. Large incumbents are consolidating scale to manage input volatility and distribution complexity, illustrated by HNI Corporation’s agreement to acquire Steelcase to unlock sizable procurement synergies and deepen reach in complementary customer sets. Policy actions on metals and select categories are inflating costs, while Asia-Pacific is pulling investment and showroom expansion as the fastest-growing regional demand centre.
Key Report Takeaways
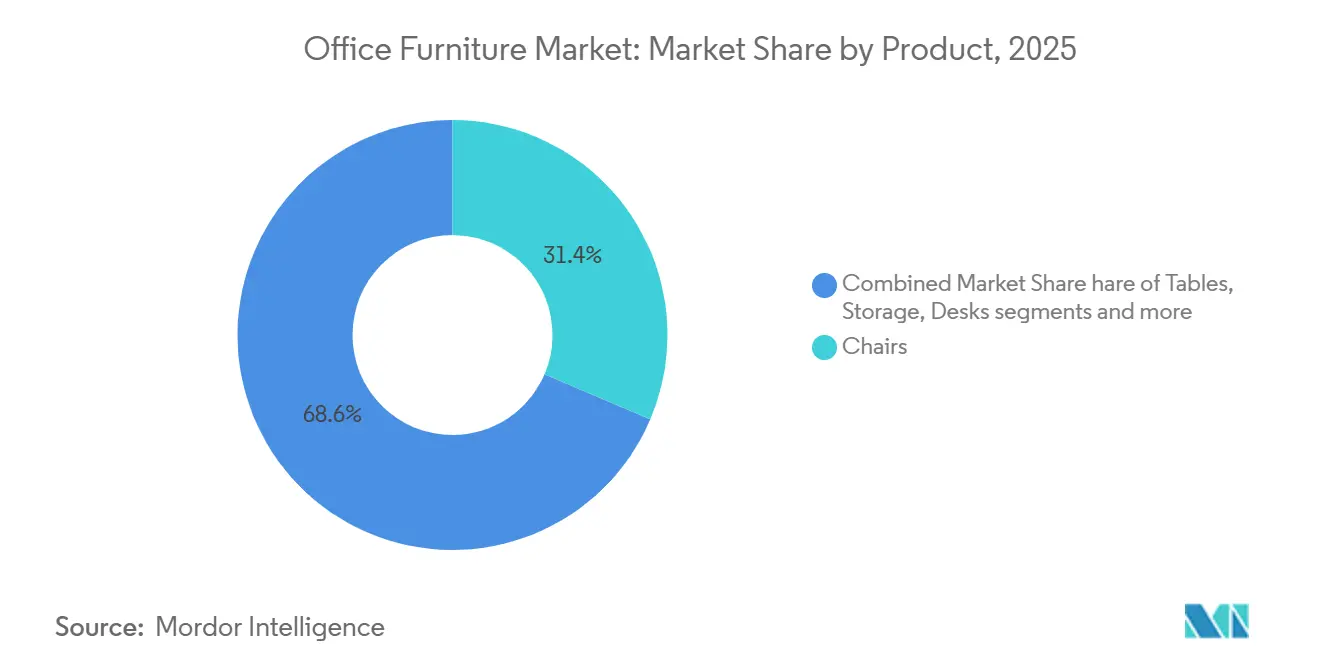
- By product category, chairs led with 31.40% market share in 2025 and are forecast to expand at an 8.30% CAGR through 2031.
- By material, wood held a 45.20% market share in 2025, while metal is projected to grow at a 7.60% CAGR through 2031.
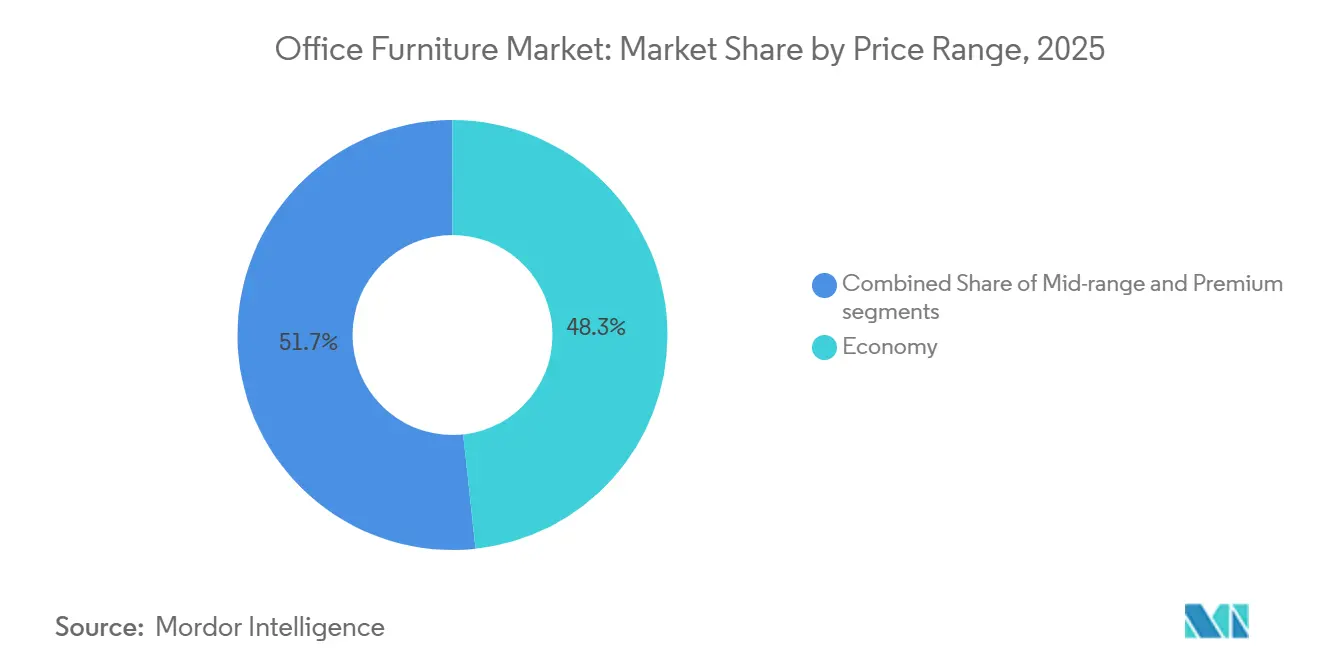
- By price range, economy commanded 48.30% share in 2025, and premium is projected to expand at an 8.60% CAGR through 2031.
- By end user, corporate offices accounted for 41.80% of the office furniture market in 2025, while hospitality and retail back-office are projected to grow at a 7.10% CAGR through 2031.
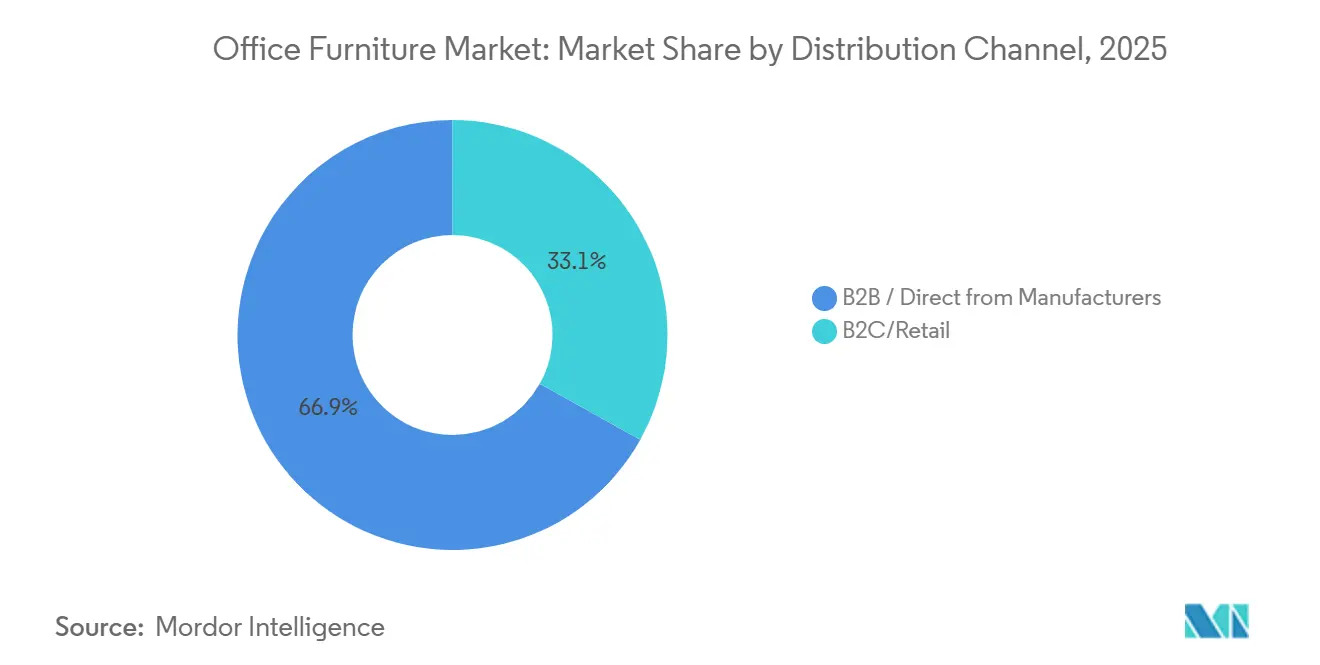
- By distribution channel, B2B direct-from-manufacturer pathways held 66.90% of the office furniture market share in 2025, while B2C retail and online are projected to grow at a 7.90% CAGR through 2031.
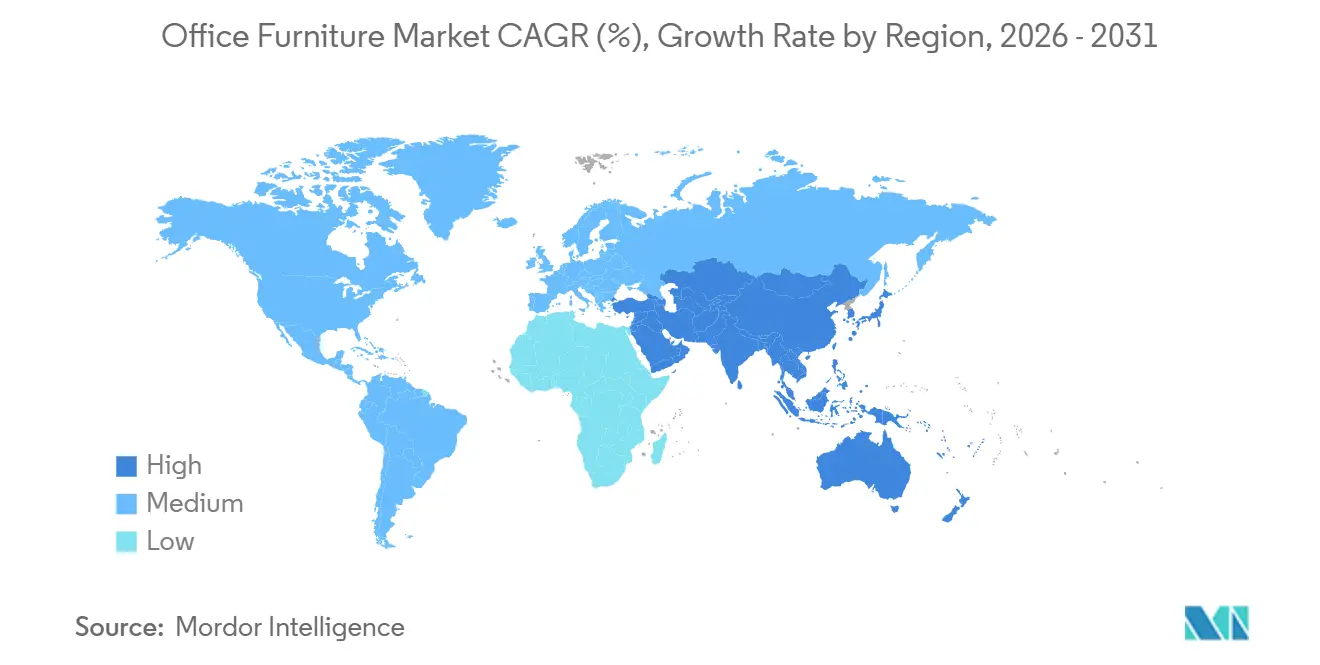
- By geography, Asia-Pacific accounted for 41.20% of the office furniture market in 2025 and is expected to lead expansion at a 7.20% CAGR through 2031.
Note: Market size and forecast figures in this report are generated using Mordor Intelligence’s proprietary estimation framework, updated with the latest available data and insights as of January 2026.
Global Office Furniture Market Trends and Insights
Drivers Impact Analysis*
| Driver | Impact on CAGR | Geographic Relevance | Impact Timeline |
|---|---|---|---|
| Co-Working Networks & Hybrid Work Models | +1.3% | Global, acceleration in Asia Pacific and selective North American metros | Medium term (2-4 years) |
| Rising Employment Rates Increasing Furniture Needs | +1.0% | Asia Pacific (India, China job creation) and North America (selective federal and corporate hiring) | Short term (≤ 2 years) |
| Commercial Real Estate Growth Driving Fit-Out Demand | +1.6% | Asia Pacific (India 65-70M sq ft in 2025) and Middle East (UAE, Saudi Arabia projects) | Medium term (2-4 years) |
| Growing Preference For Eco-Friendly Furniture Due to Sustainability & ESG Goals | +1.2% | Europe (ESPR by 2026), North America (corporate ESG mandates), and global enterprise accounts | Long term (≥ 4 years) |
| Focus on Workplace Ergonomics & Employee Wellness | +1.4% | Global, with premium adoption in North America and Europe and mass-market penetration in Asia Pacific | Medium term (2-4 years) |
| Digital Procurement Expanding Market Reach & Accessibility | +1.0% | Global, with highest growth in B2C and small to midsize business segments across regions | Short term (≤ 2 years) |
| Source: Mordor Intelligence | |||
Expansion of Co-Working Spaces And Hybrid Work Models
Hybrid work has stabilized headcount distributions across headquarters, regional hubs, and third spaces, so buyers favour flexible systems that mix density with privacy and can shift between team sessions and focused work. The office furniture market benefits as operators and employers configure more enclosed micro environments, standardized ergonomic seating fleets, and modular storage that can be redeployed across sites. Corporate portfolios now include memberships or satellite spaces to reduce commute friction, which spreads procurement beyond core CBDs into suburban nodes that value scalable logistics. Manufacturers are responding with localized showrooms and digital tools to enable specification at speed, as seen in MillerKnoll’s 2025 China showroom launch and a broader retail footprint strategy aimed at capturing hybrid-driven refresh cycles.[1]Source: MillerKnoll, “MillerKnoll Newsroom,” MillerKnoll News, news.millerknoll.com Product breadth is expanding to support multi-use rooms, adding mobile tables, stackable seating, and adaptable work booths, with acquisitions such as Okamura’s Boss Design purchase strengthening lounge and loose furniture lines used in flex environments.
Commercial Real Estate Expansion Increasing Office Fit-Out Requirements
New office stock and active renovation pipelines translate directly into orders for desks, seating, storage, and partitions, with the effect strongest in the Asia Pacific. India’s 2026 demand outlook builds off 2025 project momentum, where 65 to 70 million square feet of new office space was projected, and local leaders have committed fresh capital to ergonomic portfolios to serve that pipeline. Gulf programs in the UAE and Saudi Arabia are likewise boosting institutional procurement across government and education sectors, favouring durable, standards-compliant products specified in bulk. The office furniture market skews toward whole-site packages for these projects, rewarding suppliers that offer integrated lines across task seating, systems, and communal areas. International players are also partnering or acquiring to bolster regional fit-out positioning, widening developers' and facility managers' choices while keeping delivery lead times competitive.
Adoption of Sustainable And Eco-Friendly Furniture Aligned With ESG Objectives
Sustainability requirements have moved into core purchasing criteria, shaping product roadmaps, supplier selection, and award decisions for large accounts. The EU Deforestation Regulation, in force from 30 December 2024, obliges furniture suppliers to document that timber, leather, and rubber inputs do not contribute to forest loss.[2]Source: European Commission, “EU Regulation on Deforestation-Free Products,” europa.euLeading manufacturers commit to renewable electricity use, safer chemistry, and supplier carbon transparency to support enterprise ESG scorecards and public-sector bids. Closed-loop material recovery proves its value by lowering product footprints and ensuring end-of-life pathways, particularly for plastic-intensive seating programs. European buyers emphasize supplier readiness for traceability and environmental declarations, which encourages earlier investment in product passports, EPDs, and robust compliance documentation. The United States government procurement process reinforces compliance, origin, and transparency standards, favoring vendors with consistent documentation and domestic transformation capabilities. These shifts reward companies that design for recyclability, support take-back programs, and publish clear progress against greenhouse gas and materials goals.
Focus on Workplace Ergonomics and Employee Well-Being
Employers now treat ergonomics as a foundation of the employee experience and as a quantifiable lever for attendance and productivity. Sit-stand workstations and highly adjustable task chairs are now standard in many fit-outs, which raises expectations for durability and intuitive control design. Vendors are addressing practical adoption barriers with packaging that accelerates installation and with configurations that fit dense floor plates without sacrificing comfort. Product roadmaps increasingly combine ergonomics with technology integration for space analytics and asset management, pointing to smarter workspaces over the forecast. New multi-product launches focus on blending open collaboration with zones for focus and recovery, which demands a complete mix of seating, tables, and acoustic solutions in one plan. As wellness and safety requirements expand, the office furniture market rewards suppliers that validate performance through recognized standards and clear specifications.
Restraints Impact Analysis*
| Restraint | Impact on CAGR | Geographic Relevance | Impact Timeline |
|---|---|---|---|
| Corporate real-estate footprint consolidation reducing workstation density | -0.8% | Global, strongest in North America and Europe | Medium term (2-4 years) |
| Intense price competition and margin compression among mid-tier and regional manufacturers | -0.6% | Asia Pacific and price-sensitive emerging markets | Short term (≤ 2 years) |
| Macroeconomic uncertainty and high interest rates prompting deferral of office fit-out capital expenditure | -1.0% | Europe and North America | Short term (≤ 2 years) |
| Extended product replacement cycles driven by durable materials and refurbished furniture programs | -0.5% | Global, with early effects in markets embracing circular-economy practices | Long term (≥ 4 years) |
| Source: Mordor Intelligence | |||
Corporate Real-Estate Footprint Consolidation Reducing Workstation Density
As hybrid work policies gain traction, many large employers are reducing their overall floor space. This reduction directly translates to fewer workstations needing furnishing. Headquarters that previously accommodated every employee are now adjusting to plan for a peak occupancy of only 60-70%. This shift not only reduces bulk-order volumes but also extends replacement cycles. Facilities teams are now channeling budgets toward collaboration zones rather than individual desks, leading to a disparity in demand across product categories. Manufacturers focusing on task desks and basic chairs are facing the brunt of this volume risk. In contrast, those providing modular lounge systems are finding ways to mitigate some of these losses. Experts predict that this transitional phase will impact top-line growth for the next two to three years, until hybrid occupancy patterns find their footing.
Macroeconomic Uncertainty and High Interest Rates Prompting Deferral of Office Fit-Out Capital Expenditure
As borrowing costs rise and economic indicators fluctuate, CFOs are becoming increasingly cautious about committing to large capital projects, such as comprehensive office renovations. Instead of full-scale fit-outs, many organizations are opting for lighter refreshes or partial upgrades, which, in turn, delay their furniture orders. This financial conservatism is especially pronounced in sectors that are sensitive to consumer demand. In these areas, limited revenue visibility has resulted in longer approval cycles for workspace investments. Dealers have noted a trend in which some clients are shifting from planned purchases to rental agreements, a move aimed at preserving cash. While this shift reduces immediate revenue for manufacturers, it's anticipated that the trend of deferring spending will continue until interest rates dip and a more optimistic economic outlook emerges, thereby slowing market expansion in the near term.
*Our forecasts treat driver/restraint impacts as directional, not additive. The impact forecasts reflect baseline growth, mix effects, and variable interactions.
Segment Analysis
By Product: Chairs Command Premium as Ergonomics Drives Specifications
Chairs led the category with 31.40% market share in 2025 and are projected to grow at an 8.30% CAGR through 2031, reflecting employer focus on healthy posture, adjustability, and durability across task seating fleets. Task chairs remain the anchor of workplace setups, with specifications that emphasize lumbar support, arm adjustability, and reliable mechanisms that withstand daily use in hybrid attendance patterns. Wellness positioning drives investment-level purchases, and premium seating anchors upgrades in offices that are repositioning to attract employees back on site. Several vendors are advancing designs that blend ergonomic support with responsive movement and sensor-driven feedback for posture and comfort. Product roadmaps from leading brands introduce new task and guest seating that fit both open collaboration and enclosed focus rooms, supporting a balanced space-planning strategy in the office furniture market.
Tables and desking systems keep evolving toward mobility and power integration, with sit-stand platforms embedded as a standard rather than a niche option. Conference tables now require hidden power, cable management, and finishes that endure frequent cleaning without visible wear. Privacy solutions from phone booths to modular dividers are gaining share where teams add focus spaces to counteract open plan noise. Manufacturers highlight acoustic, privacy, and modular systems to reconfigure zones for team standups, client meetings, and solo work within the same footprint. New systems enable tool-less reconfiguration, which reduces facility downtime and labor costs during changeovers. Adoption of these formats supports a multi-year replacement cycle that aligns with hybrid work and the broader office furniture market.


By Material: Wood Dominates Yet Metal Outpaces in Modular Applications
Wood retained 45.20% of the office furniture market share in 2025 and remains the preferred finish in executive and client-facing spaces where warmth and visual quality influence selection. As the office furniture market scales, modular systems, wood veneers, and laminates complement metal structures to deliver both aesthetics and performance. Sustainability commitments are shaping wood sourcing, with certifications and renewable energy adoption integrated into corporate goals. Buyers in regulated sectors also request product-level disclosures and supplier transparency on material origins, elevating the bar for documentation in bids. Metal frames are accelerating at a 7.60% CAGR on the back of sit-stand desking, modular benching, and partition systems that must withstand frequent reconfiguration without service calls.
Metal-oriented platforms benefit from footprint rationalization and component standardization, which improve cost leverage and lead-time reliability. Tariff policy continues to affect imported metal costs and reinforces the value of nearshoring for North American deliveries. Companies that combine domestic transformation with cross-brand component strategies are better positioned to weather inbound price shocks. Circular material practices are also advancing, with closed-loop plastics and targeted disassembly designs reducing waste for seating and panels. These practices align with corporate reporting needs and the long-term direction of enterprise purchasing requirements.
By Price Range: Economy Dominates, Yet Premium Accelerates in Flagship Offices
Economy holds 48.30% in 2025 and remains the anchor for value-focused buyers. Demand comes from small and midsize businesses, government entities, and education systems that work within fixed budgets. Buyers prioritize functional durability, essential ergonomic adjustment, and finishes that withstand daily use. Standardized components and stocked finishes help compress lead times and reduce installation risk. Vendors that pair reliable warranties with local service keep the total cost of ownership predictable. Economy lines often serve as the base kit for phased expansions. They also accept incremental upgrades, such as monitor arms or privacy screens, as funds become available.
Mid-range bridges cost and capability for corporate rollouts that need sit-stand desking, higher-adjustability chairs, and modular storage. This tier emphasizes brand reliability, aesthetic consistency across floors, and dealer services that support reconfiguration. It captures the core of multi-site refresh programs that unite standards without premium pricing. Premium is the fastest-growing segment, with an 8.60% CAGR through 2031, as employers invest in flagship spaces and talent-focused amenities. Specifications include designer finishes, performance textiles, integrated power, and acoustic elements that elevate experience. Purchases often target executive suites, client areas, and hospitality-inspired lounges. Many programs phase in premium elements in select zones while retaining mid-range systems in focus areas.
By End-user: Corporate Offices Anchor Demand Yet Hospitality Accelerates
Corporate offices accounted for 41.80% in 2025 and remain the anchor of project-based demand, driven by white-collar concentration across technology, finance, and professional services. Large enterprises standardize on proven systems and dealer services that ensure consistent installation and after-sales support. Consolidation is reshaping account coverage and procurement scale, with one proposed combination set to create a supplier with broad penetration from small businesses to corporate headquarters. Healthcare is growing steadily on the back of administrative expansions and specialized cleanability requirements, which are driving targeted seating launches with antimicrobial and sealed-seam options.
Hospitality and retail back-office are the fastest-growing end-uses, with a 7.10% CAGR, as employers upgrade staff spaces for retention and training. These buyers favor durable yet comfortable task seating and lounge pieces that create a strong day-to-day experience for on-site teams. Government and public offices add stability with multi-year contract vehicles and technical requirements for origin and performance that shape supplier lists. Education continues to refresh administrative areas to support new technology and flexible work patterns. The office furniture market supports all of these use cases with broad lines that cover task, conference, lounge, storage, and privacy under shared aesthetics and components.
By Distribution Channel: B2B Dominance Persists Amid B2C Digital Surge
B2B direct-from-manufacturer channels accounted for 66.90% in 2025 and remain critical for project delivery, warranty, and reconfiguration support. Dealer networks provide local showrooms, project management, coordinated delivery, and service response that enterprise projects require. Integration and footprint optimization initiatives focus on rationalizing overlapping territories and aligning service levels to reduce cost and variability. These strengths keep B2B central to multi-floor projects, campus programs, and public-sector installations that need compliance documentation and consistent job-site execution. As hybrid work spreads decisions across more sites, B2B remains the default for large-scale execution in the office furniture market.
B2C retail and online channels are outpacing at a 7.90% CAGR, aided by better configurators, curated assortments, and quicker fulfillment for stock items. Retail expansion strategies place brand showrooms in growth metros and improve omnichannel service for higher-end residential and home office buyers. Digital tools and pre-assembled solutions reduce installation time and friction for smaller offices that buy direct. As consumer-style experiences enter business purchasing, more small enterprises will bypass traditional channels for simple projects while still relying on B2B for services and compliance. This dual-track evolution supports growth on both sides of the office furniture market.
Geography Analysis
Asia Pacific leads with 41.20% in 2025 and is projected to grow at a 7.20% CAGR through 2031, supported by active development and expanding service-sector employment. India’s pipeline of 65 to 70 million square feet of office space in 2025 points to significant demand for workstations and seating, and local producers are investing in capacity and digital tools to capitalize on this opportunity. Regional players are expanding product portfolios and distribution footprints to integrate loose furniture and architectural elements with core task seating strengths. Global brands are also expanding showrooms and partner networks to serve enterprise specifications and to align with localized tastes, as seen in new brand spaces in major Chinese cities. Together, these moves reinforce Asia’s role as both a demand center and a manufacturing hub for the office furniture market.
North America exhibits steady replacement cycles with a focus on modernizing layouts rather than adding raw square footage. Tariff policy increases the cost of metal-intensive components, which elevates the importance of regional manufacturing and multi-sourcing. Several companies are ramping up facilities in Mexico to reduce lead times, cut freight miles, and avoid specific duty exposure while maintaining North American service levels. Government accounts continue to prioritize compliant origin and performance standards, which influence vendor selection and project planning. Retail showrooms and direct channels are expanding to capture higher-margin sales from home-office and design-led buyers, complementing contract sales and strengthening brand visibility. These dynamics support a balanced outlook for the office furniture market.
Europe invests in flexible and sustainable designs while navigating energy and regulatory costs. Suppliers emphasize traceability, clean chemistry, and recyclability to align with public procurement and corporate ESG requirements. Product innovation cycles are active, with awards and showcases that emphasize craftsmanship, refined work booths, and lounge elements that support hybrid work styles. Across the wider EMEA region, sovereign-backed developments and diversified corporate expansions drive demand for compliant, globally recognized brands. Suppliers with regional showrooms and service partners are better placed to win projects that require rapid response and multi-country execution. As sustainability and flexibility become increasingly important, the office furniture market will continue to favor manufacturers that can document progress and supply at scale.

Competitive Landscape
Market structure is consolidating as scale becomes a decisive advantage in procurement, manufacturing, and channel coverage. One significant pending combination would create a pro forma USD 5.8 billion entity and is slated to deliver USD 120 million in annual run-rate cost synergies once integration matures, thereby repositioning competitors and dealers in North America. That strategy builds on prior M&A with synergy delivery supported by manufacturing network optimization and supplier consolidation programs. Nearshoring to Mexico complements that approach by reducing freight costs and cycle times while mitigating tariff exposure for metal-intensive lines. Together, these moves strengthen cost positions and delivery reliability across the office furniture market.
Sustainability leadership remains a competitive lever as companies scale renewable electricity use and material circularity across product lines. Another top player advanced a closed-loop plastics program in seating, delivering meaningful emissions reductions, and introduced design brands to expand premium options for hybrid-ready interiors.
Select regional champions are broadening portfolios and geographic reach through targeted acquisitions and awards-driven visibility. For instance, in March 2025, Okamura Corporation acquired all of Boss Design Limited's shares, a U.K.-based company.[3]Source: Okamura Corporation, “Notice of the Acquisition of Shares of BDL,” Okamura, okamura.com Founded in 1983, Boss Design Limited (BDL) is renowned for its high-quality, innovative office furniture designs. BDL's diverse offerings, from lounge seating and chairs to tables, work booths, and storage solutions, cater primarily to office and commercial spaces across the UK, Europe, and the United States. Installation efficiency remains a practical battleground, with pre-assembled and value-engineered solutions that shorten job-site times and lower total installed costs. Manufacturing technology partners report that turbulence in trade policy continues to push onshoring and nearshoring initiatives, which underscores the value of digitally integrated cutting and kitting for speed and waste reduction. Across these moves, the office furniture market rewards brands that execute with equal discipline on cost, compliance, sustainability, and service.
Office Furniture Industry Leaders
Haworth Inc.
HNI Corporation
Okamura Corporation
MillerKnoll Inc.
KOKUYO Co., Ltd.
- *Disclaimer: Major Players sorted in no particular order

Recent Industry Developments
- August 2025: HNI Corporation agreed to acquire Steelcase Inc. for USD 2.2 billion in a cash and stock transaction, with anticipated annual run rate cost synergies of USD 120 million and closing targeted by the end of 2025.
- December 2025: MillerKnoll debuted its first showroom in mainland China, consolidating its collective of brands to meet evolving workplace needs in Shanghai and to support Asia Pacific growth initiatives.
- April 2025: Godrej Interio allocated INR 55 crore (USD 6.6 million) to transform its B2B portfolio, with a focus on wellness-oriented chairs and height-adjustable desks aligned to India’s office pipeline and targeted growth through fiscal 2027.


Research Methodology Framework and Report Scope
Market Definitions and Key Coverage
Our study counts new freestanding office furniture, including chairs, desks, tables, storage, dividers, and soft seating, sold worldwide by manufacturers for commercial or home-office use. Values are captured at ex-factory level in constant 2024 US dollars.
We exclude used or refurbished items, decorative home pieces, and built-in millwork.
Segmentation Overview
- By Product
- Chairs
- Employee Chairs
- Meeting Chairs
- Guest Chairs
- Tables
- Conference Tables
- Desks
- Other Tables
- Storage Units
- Filing Cabinets
- Bookcases & Shelving
- Sofas/Soft Seating
- Booths and Office Dividers
- Other Office Furniture (Stools, Reception Area Furniture, Accessories, Others)
- Chairs
- By Material
- Wood
- Metal
- Plastic & Polymer
- Other Materials
- By Price Range
- Economy
- Mid-range
- Premium
- By End-user
- Corporate Offices
- Healthcare Offices
- Educational Institutions
- Government & Public Offices
- Hospitality & Retail Back-office
- Others
- By Distribution Channel
- B2C/Retail
- Home Centers
- Specialty Furniture Stores
- Online
- Other Distribution Channels
- B2B/Directly from Manufacturers
- B2C/Retail
- By Geography
- North America
- Canada
- United States
- Mexico
- South America
- Brazil
- Peru
- Chile
- Argentina
- Rest of South America
- Europe
- United Kingdom
- Germany
- France
- Spain
- Italy
- BENELUX (Belgium, Netherlands, and Luxembourg)
- NORDICS (Denmark, Finland, Iceland, Norway, and Sweden)
- Rest of Europe
- Aisa Pacific
- India
- China
- Japan
- Australia
- South Korea
- South East Asia (Singapore, Malaysia, Thailand, Indonesia, Vietnam, and Philippines)
- Rest of Asia Pacific
- Middle East And Africa
- United Arab of Emirates
- Saudi Arabia
- South Africa
- Nigeria
- Rest of Middle East And Africa
- North America
Detailed Research Methodology and Data Validation
Primary Research
Our team interviews factory managers, contract dealers, facility heads, and ergonomists in the Americas, Europe, Asia, and the Gulf. These talks validate average selling prices, sit-stand desk penetration rates, and refurb cycles, closing data gaps.
Desk Research
We start with open data such as UN Comtrade exports (HS 9401 and 9403), the BIFMA shipment bulletin, and the US Producer Price Index for office seating to benchmark trade flow and pricing. Company 10 K filings, investor decks, and reputable media then illuminate mix shifts across price tiers.
Analysts next tap D&B Hoovers for revenue splits, Dow Jones Factiva news feeds, and MarkLines when automotive tech hubs add seating labs. These sources illustrate demand spikes and regional gaps. The list above is illustrative only, and many other public and paid references support desk work.
Market-Sizing & Forecasting
We rebuild the 2025 baseline through a top-down production plus trade model, then test it against a bottom-up sample of supplier revenues and dealer channel checks and adjust for overlap. Key inputs include commercial real estate completions, global office vacancy, ergonomic chair penetration, plywood spot prices, and average refurbish intervals. A multivariate regression combined with scenario stress tests projects these drivers forward, and missing pieces are bridged by historic trade shares.
Data Validation & Update Cycle
Before release, Mordor analysts run variance dashboards, trace anomalies back to source, and obtain senior review. The model updates yearly, with interim refreshes after material events.
Why Mordor's Office Furniture Baseline Holds Firm
Published market figures differ because publishers vary product mix, inflation handling, and update cadence. Mordor tracks only new freestanding pieces and revises prices every year, whereas some others fold in built-ins, used sales, or list prices and at times roll a past CAGR forward, which explains the spread.
Taken together, we believe our disciplined scope definition and mixed method proofing deliver a balanced and transparent baseline that decision makers can rely on.
Benchmark comparison
| Market Size | Anonymized source | Primary gap driver |
|---|---|---|
| USD 78.1 B (2025) | Mordor Intelligence | - |
| USD 61.35 B (2025) | Global Consultancy A | Narrower product scope, limited primary checks |
| USD 101.46 B (2024) | Industry Study B | Includes built-ins and refurb sales, uses list prices |
| USD 58.19 B (2024) | Regional Consultancy C | Partial geography, CAGR roll forward without fresh validation |
Taken together, we believe our disciplined scope definition and mixed method proofing deliver a balanced and transparent baseline that decision makers can rely on.


Key Questions Answered in the Report
What is the office furniture market size and growth outlook to 2031?
The office furniture market size is USD 82.60 billion in 2026 and is projected to reach USD 116.80 billion by 2031 at a 7.15% CAGR.
Which category leads current demand within the office furniture market?
Chairs lead with 31.40% share in 2025 and are forecast to expand at an 8.30% CAGR through 2031, reflecting sustained focus on ergonomics and wellness.
Which distribution routes are expanding fastest in the office furniture market?
B2B remains the largest with 66.90% in 2025, while B2C is the fastest growing with a 7.90% CAGR as retail and online channels attract small businesses and home offices.
What region is expected to grow the fastest through 2031?
Asia Pacific holds the largest demand share and is projected to grow at a 7.20% CAGR through 2031, supported by new office stock and expanded vendor presence.
How are tariffs and regulations shaping pricing in the office furniture market?
Higher tariff rates on metals and selected furniture categories and stricter compliance rules in Europe and the United States are elevating input costs and administrative workloads for suppliers.
Which strategic moves stand out among leading brands?
Notable moves include HNI’s agreement to acquiredSteelcase for USD 2.2 billion to gain procurement synergies and MillerKnoll’s retail expansion and China showroom to deepen regional access.
Page last updated on:


