
Furniture Market Analysis by Mordor Intelligence
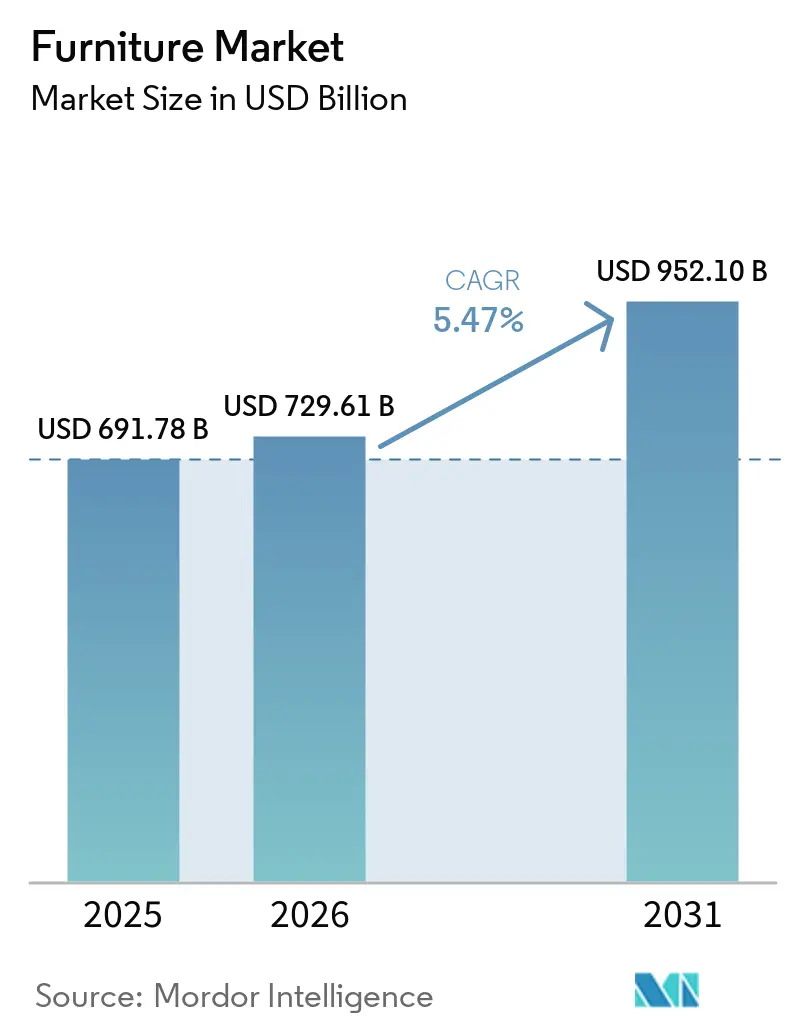
The furniture market size is expected to increase from USD 729.6 billion in 2026 to USD 769.5 billion in 2027 and reach USD 987.8 billion by 2032, growing at a CAGR of 5.12% over 2027-2032.
Affordability gives modular furniture a commercial role in serving housing needs in India and room redesign in established households. Connecting physical product experience with online conversion can help brands reach those buyers while retaining control over the customer-facing offer. Institutional procurement creates a parallel opening for suppliers able to combine furniture with repeatable delivery and product qualification. These responses put value on a coherent furnishing proposition and the operating capabilities needed to reproduce it. Export logistics and producer-responsibility costs then limit which orders can carry the full expense of serving a destination market.
Key Report Takeaways
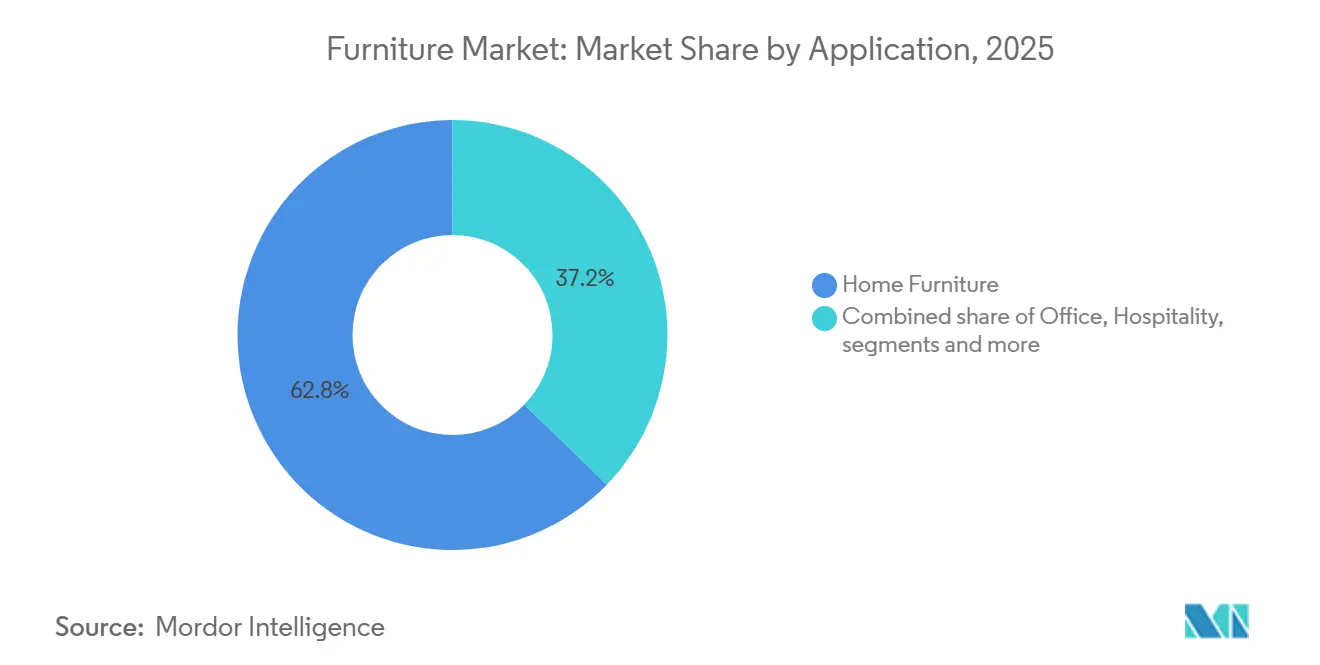
- By application, home furniture led with a 62.34% furniture market share in 2026, while office furniture is forecast to grow fastest at a CAGR of 7.02% over 2027-2032.
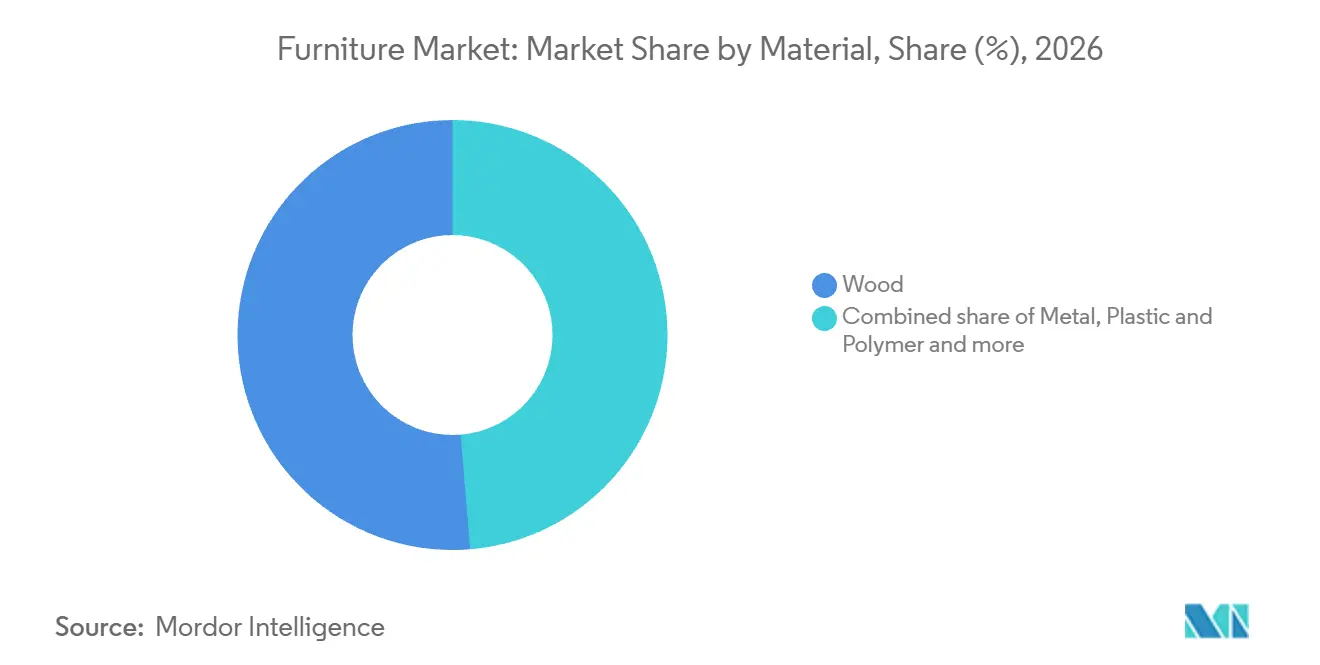
- Across materials, wood accounted for a 51.31% share of the furniture market size in 2026, and metal is projected to grow fastest at a CAGR of 7.38% over 2027-2032.
- Within price ranges, mid-range furniture held the largest share at 53.83% in 2026, with premium furniture forecast to grow fastest at a CAGR of 6.73% over 2027-2032.
- Distribution channels were led by B2C/retail with a 78.95% share in 2026, while B2B/project sales are expected to grow fastest at a CAGR of 7.89% over 2027-2032.
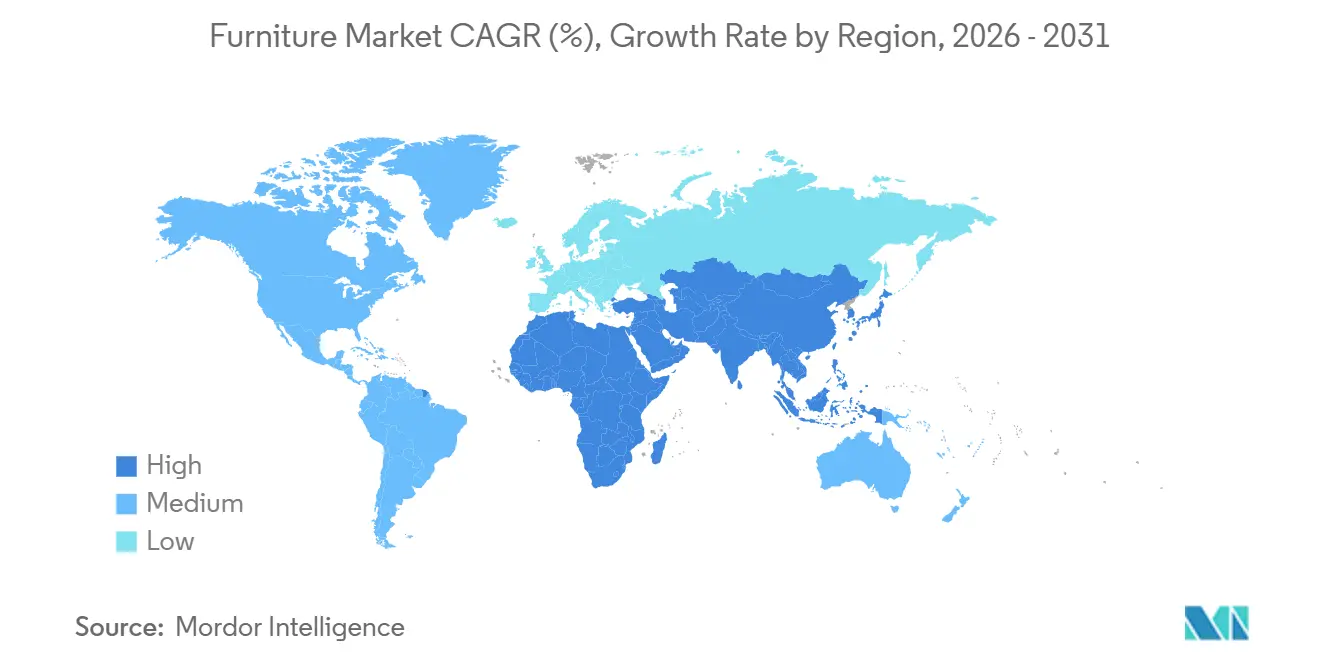
- Geographically, Aisa Pacific combined the largest share of 48.71% in 2026 with the fastest forecast CAGR of 7.19% over 2027-2032.
Note: Market numbers in this report are based on Mordor Intelligence's proprietary estimation framework, which combines nine months of actuals with Q4 projections for base year 2026.
Market Trends and Insights
Drivers Impact Analysis of Furniture Market*
| Driver | (~) % Impact on CAGR Forecast | Geographic Relevance | Impact Timeline |
|---|---|---|---|
| Home-Remodel Spend By Millennials Powering Multi-Functional Furniture Demand | +1.1% | United States of America | Medium term (2-4 years) |
| Rapid Urbanization Is Driving Space-Saving Modular Furniture Sales | +1.6% | Republic of India | Long term (≥ 4 years) |
| Expansion of Digital-First D2C Furniture Brands Boosting Online Penetration | +1.8% | India, Singapore and United Kingdom | Medium term (2-4 years) |
| Corporate ESG mandates spurring adoption of recycled & bio-based furniture materials | +0.95% | North America, Europe and Asia Pacific | Long term (≥ 4 years) |
| Remote and Hybrid Work Driving Home Office Furniture Demand | +0.8% | United States of America | Short term (≤ 2 years) |
| Rising Middle-Class Income Supporting Premium and Customized Furniture Purchases | +0.62% | United States of America | Medium term (2-4 years) |
| Source: Mordor Intelligence | |||
Home-Remodel Spend By Millennials Powering Multi-Functional Furniture Demand
Millennial participation in remodeling creates an opening for furniture suppliers when a renovation changes how an existing room must function. Among U.S. Houzz survey respondents who renovated, millennials accounted for 10% of renovating homeowners in 2025, up from 8% in 2024. That larger representation makes this cohort more relevant to offers that connect a room redesign with its eventual use. For multifunctional furniture, the commercial case depends on solving a specific conflict between activities within that redesigned space. A renovation-linked offer can therefore compete on how well the furniture resolves the room's intended functions within the completed layout.
Rapid Urbanization Is Driving Space-Saving Modular Furniture Sales
Urban household formation creates a furniture opportunity when more functions must fit within the available living space. The United Nations estimated that 58% of the world's population lived in urban areas in 2025 using national definitions. India separately approved 193,000 additional homes for eligible urban economically weaker section families in 11 states on October 16, 2026, under PMAY-U 2.0. For suppliers serving households when sanctioned homes are completed, a modular offer could start with a limited set of compatible units. The revenue opportunity would then extend from an initial furnishing package to later additions as the household's needs change.
Expansion of Digital-First D2C Furniture Brands Boosting Online Penetration
A digital-first furniture brand can extend its reach by coordinating online discovery with physical product experience. In India, Wakefit reported approximately 24% furniture-category growth in FY26, with that business operating primarily in cities where it had physical stores. Its website and company-operated stores together recorded 20.5% year-over-year revenue growth across home and furnishings in April-June 2026. Online channels generated 52.7% of company revenue that quarter across categories including mattresses, furniture and furnishings. Management described customers researching online before buying in stores and purchasing digitally after store visits. A store can therefore contribute to a digital furniture conversion even when it does not record the final sale.
Corporate ESG mandates spurring adoption of recycled & bio-based furniture materials
Sustainability requirements can influence furniture demand before a buyer selects a particular material or places an order. In its 2025 CDP questionnaire, Steelcase reported rising sustainability-related sales cases and more sustainability inquiries in customer requests for information and proposals. That procurement-stage interest gives suppliers a reason to make environmental attributes usable within a formal purchasing decision. Recycled and bio-based offers have a commercial opening when their documented attributes answer the requirement that the buyer is testing. Environmental documentation then becomes an eligibility feature of the furniture offer when the buyer makes it a condition of the proposal.
Restraints Impact Analysis of Furniture Market*
| Restraint | (~) % Impact on CAGR Forecast | Geographic Relevance | Impact Timeline |
|---|---|---|---|
| EU Extended Producer Responsibility (EPR) Rules Raising Compliance Costs For Exporters | -0.6% | France and other EU countries | Long term (≥ 4 years) |
| High Cross-Border Logistics Costs & Damage Risks Curbing Bulky E-Commerce Furniture Margins | -0.5% | Vietnam and United States | Medium term (2-4 years) |
| Volatility in raw material prices is increasing manufacturing costs | -0.25% | North America, Europe and Asia Pacific | Short term (≤ 2 years) |
| Trade tariffs and import duties limit cross-border market access | -0.4% | United States of America | Short term (≤ 2 years) |
| Source: Mordor Intelligence | |||
EU Extended Producer Responsibility (EPR) Rules Raising Compliance Costs For Exporters
Producer responsibility adds a market-entry cost that furniture exporters must accommodate alongside manufacturing and delivery. In France, furniture producers using a producer responsibility organization pay a product-linked EPR fee to finance obligations including end-of-life waste management. EU packaging EPR separately requires obligated businesses placing packaged goods on the market to help fund packaging collection and recycling. Small-producer relief depends on applicable conditions and national rules, so eligibility must be established for the particular business. The commercial constraint is the added obligation attached to placing goods on the destination market, which narrows the proceeds available from each compliant sale.
High Cross-Border Logistics Costs & Damage Risks Curbing Bulky E-Commerce Furniture Margins
Bulky furniture creates an export hurdle because protecting the product and holding it near customers both consume resources before delivery. In a 2025 Access Partnership survey of 150 Vietnamese micro, small and medium-sized furniture enterprises engaged in e-commerce, 94% cited cross-border logistics costs as their primary export constraint.[1] The report identified destination warehousing, storage, fulfillment and protective packaging as pressures, including high warehouse occupancy costs in the United States. For a small exporter, an attractive selling price must therefore cover a destination-side operation as well as international transport. This limits the scope for low-value bulky orders whose remaining proceeds cannot absorb those handling and storage requirements.
*Our forecasts treat driver/restraint impacts as directional, not additive. The impact forecasts reflect baseline growth, mix effects, and variable interactions.
Furniture Market Segment Analysis
By Application:
Household Scale and Workplace Order MomentumHome furniture accounted for a 62.34% share of the furniture market size in 2026. The largest segment has a substantial retail spending base, illustrated by Ashley Store's estimated U.S. furniture-and-bedding sales of USD 6.26 billion in 2025. Ashley Store's network includes company-owned and dealer-owned retail locations. For manufacturers, this structure makes consistent product execution across outlets with different operators relevant to accessing household demand. A manufacturer can therefore pursue that retail reach through a common furniture range without having to replicate the retailer's entire store network.
Office furniture is the fastest-growing segment, with a forecast CAGR of 7.02% over 2027-2032. HNI Corporation reported 5% organic year-over-year order growth in its Workplace Furnishings segment in Q2 2026. Growth rates from small-to-medium-sized and contract customers were comparable, giving the reported order momentum more than one buyer source. For workplace suppliers, this breadth makes offers suited to smaller employers relevant alongside those designed for contract accounts. A supplier focused only on major contract accounts would address just one part of the buyer breadth visible in the reported order increase.

By Material:
Fiber Scale and Hybrid ConstructionWood represented a 51.31% furniture market share in 2026. For this largest segment, Inter IKEA Group reported that manufacturing IKEA products used 14.7 million cubic meters of wood and paper in round wood equivalent in FY25. That combined material requirement illustrates the program scale at which fiber availability becomes relevant to finished furniture production. Wood-based ranges connect product manufacturing with material sourcing decisions well before the final furniture reaches a retailer. Securing a suitable fiber stream becomes part of maintaining a wood-based range across successive production runs.
Metal is the fastest-growing segment, with a forecast CAGR of 7.38% over 2027-2032. In its 2025 annual report, Siam Steel International described increasing demand in Thailand for hybrid products combining wood and steel, citing their strength and durability. Such construction allows metal and wood to contribute to the same furniture piece's performance. For suppliers, that creates a design opportunity around the contribution of the metal component to the finished item. The growth case can therefore include a greater structural role for metal within furniture that also preserves the characteristics of another material.
By Price Range:
Mid-Range Breadth and Premium IntegrationMid-range furniture was the largest segment, with a 53.83% share in 2026. Adairs described its Australian Focus on Furniture business as having a mid-market product offering in its February 2025 results presentation. The retailer subsequently recorded 1.9% sales growth in 1H FY26 compared with 1H FY25, providing a later operating result for the same Australian business. For suppliers serving this price point, each additional product feature needs a revenue justification within the intended selling position, making selective differentiation central to a scalable mid-range offer.
Premium furniture is the fastest-growing segment, with a forecast CAGR of 6.73% over 2027-2032. Arhaus reported 2025 company-wide home furnishings net revenue of USD 1.38 billion, up 8.5% from 2024.[2] The premium brand operates a vertically integrated furniture and décor business, placing the reported result within a broader furnishing proposition. For an operator with that model, coordination across the range can support a consistent offer across individual furniture pieces and complementary décor. The premium opportunity is therefore tied to the completeness of that proposition as well as to the price of an individual item.
By Distribution Channel:
Retail Reach and Institutional AccessB2C/Retail was the largest segment, with a 78.95% share in 2026. Inter IKEA Group reported that customers across IKEA's worldwide retail system increased 3% in FY25, with the system covering products, food and services. The company said price reductions over the preceding 2 years contributed to that increase, connecting accessibility with its expanding customer base. This gives consumer-facing suppliers a commercial reason to assess the combined reach and price proposition of their retail route. A large retail system can turn broader customer access into an opportunity for furniture suppliers, provided the offer fits the accessibility that draws those customers.
B2B /Project is the fastest-growing segment, with a forecast CAGR of 7.89% over 2027-2032. In March 2025, the University of Essex awarded a 5-lot furniture and related-services framework open to public-sector bodies throughout the United Kingdom. Eligible buyers included NHS bodies, local authorities and educational establishments, with office, classroom and specialist furniture among the framework categories. The award established a procurement route, while supplier business depended on buyers placing orders under the arrangement. For project suppliers, the advantage is the ability to adapt a common procurement route to several institutional settings, making buyer coverage valuable only when supported by the relevant furniture capability.
Geography Analysis
Aisa Pacific Furniture Market
Aisa Pacific accounted for a 48.71% furniture market share in 2026 and is the fastest-growing region, with a forecast CAGR of 7.19% over 2027-2032. China's above-designated-size furniture retail sales value grew 14.6% in 2025, providing a country-specific demand signal within the region. China's 2025 home-renovation refresh policy included furniture and lighting among its principal subsidy categories, with local governments choosing eligible products and limits. For suppliers, that local discretion made product eligibility a local commercial question within the national framework. A national furniture range could therefore face different subsidy eligibility across local sales channels.
North America and South America connect through a trade channel in which Brazil supplies finished furniture and mattresses to overseas buyers. Brazil exported USD 769.3 million in those products in 2025, and the United States was its main destination even as its proportion of those shipments fell. For Brazilian exporters, this relationship makes access to U.S. buyers important to the commercial use of existing export capabilities. Deeper U.S. customer coverage and diversification into other destinations are therefore separate growth decisions for Brazilian exporters within the same finished-furniture and mattress business.
Europe combines established export channels with uneven trading conditions, illustrated by a 5.5% decline in Belgian furniture exports, including transit trade, in 2025. Portugal's furniture sector supplied another European export base, recording EUR 1.42 billion (USD 1.6 billion) in exports that year. In the Middle East And Africa region, Saudi municipal procurement provides a different furniture route through institutional projects. Waja Company announced a 3-year office-furniture supply and installation framework awarded by Holy Capital Municipality on September 9, 2025, with final value dependent on separate purchase orders. These examples make the distinction between export exposure and institutional access commercially consequential, since an award creates a route to orders while an exporter must continually secure destination demand.
Regulatory Framework and Outlook
The comparison covers selected jurisdictions from the perspective of international furniture suppliers seeking sales in the covered product categories. Safety, harmful-substance, producer-responsibility and local-content requirements create different commitments for qualification and market participation. For these suppliers, a defined qualification route supports entry, while recurring obligations and restrictions on import-led offers reduce policy attractiveness.
Regulatory Table of Furniture Market
| Decision factor | United States | Brazil | France | China | South Africa |
|---|---|---|---|---|---|
| Primary authority | Consumer Product Safety Commission | Inmetro | ADEME's REP Supervision Directorate | Ministry of Industry and Information Technology, competent and lead department | Department of Trade, Industry and Competition for industrial-procurement designations |
| Key instruments or direction | 16 CFR part 1261 and ASTM F2057-23 for covered clothing-storage units | Inmetro Ordinance 143/2021 for infant cribs | Furniture EPR and scheduled collection targets | GB 18584-2024, effective July 1, 2025, for harmful substances in furniture | Designated office-furniture procurement threshold; broader draft procurement regulations published April 2026 |
| Commercial effect | Covered storage units manufactured after September 1, 2023, must meet the incorporated standard | Technical-quality and product-certification requirements for infant cribs | Product-linked contributions when joining an approved eco-organization | Material selection must satisfy mandatory substance limits | Minimum 85% local content in designated public office-furniture procurement |
| Current policy attractiveness | Medium | Medium | Low | Medium | Low |
| Future direction of policy attractiveness | No change | No change | Hardening | No change | No change |
| Source: Mordor Intelligence | |||||
Continuity in the United States rests on the existing storage-unit standard and CPSC's January 2026 information-collection renewal request, which did not amend the safety requirements. Brazil's crib-certification route and China's mandatory furniture substance limits establish product-qualification commitments, supporting medium ratings and continuity around the operative requirements. France's lower attractiveness reflects recurring producer obligations, while scheduled higher collection targets for furniture eco-organizations in 2028 support a hardening direction. South Africa's low rating reflects its 85% local-content threshold for designated public office-furniture bids, with the April 2026 draft reforms addressing the broader procurement framework.
Value Chain Stages
The comparison follows component supply, furniture manufacturing and wholesale distribution to show where suppliers earn revenue and where continuity can fail. Inter IKEA Group's FY25 operating model assigned these activities to IKEA Components, IKEA Industry and IKEA Supply AG, respectively.[3] Separating the stages makes an important commercial distinction between producing an assembly-ready part, converting materials into furniture and supplying finished products to retailers. An integrated group can coordinate those activities, but each stage requires its own response to disruption.
Value Chain Analysis Table of Furniture Market
| Primary activity | Key participants | Value capture | Bottleneck | Resilience response |
|---|---|---|---|---|
| Component development and supply | Furniture component suppliers such as IKEA Components | Component supply revenue | Consistent fit of assembly parts | Standardize specifications and qualify alternative part sources |
| Furniture manufacturing | Furniture manufacturers such as IKEA Industry | Manufactured furniture sales | Continuity of wood and component inputs | Qualify substitute inputs before production interruptions |
| Wholesale sourcing and distribution | Furniture wholesalers such as IKEA Supply AG | Finished-product wholesale sales | Coordination between suppliers and franchisee requirements | Maintain alternative supply routes and align replenishment with production |
| Source: Mordor Intelligence | ||||
Upstream supply security can influence how much value remains available to manufacturers and wholesalers when inputs become difficult to obtain. During FY25, Inter IKEA Group signed an agreement to acquire 8,000 hectares of forestland in Latvia to secure a long-term supply of responsibly managed wood. That sourcing commitment illustrates why resilience can require action before finished furniture reaches a distribution network. For this operating model, a wider distribution reach depends on upstream materials and assembly components meeting the same production requirements across alternative sources.
Competitive Landscape
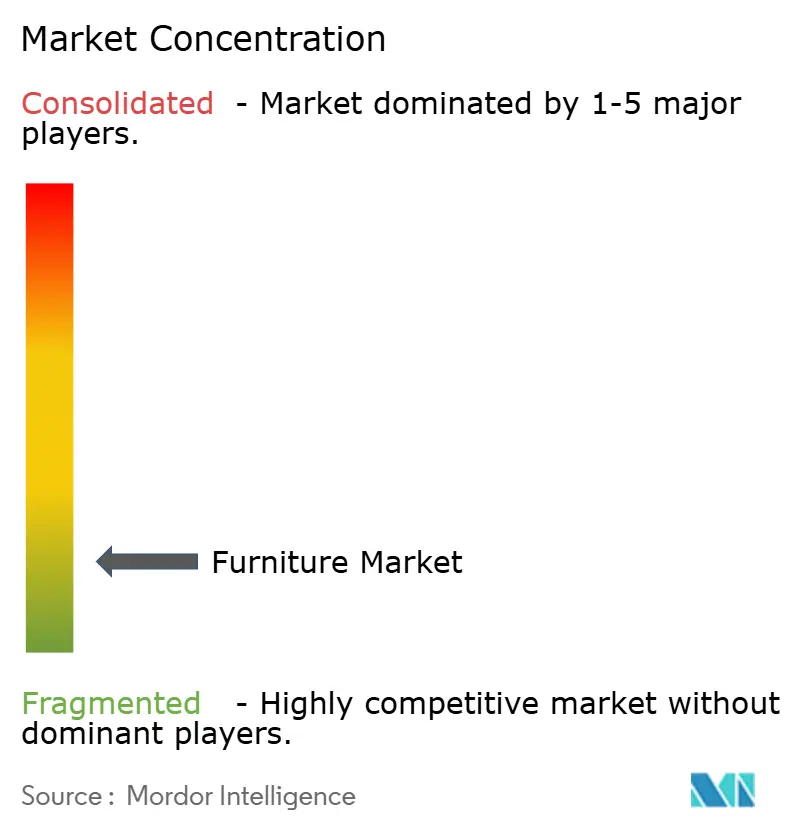
A fragmented competitive field spans manufacturing, retail and workplace projects, with Ashley Furniture Industries LLC manufacturing home furnishings separately from Ashley Global Retail's retail operation. Steelcase Inc. came under HNI Corporation's ownership when HNI completed its acquisition on December 10, 2025. IKEA operates through a worldwide retail system encompassing 13 franchisee groups, providing a different route to consumer demand. MillerKnoll, Inc. participates through brands including Herman Miller, Knoll and NaughtOne, while Williams-Sonoma Inc. competes through its home-furnishings brand portfolio. This diversified structure combines group-level scale with different routes to household and institutional buyers, alongside consolidation within the workplace business.
An operating footprint that connects production with customer access offers design-led furniture brands a way to make their product proposition more tangible. MillerKnoll brand NaughtOne opened a 33,000-square-foot factory in Yorkshire, United Kingdom, on September 30, 2026, combining furniture production, warehousing and customer experience. Co-location can bring the presentation of the finished offer closer to the operations that make and hold it, creating a point of comparison beyond the design of an individual item. A challenger could match the furniture design while still needing a separate solution for physical product demonstration and manufacturing coordination.
Competitive direction also depends on how suppliers balance accessibility with the value of a differentiated brand portfolio. IKEA reported that worldwide retail-system sales, including products, food and services, fell 1% in FY25 while volumes rose 2.6%, following lower prices introduced in FY24. Williams-Sonoma Inc. reported 3.5% comparable brand revenue growth across its portfolio in fiscal 2025, which ended February 1, 2026. For regulated or specification-led purchases, a competitive offer would also need to incorporate the product documentation required by the intended buyer. A low-price strategy must earn its return from the additional activity it creates, while a differentiated portfolio has to defend the value of the offer.
Furniture Industry Leaders
-
Ashley Furniture Industries LLC
-
Steelcase Inc.
-
IKEA
-
MillerKnoll, Inc.
-
Williams-Sonoma Inc.
- *Disclaimer: Major Players sorted in no particular order
Furniture Market Companies Covered in this Report
- IKEA
- Ashley Furniture Industries LLC
- Steelcase Inc.
- MillerKnoll, Inc.
- HNI Corporation
- Williams-Sonoma Inc.
- La-Z-Boy Incorporated
- Hooker Furnishings Corp.
- Kimball International Inc.
- Haworth Inc.
- Wayfair LLC
- Interio by Godrej
- Durian Industries Ltd.
- Foshan Huasheng Furniture
- KOKUYO Co. Ltd.
- Shanghai UE Furniture
- Leggett & Platt Inc.
- Okamura Corporation
- Nitori Holdings Co. Ltd.
- KUKA Home
Key Opportunities for Market Participants
The opportunities compare ways furniture suppliers can serve aggregated public demand through product standardization, delivery capability and continuity of supply. On September 14, 2026, Singapore's Ministry of Education published a whole-of-government furniture supply and delivery procurement, which GeBIZ marked pending award. The notice described 2 firm years with an option to extend for 2 years. That structure creates several commercial decisions around the furniture offer without guaranteeing orders to any supplier.
Market Opportunities Table of Furniture Market
| Opportunity | Why now | Buyer / lead segment | Recommended play | Main barrier | Likely beneficiaries |
|---|---|---|---|---|---|
| Standardized office furniture packages | Aggregated government furniture procurement | Government office buyers / office furniture | Offer repeatable configurations for comparable workplace needs | Meeting varied user requirements within a standardized offer | Furniture manufacturers able to support consistent specifications |
| Furniture supply with coordinated delivery | Delivery forms part of the procurement scope | Public bodies / B2B projects | Combine furniture supply with scheduled destination delivery | Coordinating product readiness and delivery commitments | Furniture suppliers with local distribution capability |
| Product continuity across successive purchases | Firm term plus a conditional extension | Government institutions / repeat furniture purchasing | Maintain compatible configurations and replacement options over the contract term | Preserving specifications when components change | Furniture suppliers with stable component and production arrangements |
| Source: Mordor Intelligence | |||||
The central opening is to make an institutional furniture offer repeatable across both products and deliveries. Standardization can support repeat purchases, while a coordinated delivery proposition addresses a different part of the same buyer requirement. A supplier pursuing the potential extension would also need to preserve continuity without treating the optional years as committed revenue. The strongest position therefore combines an initial furniture offer with a credible way to reproduce it throughout the firm term.
Recent Industry Developments in Furniture Market
- Sep 2026: NaughtOne opened a factory in Yorkshire, United Kingdom, bringing furniture production, warehousing and customer experience together in a 33,000-square-foot building.
- Aug 2026: IKEA launched KOMPISHÄNG, a portable furniture and accessories collection available online and in stores in most markets.
- May 2026: IKEA launched its 44-piece IKEA PS 2026 collection globally in stores and online on May 14, including furniture alongside lighting, textiles and other home products.
Furniture Market Report Scope and Research Methodology
Market Definition and Coverage
Global furniture market measures the annual value of new furniture sold worldwide by manufacturers and branded assemblers to initial purchasers, at ex-factory prices in constant 2025 USD. It covers furniture for household, office, hospitality and institutional use across material, price, retail and project classifications. Installation and after-sales maintenance count only when bundled in the product price.
Scope exclusions: Repurposed or second-hand furniture, in-built fixtures, purely decorative accessories, and installation and after-sales maintenance sold separately are excluded.
Segments Covered in This Report
- By Application
- Home Furniture
- Chairs
- Tables (side tables, coffee tables, dressing tables, etc.)
- Beds
- Wardrobes
- Sofas
- Dining Tables/Dining Sets
- Kitchen Cabinets
- Other Home Furniture (bathroom furniture, outdoor furniture, etc.)
- Office Furniture
- Chairs
- Tables
- Storage Cabinets
- Desks
- Sofas and Other Soft Seating
- Other Office Furniture
- Hospitality Furniture
- Educational Furniture
- Healthcare Furniture
- Other Applications (public places, retail malls, government offices, etc.)
- Home Furniture
- By Material
- Wood
- Metal
- Plastic & Polymer
- Other Materials
- By Price Range
- Economy
- Mid-Range
- Premium
- By Distribution Channel
- B2C/Retail
- Home Centers
- Specialty Furniture Stores
- Online
- Other Distribution Channels
- B2B /Project
- B2C/Retail
- By Geography
- North America
- Canada
- United States
- Mexico
- South America
- Brazil
- Peru
- Chile
- Argentina
- Rest of South America
- Europe
- United Kingdom
- Germany
- France
- Spain
- Italy
- BENELUX (Belgium, Netherlands, and Luxembourg)
- Sweden
- NORDICS (Denmark, Finland, Iceland, Norway, and Sweden)
- Rest of Europe
- Aisa Pacific
- India
- China
- Japan
- Australia
- South Korea
- South East Asia (Singapore, Malaysia, Thailand, Indonesia, Vietnam, and Philippines)
- Rest of Asia-Pacific
- Middle East And Africa
- United Arab of Emirates
- Saudi Arabia
- South Africa
- Nigeria
- Rest of Middle East And Africa
- North America
Data Sources, Market Sizing, and Validation
Desk Research
The analyst uses sources such as the U.S. Census Bureau's furniture and home furnishings store sales series to track retail demand, Eurostat's Prodcom statistics to compare the value and volume of production sold, and the World Bank's World Integrated Trade Solution data to examine furniture trade by product and country. Eurostat's NACE classification helps distinguish furniture manufacturing from adjacent activities, while official national statistical releases and relevant trade associations add country context.
Company filings, annual reports, investor presentations and reputable business press help check company-level demand, prices, capacity and channel developments against those industry indicators. The selected sources are illustrative and not exhaustive, and further sources inform collection, validation and clarification.
Primary Interviews and Surveys
Interviews and structured surveys may include furniture manufacturers and branded assemblers, retailers and distributors, institutional procurement specialists, and industry or market experts across APAC, EMEA and the Americas. Respondents can check secondary findings on first-sale pricing, product coverage, material and application demand, channel mix and regional conditions, while conflicting accounts are tested against independent company and public data. Where evidence does not support a precise value, the analyst records the gap, uses a range or scenario for the affected input, and triangulates the resulting estimate before carrying it into the market model.
Distribution of primary research fieldwork respondents
| Company type | Respondent position | Region |
|---|---|---|
| Top tier: 34% | CXOs: 20% | APAC: 39% |
| Mid tier: 43% | Functional/Unit leaders: 35% | EMEA: 33% |
| Smaller Players: 23% | Managers: 45% | Americas: 28% |
Market-Sizing & Forecasting
A top-down market model sets global annual ex-factory sales value, and supplier revenue roll-ups, channel checks and sampled selling price times unit volume then test selected totals. Historical production and retail series, furniture trade flows, housing and commercial construction activity, input costs and reported company sales inform the relevant growth and mix assumptions. Segment shares are built from published product and material classifications, company and retailer disclosures, procurement evidence and regional sales patterns, then reconciled within application, material, price range, channel and geography. A multivariate regression can relate historical market movement to construction, retail and cost indicators where the series are consistent, while scenario analysis adjusts the outlook when trade policy, affordability or institutional projects alter those relationships. Primary industry experts can challenge variable choices, timing and direction at segment level, and material data gaps are handled with documented ranges and sensitivity checks. Selective bottom-up checks use only available supplier, price and volume evidence and are not treated as a complete market build.
Data Validation & Update Cycle
Analysts triangulate the market model against independent production, trade, retail and company signals, then investigate anomalies and material variances from historical trends or adjacent indicators before sign-off. A second review checks definitions, units, years, arithmetic and segment reconciliation, with targeted respondent re-contact when conflicting evidence or a changed product or channel practice could affect an estimate. The model is refreshed annually, revisited between cycles after material events such as tariffs or major demand shocks, and given a fresh pre-delivery review.
Mordor Intelligence's Furniture Market Size Versus Other Published Estimates
Published estimates can differ in the transactions and products they count and the inputs used to model demand. It covers furniture for household, office, hospitality and institutional use across material, price, retail and project classifications.
Key Gap Drivers include the study's defined coverage and market-specific modeling choices. A multivariate regression can relate historical market movement to construction, retail and cost indicators where the series are consistent, while scenario analysis adjusts the outlook when trade policy, affordability or institutional projects alter those relationships.
Benchmark comparison
| Source | Market Size | Gaps in Research Methodology |
|---|---|---|
| Mordor Intelligence | USD 769.5 B (2027) | |
| Global Consultancy A | USD 833.94 B (2026) | At its 2026 base, this estimate is 8.4% above this report's 2027 value of USD 769.5 B, 1 year later. The broader household product definition includes mattresses and blinds alongside furniture, which can raise the total. |
| Industry Publisher B | USD 657.08 B (2025) | At its 2025 base, this estimate is 14.6% below this report's 2027 value of USD 769.5 B, 2 years later. Its earlier base year and published forecast path place the starting estimate below the later-year comparison. |
Mordor Intelligence's analysts triangulate the market model against independent production, trade, retail and company signals, then investigate anomalies and material variances from historical trends or adjacent indicators before sign-off.
Key Questions Answered in the Report
What is the furniture market size and growth outlook?
The size is projected at USD 769.5 billion in 2027 and USD 987.8 billion by 2032, with a CAGR of 5.12% over 2027-2032.
Which forces influence household furniture demand?
India's October 2026 housing approvals for eligible urban economically weaker section families and U.S. millennial renovation activity create potential furnishing occasions. Wakefit illustrates access through online and physical channels.
Which furniture application has the largest share?
Home furniture held the largest application share at 62.34% in 2026.
Which companies compete in the furniture industry?
Major participants include Ashley Furniture Industries LLC, HNI Corporation with Steelcase Inc., IKEA, MillerKnoll, Inc. and Williams-Sonoma Inc., spanning home and workplace furnishings.
What is a major challenge for online furniture exporters?
In a 2025 survey, 94% of Vietnamese micro, small and medium-sized furniture enterprises engaged in e-commerce cited cross-border logistics costs as their primary export constraint.
Which region leads the furniture sector?
Aisa Pacific held a 48.71% share in 2026 and has the fastest forecast CAGR of 7.19% over 2027-2032.