United States Refrigerated Trucking Market Size and Share
Market Overview
| Study Period | 2020 - 2031 |
|---|---|
| Forecast Data Period | 2026 - 2031 |
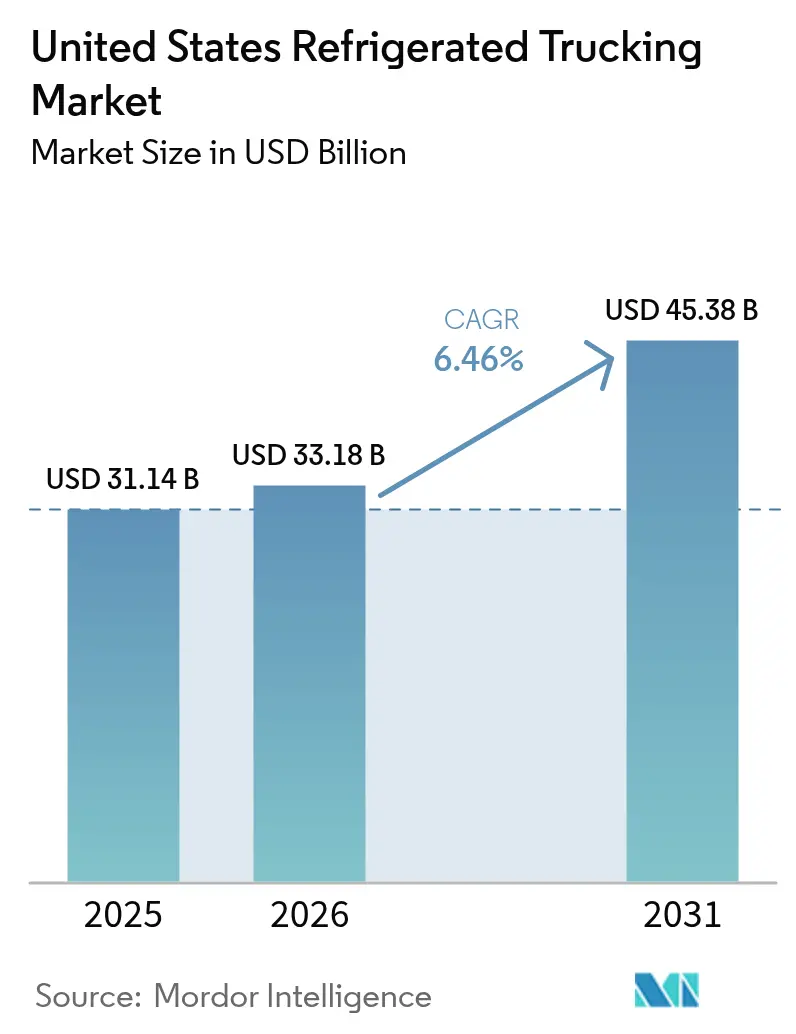
| Base Year Market Size (2025) | USD 31.14 Billion |
| Market Size (2026) | USD 33.18 Billion |
| Market Size (2031) | USD 45.38 Billion |
| Growth Rate (2026 - 2031) | 6.46% CAGR |
| Market Concentration | Low |
Major Players *Disclaimer: Major Players sorted in no particular order Image © Mordor Intelligence. Reuse requires attribution under CC BY 4.0. | |
United States Refrigerated Trucking Market Analysis by Mordor Intelligence
The United States refrigerated trucking market size was valued at USD 31.14 billion in 2025 and estimated to grow from USD 33.18 billion in 2026 to reach USD 45.38 billion by 2031, at a CAGR of 6.5% during the forecast period from 2026 to 2031. Demand in 2026 reflects a structural shift toward technology-enabled, compliance-focused operations as FSMA 204 traceability requirements push carriers to standardize digital temperature and event records across the food supply chain. The United States refrigerated trucking market is also receiving a steady lift from biopharmaceutical distribution as a growing share of high-revenue therapies requires cold storage and rigorous documentation from pickup to delivery. The restaurant and foodservice sector remains a powerful demand anchor in 2026, with industry sales expected to reach USD 1.55 trillion, which sustains frequent temperature-controlled replenishment across urban corridors and last-mile cold hubs. Capacity additions in cold storage are compressing average distribution distances, which increases the role of short-haul and LTL configurations while reinforcing the importance of containerized flows through ports and border crossings supported by USDA pre-clearance facilities. The regulatory environment in 2026 continues to demand investment in telematics and emissions compliance, while phased enforcement and evolving state rules shape fleet upgrade timing and equipment strategy, a balance that favors carriers with disciplined capital planning and diversified lane portfolios.
Key Report Takeaways
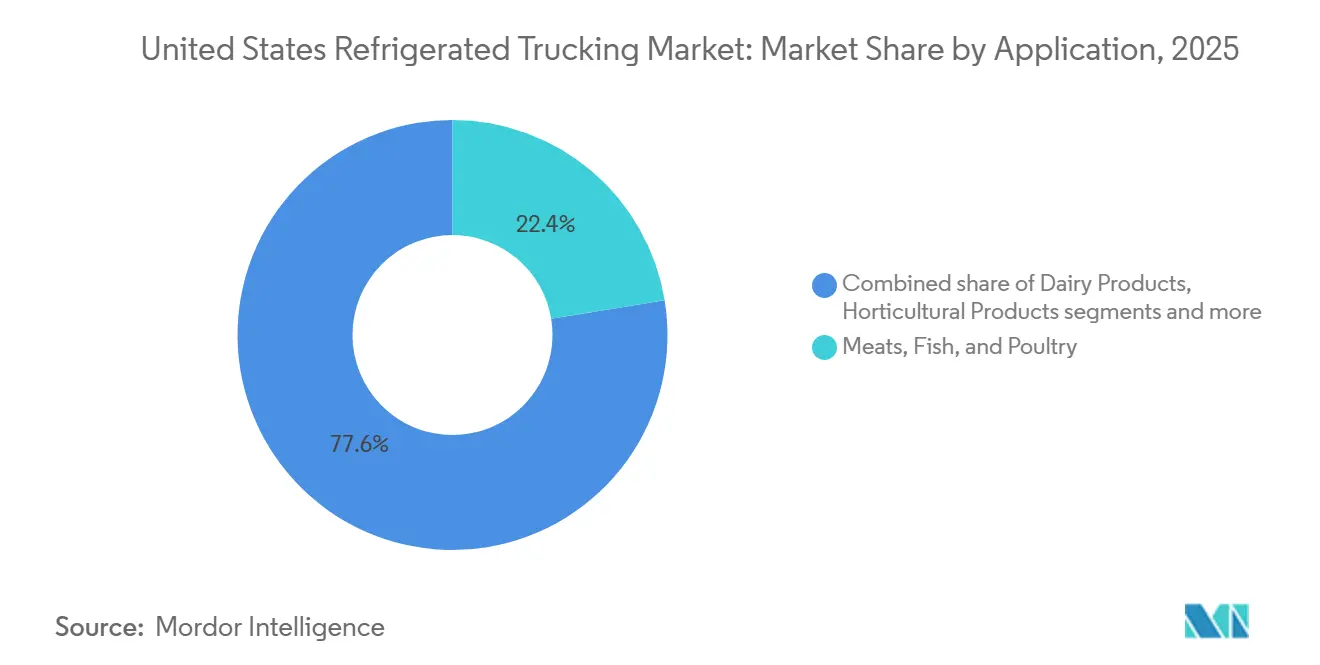
- By application, within the United States refrigerated trucking market share, meats, fish, and poultry held a 22.41% share in 2025, while processed foods are forecast to expand at a 7.1% CAGR during 2026 to 2031.
- By Truckload Specification Full-truckload captured 68.74% of the United States refrigerated trucking market size in 2025, while less-than-truckload is projected to grow at a 6.9% CAGR through 2026-2031.
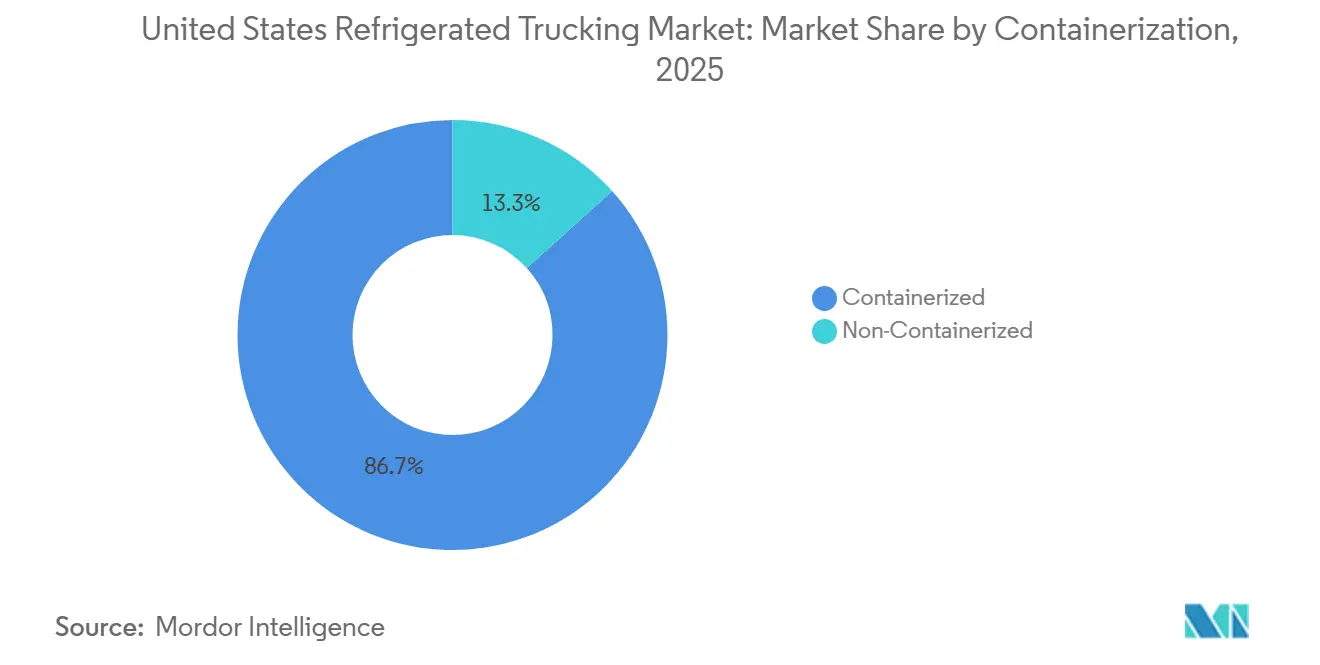
- By containerization, containerized shipments led with an 86.68% share in 2025 and recorded the highest projected CAGR at 6.7% through 2026-2031.
- By distance, long-haul accounted for a 72.43% share in 2025 and is advancing at a 6.8% CAGR through 2026-2031.
- By goods configuration, solid goods represented a 71.84% share in 2025, and fluid goods are set to expand at a 6.8% CAGR through 2026-2031.
- By destination, domestic shipments accounted for a 64.87% share in 2025, and international lanes are projected to grow at a 6.9% CAGR during 2026-2031.
- By temperature type, chilled freight held a 56.14% share in 2025, while frozen freight is projected to post a 7.2% CAGR through 2026-2031.
Note: Market size and forecast figures in this report are generated using Mordor Intelligence’s proprietary estimation framework, updated with the latest available data and insights as of 2026.
United States Refrigerated Trucking Market Trends and Insights
Drivers Impact Analysis*
| Driver | (~) % Impact on CAGR Forecast | Geographic Relevance | Impact Timeline |
|---|---|---|---|
| Expansion of temperature-controlled warehouse networks | +1.2% | National, with early gains in Kansas City, Dallas–Fort Worth, Atlanta metro clusters | Short term (≤ 2 years) |
| Growing consumer demand for organic and fresh produce year-round | +0.9% | National, strongest in Northeast and West Coast metros | Medium term (2-4 years) |
| Biopharmaceutical manufacturing growth | +1.1% | North Carolina, Georgia biotech corridors, spill-over to Mid-Atlantic hubs | Medium term (2-4 years) |
| Federal infrastructure investments improving corridor connectivity | +0.8% | Texas, Gulf Coast port regions, Midwest-to-East Coast freight lanes | Long term (≥ 4 years) |
| Restaurant and foodservice industry recovery | +1.0% | National, with concentration in urban metropolitan areas | Short term (≤ 2 years) |
| IoT-enabled real-time temperature monitoring mandates | +0.7% | National | Medium term (2-4 years) |
| Source: Mordor Intelligence | |||


Expansion of Temperature-Controlled Warehouse Networks Supporting Shorter Distribution Routes
Cold storage expansion is reducing haul lengths and shifting routing toward frequent, sub-24-hour replenishment. North American GCCA members added 629 million cubic feet of refrigerated capacity in 2025, marking a significant year-over-year increase and positioning inventory closer to population centers.[1]Global Cold Chain Alliance, “2025 GCCA Top 25 Lists of Refrigerated Warehousing & Logistics Providers,” Global Cold Chain Alliance, gcca.org Americold’s Kansas City facility, opened in August 2025, serves a large share of households within a one-day delivery radius, enabling daily replenishment cycles and reducing stockouts in metropolitan markets. The Miami International Airport cold storage complex, scheduled for 2027, will further support regional distribution by breaking bulk imports into smaller temperature-controlled units. As facilities grow near end markets, the U.S. refrigerated trucking market benefits from tighter route cycles and faster turns, favoring carriers optimized for short-haul shuttles. This shift supports dependable fulfillment for high-velocity categories with narrow safety stock and freshness windows. Carriers adapting fleet mix and driver scheduling to denser warehouse footprints can achieve higher utilization and service-level premiums.
Growing Consumer Demand for Organic and Fresh Produce Year-Round
Year-round consumer demand for organic and fresh produce is broadening refrigerated flows beyond historic coastal origins and peak seasons. Industry association tracking shows stronger intent to buy fresh produce across younger demographics and ongoing expansion of organic assortments in mainstream retail, which sustains high frequency chilled movements into dense urban markets. Retailers and suppliers are extending sourcing calendars and diversifying origins, which creates new refrigerated lanes from growing inland regions to micro fulfillment centers as the omnichannel grocery matures. The United States refrigerated trucking market is therefore handling more short shelf life loads under tighter temperature tolerances and rapid turn expectations. This pattern supports LTL growth because stores and dark kitchens prefer frequent deliveries that align with space constraints and inventory freshness. Seasonal volatility still exists, yet multi-origin sourcing and import reliance through USDA pre-clearance facilities have tempered extreme swings in availability and route density in several metro corridors. Carriers that can integrate dynamic consolidation and strict temperature assurance are best positioned to serve retailers’ quality benchmarks in the United States refrigerated trucking market.
Biopharmaceutical Manufacturing Growth Driving Vaccine and Clinical Trial Shipments
High-value therapies requiring cold chain handling are driving demand for GDP-compliant carriers. Growth in cell and gene therapies and mRNA platforms has increased the need for ultra-cold setpoints below minus‑20 degrees Celsius, favoring carriers with specialized equipment and validation protocols. Many top-selling drugs in the United States now require cold storage, making the pharma cold chain a key revenue pillar in the United States refrigerated trucking market. Southeastern biotech corridors in North Carolina and Georgia are shaping ultra-cold routes linking manufacturing, clinical trials, and specialty pharmacies. These lanes command premiums for monitoring, risk controls, and documentation, stabilizing margins compared to cyclical food freight. Carriers standardizing data logging and validation will remain competitive for GDP-sensitive tenders and improve equipment utilization on high-compliance lanes.
Federal Infrastructure Investments Improving Cold Chain Corridor Connectivity
Port and inland corridor upgrades are improving the resilience and predictability of temperature-controlled flows. Gulf Coast investments, including the Gulfport expansion and enhanced USDA pre-clearance capabilities at Port Houston, are shortening customs dwell and strengthening backhaul utilization for poultry, beef, and produce flows that underpin the United States refrigerated trucking market. These upgrades support containerized throughput linked to Mexican and South American imports, which complements denser domestic distribution created by new cold storage sites. As inland rail served cold hubs like Kansas City expand, carriers gain more options to reposition equipment around predictable cross-docks and scheduled drayage. Federal transportation programs that address roads and bridges add to long-term reliability, although full congestion relief is a multi-year outcome. The United States refrigerated trucking market benefits when corridor reliability improves because shippers can commit to more frequent replenishment cycles with reduced buffer inventories. These infrastructure gains also enhance the value proposition for LTL networks that rely on punctual cross-dock turns.
Restraints Impact Analysis*
| Restraint | (~) % Impact on CAGR Forecast | Geographic Relevance | Impact Timeline |
|---|---|---|---|
| Rising diesel and maintenance costs | -0.6% | National, with acute pressure in California and Northeast due to fuel taxes | Short term (≤ 2 years) |
| Aging reefer fleet requiring costly retrofits or replacements | -0.4% | National, concentrated among small and mid‑sized fleets | Medium term (2-4 years) |
| Seasonal demand volatility causing capacity imbalances | -0.3% | Agricultural corridors in California, Texas, Midwest, with spill‑over in import lanes | Short term (≤ 2 years) |
| Insurance premium increases for temperature‑sensitive cargo | -0.5% | National, with higher escalation risk in jurisdictions known for large verdicts | Short term (≤ 2 years) |
| Source: Mordor Intelligence | |||
Rising Diesel and Maintenance Costs Eroding Carrier Profit Margins
Fuel and upkeep remain challenges in 2026 despite slight relief in diesel prices. The Energy Information Administration projects lower diesel prices compared to 2025, but rising costs for parts, equipment, and labor have increased operating expenses.[2]U.S. Energy Information Administration, “Short‑Term Energy Outlook,” U.S. Energy Information Administration, eia.gov Refrigeration units require frequent cycling and specialized maintenance, adding to costs. California data highlights older trailer TRUs and generator sets, with emissions compliance influencing refurbishment or replacement decisions.[3]California Air Resources Board, “Transport Refrigeration Units Regulation Updates Workshop,” California Air Resources Board, arb.ca.gov Carriers face tough choices between overhauling older equipment or investing in newer, cleaner units amid price inflation. The United States refrigerated trucking market experiences margin pressure as input costs outpace rate adjustments, driving competition for scale advantages in procurement and efficiency.
Insurance Premium Increases for Temperature-Sensitive Cargo Liability
Insurance costs have trended higher for many carriers due to the severity of liability claims and the complexity of temperature-sensitive cargo risks. Underwriters are scrutinizing operational controls, driver safety programs, and real-time monitoring to calibrate premiums and set sub-limits for cargo coverage. Refrigerated shipments can involve high-severity losses if temperature excursions compromise food safety or damage high-value pharmaceutical products, which raises risk-adjusted pricing. Carriers are responding with camera systems, telematics, and analytics to reduce incident frequency and establish defensible safety records during underwriting cycles. These steps also support contract compliance in lanes that require continuous monitoring and a documented chain of custody. The United States refrigerated trucking market will continue to reward carriers that can demonstrate superior risk controls to contain insurance expense and protect margins on temperature-sensitive lanes.
*Our forecasts treat driver/restraint impacts as directional, not additive. The impact forecasts reflect baseline growth, mix effects, and variable interactions.
Segment Analysis
By Application: Processed Food Products Drive Innovation in Cold Chain Technology
Processed foods are the fastest growing application with a projected 7.1% CAGR over 2026 to 2031, while meats, fish, and poultry held 22.41% of the United States refrigerated trucking market share in 2025. The application mix continues to benefit from restaurants rebuilding inventories and from shoppers shifting toward frozen items that balance convenience, waste reduction, and nutrition transparency. Frozen inputs help manufacturers and operators decouple production from consumption, which supports steadier temperature-controlled movements even when fresh supply is uneven. Dairy and horticultural volumes remain stable and are supported by ongoing adoption of organic assortments in mainstream retail, which sustain chilled movements that require tight temperature windows. Ultra cold and specialty healthcare loads remain a smaller share of total volume but command premium rates due to strict monitoring and documentation standards for GDP-sensitive cargo.
Within processed foods, reformulation toward frozen entrées and prepared proteins adds lane density on minus 18 degree corridors that are easier to plan and consolidate than perishable fresh moves. Meats, fish, and poultry still anchor national flows from Midwest processing hubs to coastal consumption centers, yet margin pressure from feed and energy costs is pushing shippers to optimize routing and inventory cycles. USDA data show elevated beef prices into early 2026, which is influencing menu engineering and case-ready strategies that moderate shipment sizes but keep frequency steady. The United States refrigerated trucking market size linked to processed foods will benefit from higher pallet density and predictable replenishment across distribution centers that serve chains and club formats. Carriers that pair strong frozen capacity with reliable LTL consolidation can capture more of the application growth that favors flexible drops and strict product protection.


By Truckload Specification: LTL Gains Ground as E Commerce Fragments Shipment Patterns
Full truckload held 68.74% of 2025 shipments, yet less than truckload is projected to grow faster at a 6.9% CAGR as omnichannel grocery and multi-vendor distribution fragments average shipment size. LTL networks are scaling cross-docks with refrigerated zones and standard operating procedures that protect temperature integrity through multiple handling events. Retailers prefer frequent deliveries that fit a tighter cooler space and fast turns for fresh, prepared, and premium-frozen items. Urban last-mile corridors with micro fulfillment and dark kitchens rely on smaller drops that align with variable demand patterns. The United States refrigerated trucking market is therefore shifting toward carriers with LTL expertise, reliable scan compliance, and strong appointment management.
FTL remains the backbone for long-haul agricultural and protein movements, where 40,000-pound reefer trailers still deliver the best per-pound economics across transcontinental lanes. Even so, seasonal imbalances and commodity cycles are driving more carriers to blend contracted FTL commitments with selective LTL exposure to stabilize asset productivity. The resulting hybrid strategies require disciplined pricing to manage handling costs and to protect temperature control across touchpoints. As operators refine network design around e-commerce and regionalized distribution, LTL’s role will expand in metro areas while FTL continues to dominate farm-to-DC and plant-to-DC corridors in the United States refrigerated trucking market. Carriers that match LTL planning rigor with refrigerated quality controls will see better yield across fragmented order profiles.
By Containerization: Sealed Units Dominate as Import Reliance Persists
Containerized shipments led the segment with 86.68% share in 2025 and are projected to grow at a 6.7% CAGR through 2031 on sustained import reliance for produce, seafood, and packaged foods. Gulf Coast ports have strengthened throughput with facility investments and enhanced USDA pre-clearance capabilities that reduce border dwell for perishables and improve outbound utilization on return legs. Containerization supports end-to-end temperature integrity across ocean, rail, and drayage legs with standardized equipment and clear transfer protocols. The United States refrigerated trucking market benefits from this intermodal predictability because domestic handoffs can be scheduled with greater certainty.
Non-containerized movements still serve domestic agricultural corridors where direct plant to DC reefer trailers lower handling and avoid container drayage. These lanes are efficient when shippers control high-volume flows on fixed schedules within regional networks. As import exposure rises and sourcing diversifies to manage climate variability, containerized volumes will remain the structural leader. Investments in port adjacent cold storage and inland rail served hubs add flexibility for domestic re distribution and enable daily replenishment cycles into major metros. Carriers that integrate drayage, cross-dock, and over-the-road services around containerized handoffs can capture more value in the United States refrigerated trucking market.
By Distance: Long Haul Retains Lead but Faces Margin Erosion
Long haul accounted for 72.43% of shipments in 2025 and is projected to grow at a 6.8% CAGR through 2031, supported by transcontinental movements of seafood, produce, and proteins that connect production zones to population centers. Short-haul held 27.57% in 2025 and will expand faster as cold storage density compresses average route length and foodservice and grocery adopt frequent replenishment. Long-haul carriers continue to rely on team operations on key lanes and on disciplined fuel and maintenance programs to protect margins as input costs rise. The United States refrigerated trucking market remains anchored by long-distance patterns due to the geography of production and consumption.
Short-haul momentum is reinforced by cold warehouse proliferation, urban cross-dock growth, and import corridors that favor frequent drayage plus regional distribution. These routes deliver predictable driver home time, which helps reduce turnover and stabilize service in dense metro areas. As carriers allocate capital, the balance between long-haul tractor-trailer investments and day cab fleets will shape utilization and pricing. The United States refrigerated trucking market size linked to shorter routes will rise as micro fulfillment and urban cold hubs multiply, while long haul continues to carry most of the national volume. Fleets that operate both profiles with unified visibility and appointment discipline will be better placed to manage seasonality and volatile spot cycles.
By Goods Configuration: Solid Goods Anchor Volume, Fluid Freight Offers Higher Returns
Solid goods represented a 71.84% share in 2025 and define the core of palletized frozen proteins, boxed produce, and packaged dairy movements, while fluid goods are projected to grow at a 6.8% CAGR on rising demand for cold-pressed beverages, liquid eggs, and chilled dairy drinks. Fluid loads require specialized tankers, sanitary standards, and disciplined wash outs, which lift revenue per mile but reduce daily turns due to cleaning and pump-out time. Solid goods benefit from standardized pallet handling that fits cross-dock and warehouse racking for fast loading and unloading. The United States refrigerated trucking market will keep seeing solid goods as the base volume that fills reefers across seasons.
Fluid goods growth is linked to broader adoption of ready-to-drink and foodservice inputs that ship in bulk for centralized preparation. This traffic rewards carriers with food-grade certifications and track and trace systems that demonstrate temperature security and cleanliness. Solid goods face intermittent competition from dry vans outfitted with portable cooling during shoulder seasons, which can temporarily pressure spot rates. Tanker specialization creates a natural moat for fluid goods carriers since equipment is less fungible and operations are more regulated. Carriers that balance both profiles can smooth cycles and capture higher yield lanes in the United States refrigerated trucking market.
By Destination: Domestic Freight Dominates, Cross-Border Volumes Accelerate
Domestic shipments accounted for a 64.87% share in 2025 as intra-U.S. food distribution remains the backbone of the United States refrigerated trucking market, while international shipments into Canada and Mexico are projected to grow at a 6.9% CAGR to 2031. Cross-border flows benefit from USDA pre-clearance and harmonized processes that reduce customs dwell for perishables. Ports and border crossings in Texas are capturing rising import volumes from Mexico, which shifts distribution gravity toward southern corridors. Domestic lanes remain attractive due to simpler documentation and fewer regulatory variables.
International legs require careful alignment of food safety documentation, inspection protocols, and insurance that rises with complexity and time in transit. Currency fluctuations and trade reviews add planning uncertainty for some shippers, yet sourcing diversification and nearshoring are expected to support steady cross-border growth. The United States refrigerated trucking market increasingly depends on corridors that can serve both domestic redistribution and export consolidation. Fleets that maintain bilingual operations teams, cross-border insurance, and strong drayage partnerships will capture more of the accelerating international demand. Capacity that can pivot between domestic and cross-border tenders will be best positioned to balance utilization across seasonal produce cycles.
By Temperature Type: Frozen Freight Outpaces Chilled as Inventory Strategies Shift
Chilled freight held a 56.14% share in 2025 and remains essential for fresh produce, dairy, and short shelf life proteins, while frozen is projected to grow fastest at a 7.2% CAGR over 2026 to 2031. Frozen products allow shippers to build safety stock and align production with promotion windows, which improves route planning and utilization. E-commerce grocery and meal kits use frozen assortments to manage delivery windows and reduce spoilage risk. The United States refrigerated trucking market sees frozen lanes as a planning advantage because an 18 minus-18-degree linehaul tolerates minor fluctuations without product loss.
Chilled volumes remain resilient as retailers expand organic and premium fresh assortments that require frequent restocking and precise temperature control. Tighter tolerances and quick turns heighten service discipline and increase the value of real-time monitoring in chilled lanes. Foodservice recovery has also lifted frozen inputs as operators rebuild inventories to ensure menu consistency. As FSMA 204 deadlines approach, both chilled and frozen segments will benefit from standardized traceability, but chilled shipments face greater exposure to delays and temperature excursions. Carriers that differentiate on visibility and incident prevention will capture premium chilled and frozen tenders in the United States refrigerated trucking market.
Geography Analysis
Regional demand patterns continue to reorient around import corridors, inland hubs, and population density. Texas has emerged as the strongest reefer corridor in load ratios, helped by Mexican agricultural imports through Laredo, McAllen, and El Paso, and by Gulf Coast export lanes that connect proteins to international markets. The Midwest anchors frozen protein distribution from processing centers in Iowa, Nebraska, and Kansas to the East Coast through lanes that often run 1,000 miles or more, which underpins long-haul share in the United States refrigerated trucking market. The Northeast depends on sub-24-hour grocery fulfillment across Boston, New York, and Philadelphia, supported by micro fulfillment centers and urban cold rooms. California remains foundational for fresh produce despite water constraints that push retailers to diversify with Mexican and South American sourcing. The United States refrigerated trucking market size of USD 33.18 billion in 2026 frames these geographic shifts as carriers balance long-haul exposure with short-haul growth within dense metro regions.
The Southeast shows the fastest structural momentum due to growing biotech corridors in North Carolina and Georgia, and Atlanta’s role as a freight crossroads that links domestic distribution with import and export consolidation. Inland warehouse growth in Phoenix, Salt Lake City, and Denver extends two-day delivery coverage across much of the western half of the country, which supports predictable short-haul patterns. The Pacific Northwest maintains specialized flows in seafood and organic produce, although its distance from large inland markets moderates volume density. Gulf Coast investments, including the Gulfport expansion and enhanced pre-clearance at Port Houston, are improving turn times for perishables and strengthening export corridors that link the region with key overseas buyers. These dynamics reinforce a multipolar network where inland and Gulf nodes take a larger role relative to historic West Coast gateways.
Trade harmonization under USMCA and nearshoring across northern Mexico are raising cross-border activity that reshapes routing into Texas and the Southeast. This supports more containerized flows and scheduled drayage that feed regional cold networks. Carriers must also manage regulatory fragmentation where California’s TRU rules and CARB precedents influence equipment deployment and upgrade plans, even as federal waiver questions shape timing. Climate variability adds route risk, which increases the value of contingency planning and spare capacity in hurricane-prone, wildfire-exposed, or extreme cold regions. The United States refrigerated trucking market will continue to reward fleets that align network design to regional production calendars, trade flows, and compliance obligations.
Competitive Landscape
The United States refrigerated trucking market remains highly fragmented, with a mix of large asset-based carriers, regional reefer specialists, and smaller owner-operator fleets competing across food and pharmaceutical supply chains. Large carriers such as C.R. England, Marten Transport, and Prime Inc. operate extensive temperature-controlled trailer fleets and focus on long-haul contract freight for grocery retailers, food manufacturers, and protein processors. Mid-sized and regional operators compete by offering flexible capacity, specialized lane coverage, and strong relationships with agricultural shippers. Competition increasingly centers on fleet modernization, telematics-enabled temperature monitoring, and compliance with food safety and pharmaceutical cold-chain standards. As regulatory requirements tighten and shippers prioritize reliability and traceability, carriers with advanced reefer equipment, digital visibility tools, and disciplined fleet management are strengthening their position in the United States refrigerated trucking market.
The Southeast shows rapid growth due to biotech corridors in North Carolina and Georgia, and Atlanta’s role as a freight hub linking domestic and international distribution. Inland warehouse growth in Phoenix, Salt Lake City, and Denver supports two-day delivery across the western U.S., driving short-haul patterns. The Pacific Northwest specializes in seafood and organic produce, though its distance from inland markets limits volume density. Gulf Coast investments, including Gulfport expansion and Port Houston upgrades, improve perishables' turn times and strengthen export corridors. These trends highlight a growing role for inland and Gulf nodes over traditional West Coast gateways.
USMCA trade harmonization and nearshoring in northern Mexico are boosting cross-border activity, reshaping routes into Texas and the Southeast with more containerized flows and scheduled drayage. Carriers face regulatory challenges, such as California’s TRU rules and CARB precedents, which influence equipment upgrades. Climate variability adds route risks, increasing the need for contingency planning in regions prone to hurricanes, wildfires, or extreme cold. The United States refrigerated trucking market will reward fleets that align networks with regional production calendars, trade flows, and compliance requirements.
United States Refrigerated Trucking Industry Leaders
ATS (Anderson Trucking Service)
Bay and Bay Transportation
C.R. England
Covenant Logistics Group, Inc.
Decker Truck Line, Inc.
- *Disclaimer: Major Players sorted in no particular order

Recent Industry Developments
- November 2025: NewCold announced a USD 275 million automated cold storage facility in Hagerstown, Maryland, with robotic cranes and temperature-controlled systems, targeting an early 2027 start to expand Mid Atlantic distribution capacity.
- March 2025: C.R. England deployed AI-enabled video safety systems across a large refrigerated fleet to reduce accident frequency, strengthen coaching, and support better underwriting outcomes in a challenging insurance environment.
- February 2025: Hirschbach Motor Lines expanded western coverage with a Salt Lake City office to target California produce and Pacific Northwest seafood lanes, while positioning for Mountain West distribution opportunities
- January 2025: Prime, Inc. enhanced its lease purchase program for owner operators to expand capacity and align contractor economics with sustained reefer demand patterns


United States Refrigerated Trucking Market Report Scope
Refrigerated trucking (sometimes known as "reefer") is a freight shipping technique that specializes in the delivery of foods and items that require temperature control. Trailers include an in-built cooling system that keeps temperatures stable during travel to ensure cargo safety. The report provides key insights into the US refrigerated trucking market, along with technology developments, trends, and government regulations. It also focuses on market dynamics and competitive landscape, which is analyzed through the profiles of key players active. The report also covers the geopolitical impact analysis on the market.
The United States Refrigerated Trucking Market Report is Segmented by Application (Horticultural, Dairy Products, and More), by Truckload Specification (FTL, LTL), by Containerization (Containerized, Non-Containerized), by Distance (Long Haul, Short Haul), by Goods Configuration (Fluid, Solid), by Destination (Domestic, International), and by Temperature Type (Chilled, Frozen, Ambient). Market Forecasts are in Value (USD).
| Horticultural Products |
| Dairy Products |
| Meats, Fish, and Poultry |
| Processed Food Products |
| Healthcare and Pharmaceutical |
| Other Applications |
| Full-Truck-Load (FTL) |
| Less than-Truck-Load (LTL) |
| Containerized |
| Non-Containerized |
| Long Haul |
| Short Haul |
| Fluid Goods |
| Solid Goods |
| Domestic |
| International |
| Chilled |
| Frozen |
| Ambient |
| Application | Horticultural Products |
| Dairy Products | |
| Meats, Fish, and Poultry | |
| Processed Food Products | |
| Healthcare and Pharmaceutical | |
| Other Applications | |
| Truckload Specification | Full-Truck-Load (FTL) |
| Less than-Truck-Load (LTL) | |
| Containerization | Containerized |
| Non-Containerized | |
| Distance | Long Haul |
| Short Haul | |
| Goods Configuration | Fluid Goods |
| Solid Goods | |
| Destination | Domestic |
| International | |
| Temperature Type | Chilled |
| Frozen | |
| Ambient |


Key Questions Answered in the Report
What is the current size and growth outlook for the United States refrigerated trucking market?
The United States refrigerated trucking market size was USD 31.14 billion in 2025 and is projected to reach USD 45.38 billion by 2031 at a 6.5% CAGR over 2026 to 2031.
Which segments lead the United States refrigerated trucking market by share and growth?
Full‑truckload led by share at 68.74% in 2025, while less‑than‑truckload is the fastest‑growing segment at a 6.9% CAGR through 2026-2031. Furthermore, by Temperature Type chilled led by share at 56.14% in 2025 while frozen grows fastest at 7.2% CAGR during 2026-2031.
How are regulations like FSMA 204 affecting the United States refrigerated trucking market?
FSMA 204 requires digital traceability with 24‑hour record retrieval for foods on the traceability list by July 2028, which is accelerating investment in telematics, sensors, and data integration across fleets.
What role do cold storage expansions play in United States refrigerated trucking market dynamics?
New cold warehouses near population centers compress route lengths and increase short‑haul and LTL activity by enabling daily replenishment and micro‑fulfillment, lifting utilization for carriers optimized for frequent, sub‑24‑hour deliveries.
Which geographies are most important in the United States refrigerated trucking market right now?
Texas and Gulf Coast corridors are strengthening with rising imports and pre‑clearance, the Southeast is accelerating with biotech and nearshoring, and the Midwest remains central to frozen protein distribution.
What technologies are carriers adopting to compete in the United States refrigerated trucking market?
Carriers are standardizing IoT temperature monitoring, advanced driver‑safety systems, data integration for FSMA 204 compliance, and piloting electric TRUs to reduce emissions while protecting product integrity.
Page last updated on:


