United States Tank Trucking Market Size and Share
Market Overview
| Study Period | 2020 - 2031 |
|---|---|
| Forecast Data Period | 2026 - 2031 |
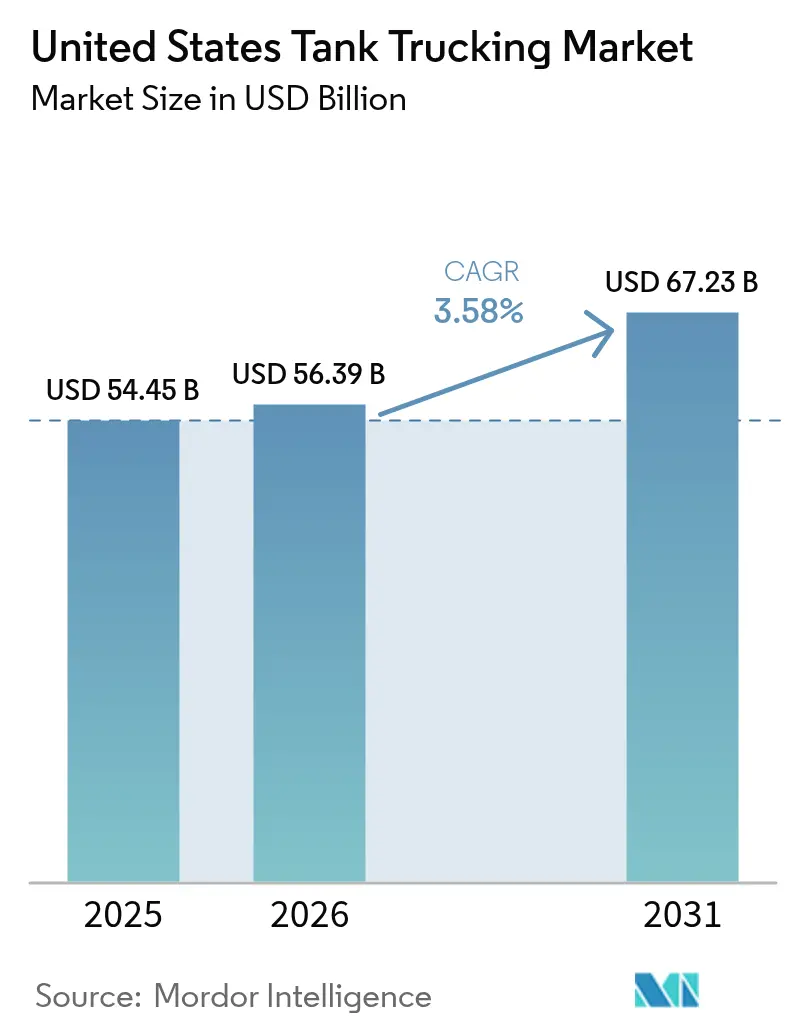
| Base Year Market Size (2025) | USD 54.45 Billion |
| Market Size (2026) | USD 56.39 Billion |
| Market Size (2031) | USD 67.23 Billion |
| Growth Rate (2026 - 2031) | 3.58% CAGR |
| Market Concentration | Low |
Major Players
*Disclaimer: Major Players sorted in no particular order Image © Mordor Intelligence. Reuse requires attribution under CC BY 4.0. |
|
United States Tank Trucking Market Analysis by Mordor Intelligence
The United States Tank Trucking Market size is projected to be USD 54.45 billion in 2025, USD 56.39 billion in 2026, and reach USD 67.23 billion by 2031, growing at a CAGR of 3.58% from 2026 to 2031.
Policy-backed renewable fuel demand is reshaping lane structures as biomass-based diesel volumes guide bio-compatible tank investments and longer terminal-to-terminal runs into low-carbon markets. Operating costs remain elevated, with non-fuel heavy-duty outlays at USD 1.779 per mile in 2025 and hazmat civil penalties that can exceed USD 100,000 per count, tightening margins for small carriers. Labor adds uncertainty as anticipated driver exits during 2025 compound recruitment challenges and force carriers to fine-tune scheduling, pay, and equipment assignments. Telematics, predictive maintenance, and selective electrification on short urban loops are improving asset turns while diesel and LNG remain essential for long-haul payload stability in the United States tank trucking market.
Key Report Takeaways
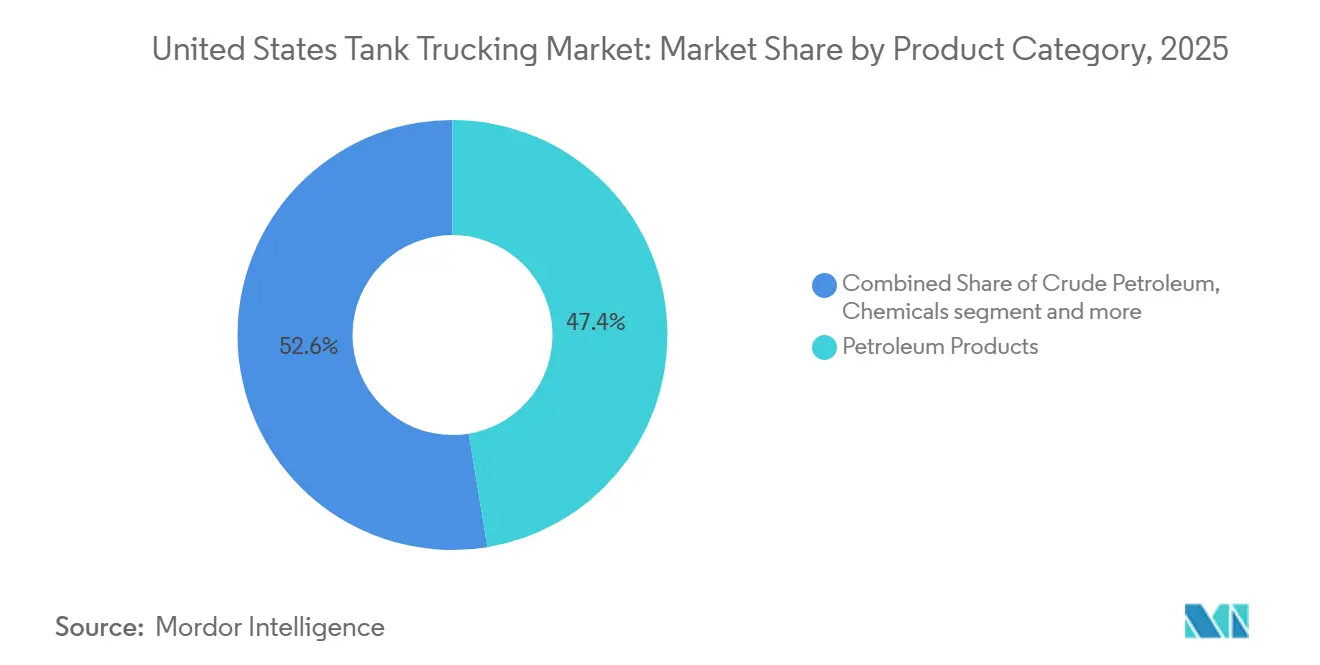
- By product category, petroleum products dominated with 47.45 % of the United States tank trucking market share in 2025. Food & beverages are forecast to expand at a 4.35% CAGR through 2026-2031.
- By capacity, heavy-duty equipment held a 52.32% share of the United States tank trucking market size in 2025. Light-duty fleets are projected to grow at a 3.81% CAGR through 2026-2031.
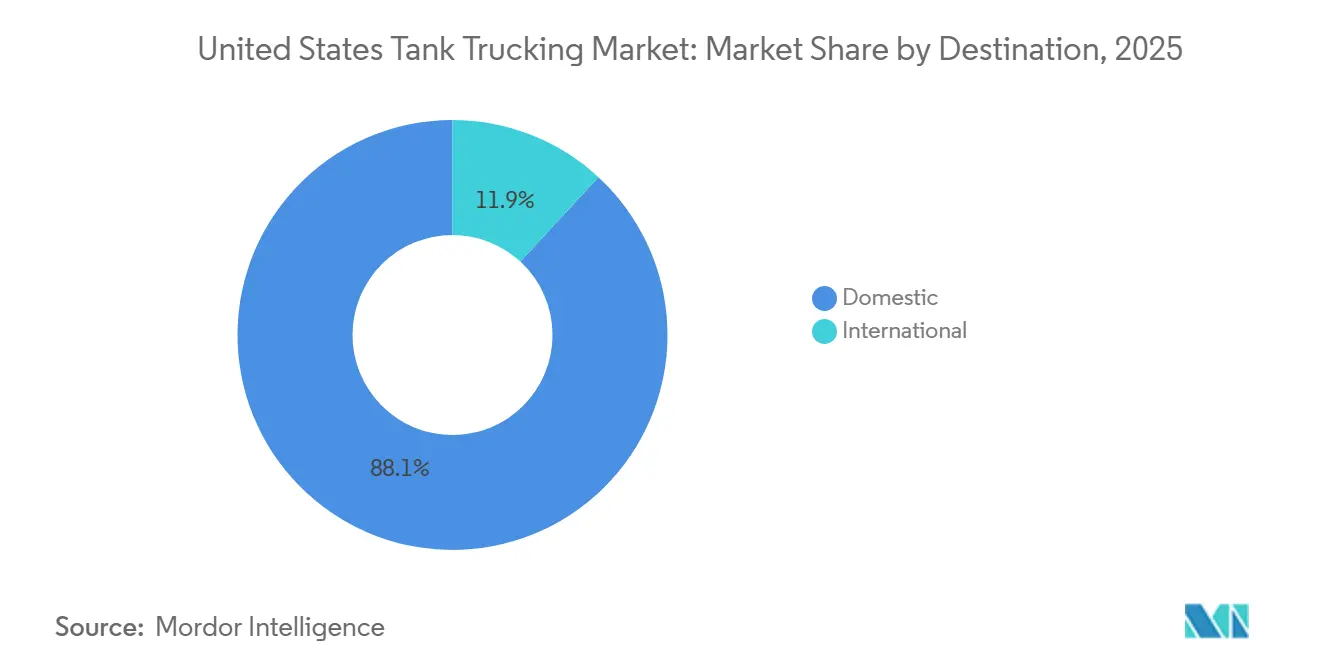
- By destination, Domestic hauls represented 88.12% of the 2025 market share. International movements are expected to rise at a 4.12% CAGR through 2026-2031.
- By distance, short-haul routes captured 62.32% of the 2025 share. Long-haul lanes are expected to increase at a 4.34% CAGR through 2026-2031.
- By application, industrial uses led with a 41.23% share in 2025. Commercial use cases are projected to grow at a 3.92% CAGR from 2026 to 2031.
Note: Market size and forecast figures in this report are generated using Mordor Intelligence’s proprietary estimation framework, updated with the latest available data and insights as of 2026.
United States Tank Trucking Market Trends and Insights
Drivers Impact Analysis*
| Driver | (~) % Impact on CAGR Forecast | Geographic Relevance | Impact Timeline |
|---|---|---|---|
| Growth in Chemical & Petrochemical Production Volumes | +0.8% | Gulf Coast (Texas, Louisiana), Midwest manufacturing corridors | Medium term (2-4 years) |
| Rising Demand for Temperature-Controlled Bulk Transport | +0.6% | National, with early gains in food processing hubs (California, Wisconsin, Texas) | Short term (≤ 2 years) |
| Adoption of Telematics and Predictive Fleet Analytics | +0.4% | National, led by large carriers with >500 power units | Short term (≤ 2 years) |
| Advancements in Tank Safety & Leak-Detection Technologies | +0.3% | National, accelerated in high-hazmat zones (Gulf Coast, California) | Medium term (2-4 years) |
| Shift Toward Renewable Fuels and Biofuel Distribution Networks | +0.7% | Midwest biofuel corridors, California Low Carbon Fuel Standard zones | Long term (≥ 4 years) |
| Strategic Fleet Modernization with Low-Emission Vehicles | +0.5% | California, Northeast emission-control states, major metro drayage zones | Long term (≥ 4 years) |
| Source: Mordor Intelligence | |||
Growth in Chemical & Petrochemical Production Volumes
U.S. chemical output momentum in late 2025 increased short-haul tank moves for just-in-time export container stuffing at Gulf Coast terminals. Insulated stainless tanks and automated valves reduce contamination risks and dwell times. Ethane export capacity grew in 2025 with Energy Transfer adding 250,000 b/d at Nederland and Enterprise’s Neches River terminal adding 120,000 b/d, with Phase 2 in early 2026 adding 180,000 b/d.[1]U.S. Energy Information Administration, “Short-Term Energy Outlook - Petroleum Products,” EIA, eia.gov These expansions boost plant-to-pier feedstock movements, with telematics optimizing routes to minimize idling. Specialty chemicals like hydrogen peroxide and acrylic acid require hazmat training, and safety programs offer carriers a competitive edge. Compliance costs remain critical, as inspection failures can result in USD 8,000 fines and schedule disruptions. The Gulf Coast’s ammonia and refinery-petrochemical assets anchor the U.S. tank trucking market, with carriers aligning terminal density and tank configurations to clusters in Texas and Louisiana.
Rising Demand for Temperature-Controlled Bulk Transport
Food-grade and temperature-controlled liquid movements are scaling under FDA and FSMA sanitary transport rules, and this is why food and beverages lead growth with a 4.35% CAGR through 2031. Elevated hygiene requirements increase tank cleaning frequency and wash-bay utilization, while stainless-steel and wash-in-place systems protect product integrity for edible oils, dairy, and sweeteners. Food processors and dairy cooperatives prefer carriers that instrument temperature, validate sanitation cycles, and maintain traceability, which supports premium rates and stable lane awards. M&A that expands food-grade fleets and terminal coverage in Canada and the United States is improving access to dedicated flows that fit regional loops and cross-border dairy routes. Regional clusters in California, Wisconsin, and Texas continue to attract specialized tank capacity because consistent production schedules and sanitation protocols enable high trailer turns in the United States tank trucking market.
Adoption of Telematics and Predictive Fleet Analytics
Carriers are integrating telematics to couple route planning, driver behavior monitoring, and fuel analytics with maintenance scheduling, which lowers empty miles and reduces unscheduled downtime. Electronic logging device audits require clean digital records, pushing centralized back-office workflows that support on-time performance and audit readiness in hazmat lanes.[2]PHMSA. "Hazardous Matters October 2025 – March 2026: Special Double Issue." Last updated January 26, 2026. phmsa.dot.gov Modest pricing power re-emerged in mid-2025 with the Cass Truckload Linehaul Index up 0.4% month-over-month and 1.9% year-over-year in June, which helped justify software investments that yield network efficiencies. As AI-enabled dispatch, invoice automation, and inventory control tools mature, fleets convert data streams into real-time exception management and higher asset turns across constrained corridors in the United States tank trucking market. These tools also strengthen safety by flagging early warning signs on components, which reduces roadside events and protects shipper service windows.
Advancements in Tank Safety & Leak-Detection Technologies
Rollover risk and liquid surge dynamics have driven the adoption of electronic stability control, collision mitigation, and lane departure alerts to improve vehicle handling and reduce incidents. Advances in materials, design, and automated valve controls enhance durability and loading precision while reducing errors. Sensor arrays monitoring tank pressure and temperature enable faster troubleshooting, lowering downtime and maintenance costs. Regulatory updates in January 2026 reinstated practical exceptions and authorized video-based cargo tank inspections, generating annual cost savings. Policymakers are evaluating automation's role in hazmat rules, ensuring a cautious approach.[3]Federal Register. "Hazardous Materials: Eliminating Unnecessary Regulatory Burdens on Fuel Transportation." January 14, 2026.federalregister.gov Safety awards for carriers with strong records influence shipper selection in the U.S. tank trucking market.
Restraints Impact Analysis*
| Restraint | (~) % Impact on CAGR Forecast | Geographic Relevance | Impact Timeline |
|---|---|---|---|
| Stringent Regulatory Compliance for Hazardous Materials Transport | -0.5% | National, with elevated scrutiny in California, Northeast corridor | Short term (≤ 2 years) |
| Shortage of Licensed Commercial Tank Drivers | -0.7% | National, acute in long-haul OTR roles and rural terminal zones | Short term (≤ 2 years) |
| High Costs of Specialized Tank Equipment & Fleet Upgrades | -0.4% | National, disproportionate impact on small carriers (<50 power units) | Medium term (2-4 years) |
| Urban Delivery Restrictions and Low-Emission Zone Limitations | -0.3% | Major metro areas (Los Angeles, New York, Portland), port drayage zones | Medium term (2-4 years) |
| Source: Mordor Intelligence | |||
Stringent Regulatory Compliance for Hazardous Materials Transport
Hazmat enforcement risk is significant for smaller fleets, as civil penalties can reach USD 102,348 per count, and annual fees have increased for some registrants, raising fixed costs. Cargo tank inspection failures can lead to USD 8,000 fines and last-minute rescheduling, eroding utilization and increasing back-office workload. A January 2026 final rule eased burdens for fuel transporters, authorizing video-based inspections and electronic submissions, producing compliance savings. Federal plans to align with the 2024 IMDG Code introduce documentation and training updates requiring attention. Municipal zero-emission delivery pilots reshape access and curb rules in select districts, adding routing complexity and enforcement risk. These requirements disrupt scale efficiencies and force jurisdiction-specific fleet segmentation in the U.S. tank trucking market.
Shortage of Licensed Commercial Tank Drivers
Recruiting challenges persist as tighter qualification triggers and projected exits in 2025 reduce the pool of experienced CDL holders for hazmat and over-the-road roles. Visa policy pauses in 2025 will limited new employment pathways for foreign-born drivers, a key segment for cross-border lanes. Clearinghouse violations and low return-to-duty rates further constrain replenishing qualified rosters. Fleets are raising pay and improving schedules, but lifestyle shifts push many drivers toward regional or local roles over long-haul tank assignments. Enhanced roadside standards extend training cycles, reducing near-term hiring throughput in the U.S. tank trucking market.
*Our forecasts treat driver/restraint impacts as directional, not additive. The impact forecasts reflect baseline growth, mix effects, and variable interactions.
Segment Analysis
By Product Category: Renewable Fuels and Food-Grade Liquids Drive Portfolio Diversification
Petroleum products held 47.45% of the United States tank trucking market share in 2025, supported by retail fuel distribution and refinery-to-terminal flows that serve dense station networks and industrial customers. The United States tank trucking market size for food and beverages is projected to expand at a 4.35% CAGR between 2026 and 2031 as stricter sanitary transport rules favor stainless-steel tanks, wash-in-place systems, and temperature monitoring across regional loops. Chemical logistics stays central as Gulf Coast expansions in feedstocks and export capacity increase plant-to-pier transfers, where telematics reduce circling in congested zones. Fuel product cadence is influenced by distillate demand patterns and refinery operations, with increasing renewable diesel and biodiesel use in 2026 compared to 2021, shifting portions of distribution toward bio-compatible assets. Mix diversification into fertilizers, industrial gases, and asphalt stabilizes seasonality by aligning heating, paving, and industrial campaigns with balanced contract portfolios in the United States tank trucking market.
Policy alignment supports these shifts as low-carbon fuel programs drive elevated throughput of renewable diesel and biodiesel blends, while biomass-based diesel obligations for 2026 reinforce production and distribution investments that consume over 1 billion pounds of soybean oil monthly. Food-grade moves, including edible oils, dairy products, and high-fructose corn syrup, require frequent sanitation and careful temperature control, which intensifies the use of insulated stainless tanks and dedicated wash-bay capacity. Crude movements are concentrated in short-radius plays and refinery turnarounds where tanks provide flex capacity before pipelines take larger shares as export infrastructure matures. These product dynamics keep specialized equipment, sanitation capability, and LCFS access central to sustained growth in the United States tank trucking market.


By Capacity: Light-Duty Urban Fleets Gain Share as Heavy-Duty Dominates Long-Haul Tonnage
Heavy-duty platforms accounted for 52.32% of the United States tank trucking market share in 2025, with Class 8 combinations maximizing payload within federal weight limits and supporting long-haul renewable diesel and LNG corridor moves. The United States tank trucking market size for light-duty platforms is set to grow at a 3.81% CAGR through 2031 as metro loops expand for home heating fuels, potable water, and food-grade liquids, where curb access and neighborhood restrictions favor smaller assets. Medium-duty fleets bridge regional chemical deliveries using 3,000 to 6,000-gallon tanks that balance maneuverability and volume on narrow plant roads and suburban arterials. New regional-haul models entering production in early 2026 aim to deliver better fuel efficiency and uptime, which reduces the total cost of ownership for carriers refreshing mixed fleets. This segmentation supports equipment-to-lane mapping, where heavy-duty units concentrate on terminal-to-terminal runs and lighter assets focus on neighborhood deliveries in the United States tank trucking market.
Regulatory timelines shape configuration choices across segments as operators time pre-buys and evaluate powertrain mixes for compliance and uptime. Port-area incentives and local access rules accelerate light-duty electrification on short, predictable routes, while heavy-duty tractors remain anchored in diesel and LNG where range and payload integrity are critical. Telematics and predictive maintenance are now standard practices to optimize service intervals, prevent roadside failures, and protect compliance for hazmat and food-grade operations. These trends reinforce a multi-class asset strategy that aligns emissions goals, route density, and terminal proximity in the United States tank trucking market.
By Destination: Cross-Border Fuel Arbitrage Lifts International Share Despite Domestic Dominance
Domestic hauls represented 88.12% of overall volume in 2025, reflecting the concentration of intra-U.S. fuel, chemical, and food-grade loops that rely on established terminal networks and retail station density. The United States tank trucking market size for international movements is projected to advance at a 4.12% CAGR through 2031, as Canadian agricultural inputs and low-carbon fuel programs strengthen cross-border flows for biofuels and related feedstocks. Potash imports and other Canadian commodities align with U.S. agricultural cycles, while digital customs and bilateral insurance coverage reduce border dwell and increase backhaul certainty for specialized tanks. Domestic lanes also benefit from refinery output patterns and retail station counts that keep scheduling predictable for short- and medium-haul deliveries.
Refinery closures and evolving product balances change export opportunities, drawing carriers with hazmat permits and wash capacity toward Gulf Coast corridors where chemical and petroleum chains converge. Visa and language policies affect cross-border staffing, which focuses on recruiting experienced, bilingual drivers for roles that require customs documentation proficiency and regulated handling. Strategic acquisitions have improved North America-wide coverage for select fleets, including food-grade networks that span Atlantic Canada and the U.S. Northeast, which supports stable milk and edible oil flows. These patterns set the stage for measured international share gains while domestic loops remain the foundation of the United States tank trucking market.
By Distance: LNG Corridor Build-Outs and Renewable Diesel Terminals Propel Long-Haul Expansion
Short-haul routes captured 62.32% of demand in 2025, reflecting the distribution advantages of metro-radius petroleum, chemical, and food-grade moves near refineries, plants, and terminals. Long-haul segments are forecast to rise at a 4.34% CAGR through 2031 as renewable diesel and related low-carbon fuels move across multi-state corridors connecting Midwest production to West Coast consumption zones. These longer lanes benefit from dynamic routing and balanced backhauls that protect yield, while local density allows short-haul fleets to achieve higher daily turns with predictable scheduling. As fleets incorporate zero-emission trucks for sub-100-mile loops, they rely on depot charging and stable duty cycles, while long-haul operations prioritize fuels that maintain payload and range.
Efficiency upgrades in engines and aerodynamics, plus AI-enabled dispatch tools, are reducing per-mile costs, although operators continue to time refresh cycles with upcoming emissions rules and expected pre-buys. Municipal zero-emission delivery pilots alter curb access and parking assumptions, which require continuous compliance monitoring and collaboration with local authorities. Long-haul profitability remains tied to asset utilization, coordinated terminalling, and equipment matched to product properties, which suits heavy-duty diesel and LNG tractors in the United States tank trucking market.
By Application: Industrial Chemical Logistics and Commercial Retail Fuel Networks Anchor Volume
Industrial applications accounted for 41.23% of 2025 demand, including refinery-to-terminal petroleum moves, plant-to-customer chemical deliveries, and energy support services for construction and utilities in major industrial corridors. Commercial use cases, led by retail fuel distribution and home heating oil deliveries, are the fastest growing at a 3.92% CAGR through 2031 as automated loading arms and digitized workflows reduce dwell at high-throughput terminals. Residential flows maintain steady volumes across propane autogas and potable water deliveries in rural and arid regions that prefer light-duty tankers for access and scheduling benefits. Compliance costs in hazmat logistics continue to drive adoption of advanced safety systems and rigorous maintenance tracking to control incident rates and insurance outcomes in the United States tank trucking market.
Fuel consumption outlooks and refinery operations shape commercial cadence, while safety records and tank specifications guide carrier selection for sensitive chemical chains. Carriers with DOT-412 compatible tanks control cost per gallon over long routes while meeting inspection and documentation requirements that are now supported by video-based evaluations under a January 2026 rule. Specialty haulers recognized for safety and process rigor tend to achieve shipper-preferred status in chemicals, which underpins utilization on regulated assignments. Expanding low-carbon fuel programs continue to increase tank compatibility requirements and cleaning protocols for renewable diesel and biodiesel, reinforcing specialized capability as a differentiator in the United States tank trucking market.
Geography Analysis
The United States tank trucking market is shaped by refinery clusters, biofuel hubs, chemical corridors, and state-level low-carbon rules. The Gulf Coast, led by Texas and Louisiana, dominates in 2025 due to integrated refinery-petrochemical complexes and export infrastructure. California is the fastest-growing region as clean-fleet targets and LCFS incentives boost renewable fuel distribution and electric drayage adoption. The Midwest benefits from soybean oil-intensive biofuel production, while the Northeast focuses on home heating oil, specialty chemicals, and last-mile liquids in urban zones.
Gulf Coast strength remains consistent due to essential commodity flows, while California and the West accelerate with hydrogen corridors and renewable diesel projects. Midwest growth faces feedstock cost swings and federal incentive uncertainty, but proposed biomass-based diesel volumes for 2026 provide demand visibility. Evolving automation frameworks for hazmat add complexity to cross-regional operations, especially for fleets spanning California, the Northeast, and Gulf Coast corridors. Strategic acquisitions expanded Northeastern and Midwestern footprints for leading carriers, improving terminal density and customer coverage.
Private fleet conversions and contract-dedicated models are growing in central states as shippers seek stable service capacity. Western investments in cleaner corridors support pilots for light-duty electrification and alternative fuels, though infrastructure gaps limit heavy-duty hydrogen and electric adoption. State-level reporting and labeling requirements add administrative load for multi-state operators, reinforcing the value of centralized compliance and telematics. Specialized demand in the Mountain West and Southeast spans mining diesel deliveries, drilling-site water trucking, and last-mile retail fuels, sustaining steady regional loops.
Competitive Landscape
The United States tank trucking market is fragmented, which allows national integrators and specialized carriers to coexist across food-grade liquids, cryogenics, and high-hazard chemicals. M&A momentum remained active through 2025 and early 2026 as fleets pursued terminal density, wash capacity, and complementary product portfolios, including transactions that expanded chemical hauling in Gulf Coast corridors. One North American platform broadened food-grade coverage and deepened contract-dedicated programs via acquisitions and private fleet conversions, which enhanced coast-to-coast service in Canada and the United States. These moves target resilience by aligning utilization, compliance infrastructure, and regional mix across petroleum, chemical, and food-grade networks in the United States tank trucking market.
Carriers differentiate through safety leadership and technology integration, which reduces incident frequency, lower insurance costs, and raises shipper confidence for regulated products. Telematics systems that integrate routing, fuel analytics, and maintenance planning help cut empty miles and compress exception handling times, sustaining yields in time-sensitive corridors. Capabilities to handle renewable diesel and biodiesel blends at scale, maintain LCFS access, and manage cleaning protocols for product integrity are now key to growth. Early zero-emission deployments are concentrated in short-haul and drayage applications, while heavy-duty adoption is paced by infrastructure and duty-cycle constraints.
Regulatory modernization that authorizes video-based inspections and simplifies submissions reduces per-unit compliance costs for fleets with centralized audit teams, while smaller independents face relatively higher burdens. Policymakers are reviewing how automation intersects with hazmat rules, which keeps pilot programs focused and staged. M&A that added tank wash facilities and ISO container handling has strengthened end-to-end offerings and customer stickiness in chemicals and food-grade chains in the United States tank trucking market.
United States Tank Trucking Industry Leaders
-
Kenan Advantage Group
-
Trimac Transportation
-
Groendyke Transport
-
Superior Bulk Logistics
-
Martin Transport
- *Disclaimer: Major Players sorted in no particular order

Recent Industry Developments
- January 2026: Kenan Advantage Group expanded KAG Energy's operations in Kansas City (MO), Pueblo (CO), and Alamosa (CO) through a private fleet conversion with a global energy services customer. About 80 professionals joined KAG, showcasing its growth and fleet conversion program to optimize costs and resources.
- December 2025: Tremcar, a tank trailer and truck-mounted tank manufacturer, acquired Pacific Truck Tank in Sacramento, California, to expand its presence in the western U.S. and strengthen its petroleum and propane sectors. Pacific Truck Tank operates a 22,000 sq. ft. facility with six work bays, serving customers in the western U.S. and Canada. Tremcar will retain the facility as a service and assembly hub, supporting its plants in Ohio, Massachusetts, and Quebec.
- October 2025: Trimac Transportation acquired Service Transport Company (STC) on October 1, 2025, expanding its chemical hauling operations in the U.S. Gulf Coast. STC, based in Houston, Texas, operates 16 locations, four tank wash facilities, and a fleet of 290 tractors and 750 trailers. Founded in 1965, STC specializes in hauling specialty chemicals and received the Heil Trophy in 2021 for safety excellence.
- October 2025: Vexxil Energy, an Alabama-based fuel distributor, acquired Direct Fuel Transport (DFT) and McGuire Oil Company (MOCO), creating one of the region's largest fuel transport fleets. This acquisition enables Vexxil to expand delivery capabilities, serve new markets, and support Gulf Coast industries. DFT is known for its on-time performance and reliability in fuel transportation.


United States Tank Trucking Market Report Scope
Tank trucking refers to the transportation of liquid, gaseous, or flowable bulk commodities by road using specialized tank trucks or tanker trailers. These vehicles are engineered with cylindrical tanks and specialized safety systems to safely carry products that require containment, temperature control, or hazardous-material handling.
The report provides a comprehensive background analysis of the US tank trucking market, covering the current market scenario, trends, drivers, restraints, technological updates, government regulations, and detailed information on various segments and the competitive landscape of the industry. In addition, the geopolitical impact analysis has been incorporated and considered during the study.
The market is segmented by Product Category (Crude Petroleum, Petroleum Products, Chemicals, Food and Beverages, Fertilizers, and Other Product Categories), by Capacity (Light Duty, Medium Duty, and Heavy Duty), by Destination (Domestic, and International), by Distance (Long Haul, and Short Haul), by Application (Residential, Commercial, and Industrial). The report offers market size and forecasts for the US tank trucking market in value (USD billion) for all the above segments.
| Crude Petroleum |
| Petroleum Products |
| Chemicals |
| Food and Beverages |
| Fertilizers |
| Other Product Categories |
| Light Duty |
| Medium Duty |
| Heavy Duty |
| Domestic |
| International |
| Long Haul |
| Short Haul |
| Residential |
| Commercial |
| Industrial |
| By Product Category | Crude Petroleum |
| Petroleum Products | |
| Chemicals | |
| Food and Beverages | |
| Fertilizers | |
| Other Product Categories | |
| By Capacity | Light Duty |
| Medium Duty | |
| Heavy Duty | |
| Destination | Domestic |
| International | |
| By Distance | Long Haul |
| Short Haul | |
| By Application | Residential |
| Commercial | |
| Industrial |


Key Questions Answered in the Report
What is the current size and growth outlook for the United States tank trucking market?
The United States tank trucking market size was USD 54.45 billion in 2025 and is projected to reach USD 67.23 billion by 2031 at a 3.58% CAGR.
Which segments are currently leading and growing fastest?
Petroleum products led with 47.45% in 2025, while food and beverages is forecast to grow at 4.35% CAGR through 2031.
How is the capacity mix evolving across fleets?
Heavy-duty units lead with 52.32% share, while light-duty fleets are expected to post a 3.81% CAGR through 2031 on metro and regional loops.
What regulatory changes are shaping compliance and cost structures?
A January 2026 rule authorized video-based inspections and eased documentation burdens, while a December 2025 notice began exploring automation’s role in hazmat transport.
Where are regional opportunities strongest in the United States tank trucking market?
The Gulf Coast holds the largest share due to refinery-petrochemical density, and California is the fastest-growing region supported by LCFS demand and clean-fleet targets.
How is telematics improving fleet performance and safety?
Integrated telematics are lowering empty miles, improving on-time performance, and supporting predictive maintenance that cuts unscheduled downtime and incidents.
Page last updated on:


