Market Overview
| Study Period | 2020 - 2031 |
|---|---|
| Forecast Data Period | 2026 - 2031 |
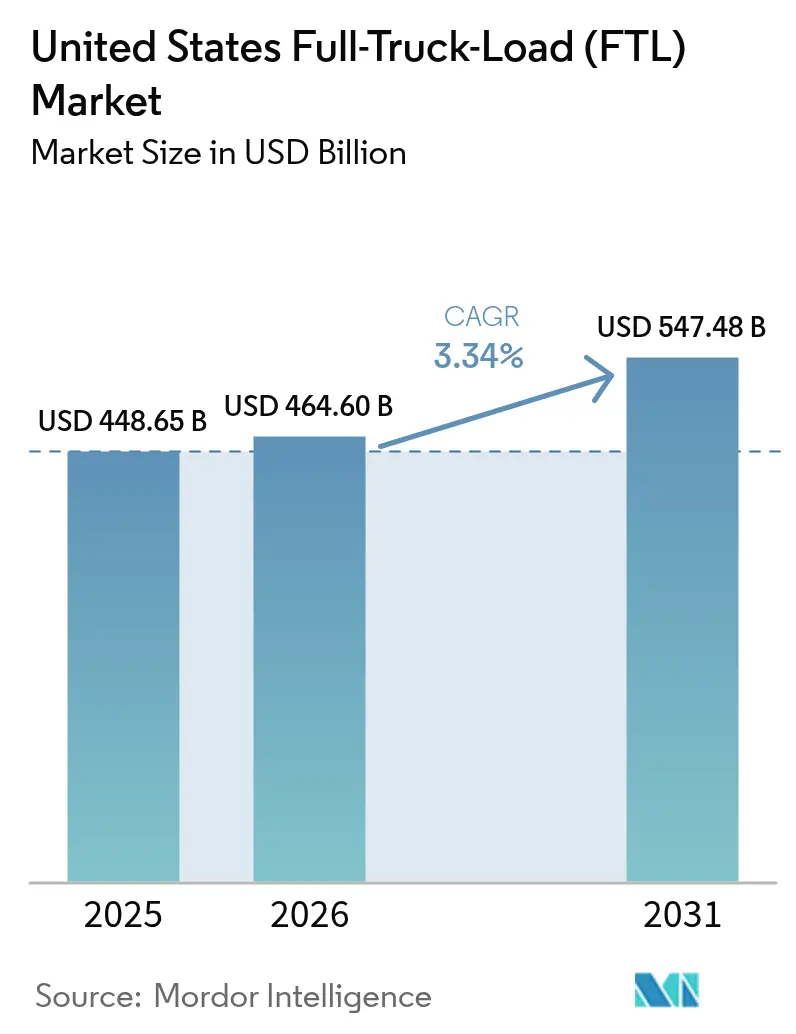
| Base Year Market Size (2025) | USD 448.65 Billion |
| Market Size (2026) | USD 464.60 Billion |
| Market Size (2031) | USD 547.48 Billion |
| Growth Rate (2026 - 2031) | 3.34% CAGR |
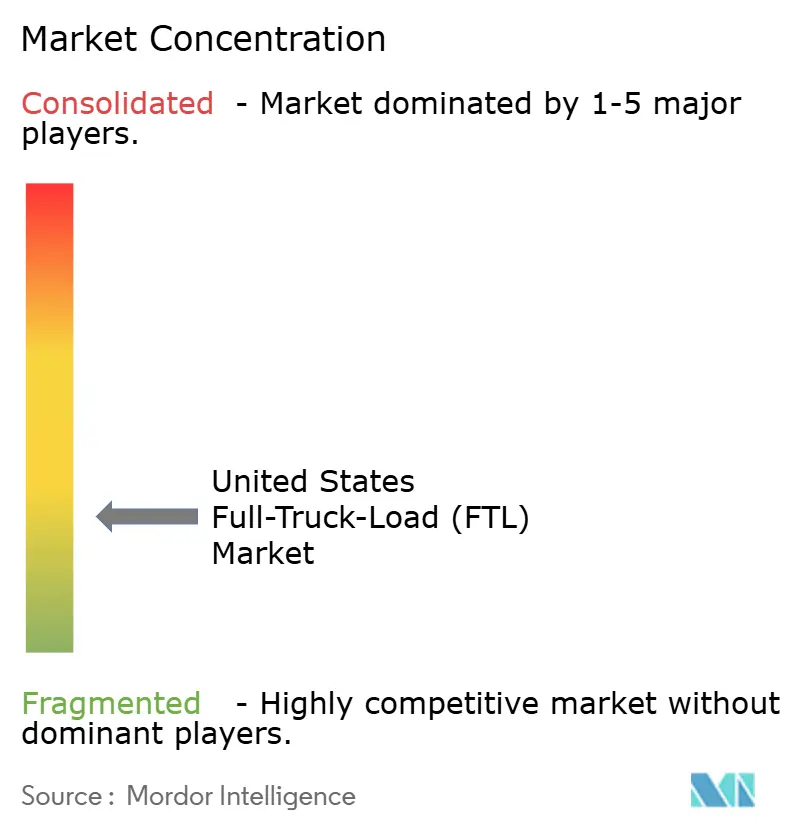
| Market Concentration | Low |
Major Players *Disclaimer: Major Players sorted in no particular order Image © Mordor Intelligence. Reuse requires attribution under CC BY 4.0. | |
United States Full-Truck-Load (FTL) Market Analysis by Mordor Intelligence
The United States full-truck-load market size was valued at USD 448.65 billion in 2025 and is estimated to grow from USD 464.60 billion in 2026 to reach USD 547.48 billion by 2031, at a CAGR of 3.34% during the forecast period (2026-2031).
Cross-border freight tied to USMCA nearshoring, the spread of API-driven digital load boards, and federal alternative-fuel incentives are reshaping cost structures and service expectations. Carriers able to couple Texas-centered gateway density with automated brokerage networks convert volume spikes into premium yields while mitigating empty miles. Meanwhile, grocery and fresh-produce omnichannel models pull temperature-controlled capacity into dense urban corridors, supporting rate resilience even when general dry-van demand softens. Insurance inflation, parts shortages, and possible speed-limiter mandates temper margin gains, yet technology-enabled load optimization is cushioning those headwinds by lifting fleet utilization.
Key Report Takeaways
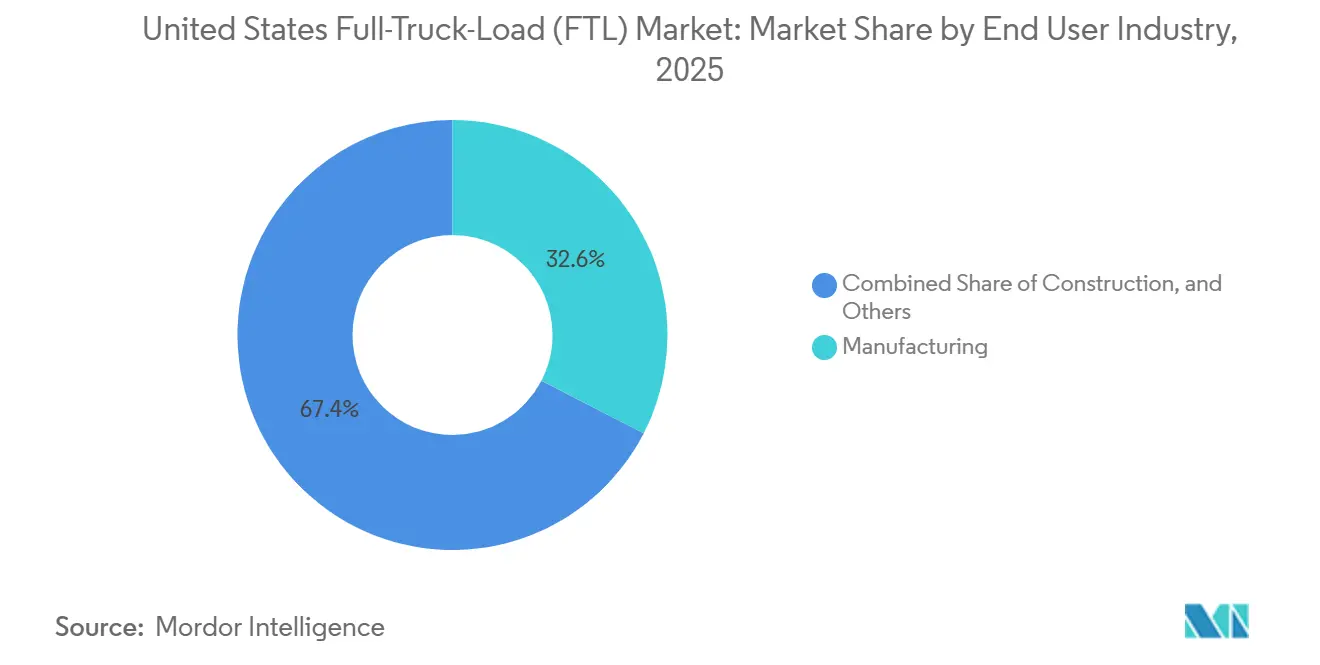
- By end-user industry, manufacturing held 32.56% of the United States full-truck-load market share in 2025, while wholesale & retail trade is projected to expand at a 5.83% CAGR through 2031.
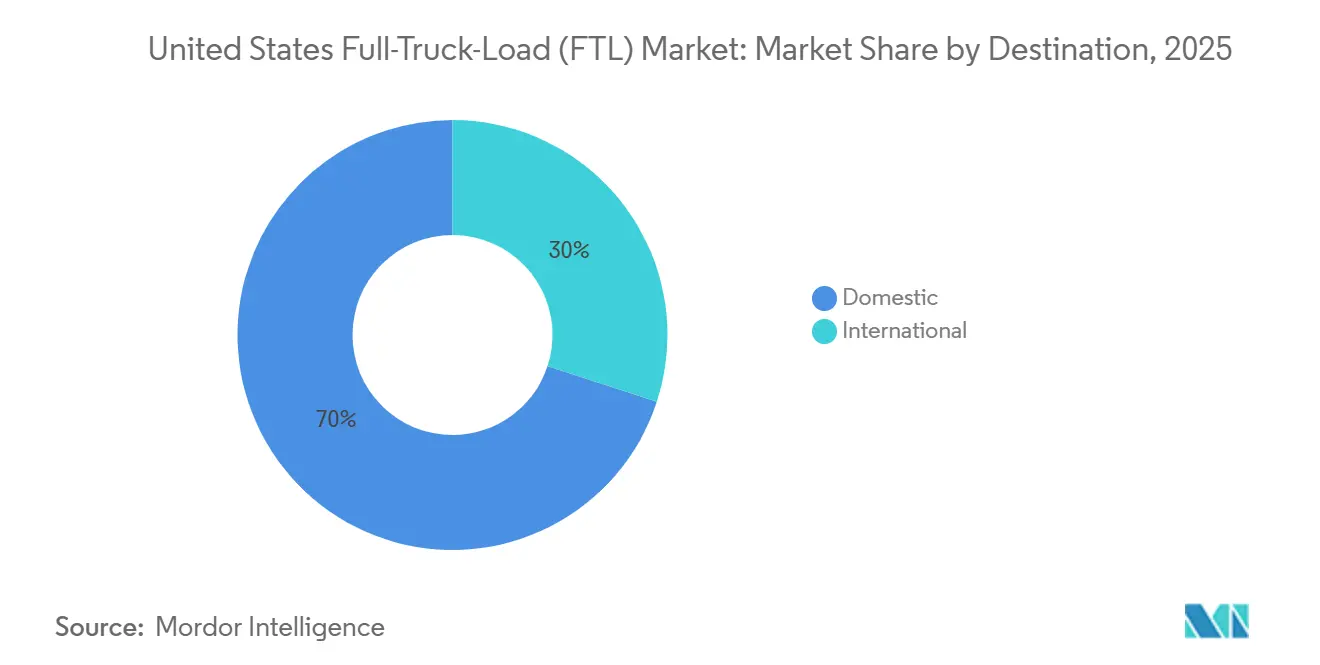
- By destination, domestic shipments commanded 69.97% of the United States full-truck-load market size in 2025; international lanes are advancing at a 5.51% CAGR between 2026-2031.
Note: Market size and forecast figures in this report are generated using Mordor Intelligence’s proprietary estimation framework, updated with the latest available data and insights as of 2026.
United States Full-Truck-Load (FTL) Market Trends and Insights
Drivers Impact Analysis*
| Driver | (~) % Impact on CAGR Forecast | Geographic Relevance | Impact Timeline |
|---|---|---|---|
| USMCA-driven cross-border freight surge | +0.8% | Texas, Arizona, and California border regions | Long term (≥ 4 years) |
| Omnichannel grocery and fresh-produce boom | +0.7% | Nationwide metro and suburban clusters | Medium term (2-4 years) |
| Rise of digital freight marketplaces & APIs | +0.5% | National high-volume corridors | Short term (≤ 2 years) |
| Federal alternative-fuel incentives | +0.4% | California, Northeast, national fleets | Medium term (2-4 years) |
| Renewable-energy component haulage demand | +0.3% | Wind corridor, Southwest solar belt, battery hubs | Long term (≥ 4 years) |
| AI-based load-optimization consolidation | +0.4% | Dense manufacturing and distribution regions | Short term (≤ 2 years) |
| Source: Mordor Intelligence | |||


USMCA-Driven Cross-Border Freight Surge
Duty-free rules and streamlined customs formalities under USMCA have turned Mexico into the top United States trading partner, with bilateral trade surpassing USD 800 billion in 2024. Automotive nearshoring concentrates lanes between Monterrey and United States assembly plants, rewarding carriers that hold both United States DOT and Mexican SCT authority. Texas gateways at Laredo, El Paso, and Brownsville now process more than 40% of truck crossings, prompting carriers to deploy cross-docks and drayage pools on either side of the border. Higher Mexican wage rules shrink pure cost arbitrage, yet proximity advantages and supply-chain resilience keep north-south volumes rising through 2031. J.B. Hunt leverages rail-assisted intermodal service to combine security with truck-competitive transit, carving out defensible margin niches. These capabilities create moat-like barriers that smaller fleets find difficult to breach[1].U.S. Department of Energy, “Inflation Reduction Act Commercial Clean Vehicle Credit,” energy.gov
Omnichannel Grocery and Fresh Produce Distribution Boom
Retail grocers are rewriting replenishment models around daily multi-temperature drops that favor full truckloads over traditional mixed-case LTL. Walmart runs more than 4,600 stores with synchronized delivery windows, lifting nationwide refrigerated tender counts. Fresh categories impose tight dwell limits, so carriers invest in remote temperature telemetry and FSMA training to protect rate premiums of 15-25% over dry-van contracts. Kroger’s Ocado-powered fulfillment centers require continuous inbound FTL flows of perishables before launching final-mile vans, intensifying demand for dedicated reefers in Ohio, Florida, and Texas. Direct-store-delivery adoption also multiplies stop counts per tractor day, a pattern that tech-enabled routing tools help absorb without inflating labor hours. Collectively, food-chain dynamics underpin the medium-term lift to the United States full-truck-load market.
Rise of Digital Freight Marketplaces and API Connectivity
API-linked platforms now let shippers bypass phone or email rate discovery, shrinking booking cycles from hours to minutes. Uber Freight and C.H. Robinson’s Navisphere algorithmically match lane preferences, equipment specs, and historical on-time scores, commoditizing low-complexity loads while freeing brokers to focus on value-added exceptions. Smaller fleets gain nationwide exposure without a captive sales staff, though margin compression follows real-time price transparency. Micro-FTL consolidation features enable carriers to stitch complementary partials into single-stop loads, a practice that lifts loaded-mile ratios 5-10% and trims fuel expense 3-5%. As adoption deepens, technology becomes table-stakes for competing in the United States full-truck-load market.
Federal Alternative-Fuel Incentives Spurring Tractor Renewal
The IRA’s Commercial Clean Vehicle Credit of up to USD 40,000 per Class 8 unit narrows the cap-ex delta between battery-electric tractors priced at USD 350,000-450,000 and their diesel counterparts. California’s Advanced Clean Trucks rule accelerates OEM supply, requiring 40% zero-emission Class 8 sales by 2032. Penske’s regional pilots reveal electric fuel costs of USD 0.15-0.25 per mile versus USD 0.50-0.70 for diesel, validating payback in high-density short-haul lanes. Renewable natural-gas fleets supply a carbon-negative bridge option, supported by Clean Energy Fuels’ 600-station network. Such incentives quicken the replacement cycle, lowering maintenance spend and positioning eco-minded carriers for shipper preference.
Restraints Impact Analysis*
| Restraint | (~) % Impact on CAGR Forecast | Geographic Relevance | Impact Timeline |
|---|---|---|---|
| Post-pandemic inventory cycle volatility | -0.6% | Nationwide retail and consumer-goods lanes | Medium term (2-4 years) |
| FMCSA speed-limiter mandate compliance costs | -0.3% | All interstate corridors | Short term (≤ 2 years) |
| Escalating insurance premiums (nuclear verdicts) | -0.5% | High-litigation states: Florida, Texas, California | Long term (≥ 4 years) |
| Spare parts shortages extend downtime | -0.4% | Fleets operating the latest emissions-controlled equipment | Medium term (2-4 years) |
| Source: Mordor Intelligence | |||
Post-Pandemic Inventory Cycle Volatility
Retailers continue to overshoot and undershoot demand forecasts, swinging from overstocking to rapid destocking that whipsaws contract volumes. Target’s 2024 markdown blitz shrank tender counts for soft-goods carriers, illustrating how consumer sentiment shifts can drain lane density. Spot-rate exposure climbs during these lulls, squeezing small fleets dependent on transactional freight. Landstar’s agent model offers partial insulation by flexing capacity, yet its 2024-2025 revenue per load still retreated amid heavy bid cycles. Such unpredictability complicates tractor-trailer purchasing horizons within the United States full-truck-load industry.
FMCSA Speed-Limiter Mandate Compliance Costs
Proposed governors capping tractors at 65 mph could slice 50-80 daily miles, eating into revenue on long-haul lanes. Retrofits for older models cost USD 500-1,000 each, while driver pay grids tied to mileage would need recalibration to avoid turnover spikes. Werner’s modern fleet already embeds electronic limiters, cushioning compliance pain. Although slower cruising boosts fuel economy by roughly 6%, the net productivity drag still dims growth prospects for the United States full-truck-load market[2].Federal Motor Carrier Safety Administration, “Speed Limiter Proposals,” fmcsa.dot.gov
*Our forecasts treat driver/restraint impacts as directional, not additive. The impact forecasts reflect baseline growth, mix effects, and variable interactions.
Segment Analysis
By End-User Industry: Retail Momentum Overtakes Manufacturing Depth
With a 5.83% CAGR from 2026–2031, Wholesale & Retail Trade is the fastest-growing segment of the United States full-truck-load market share, while Manufacturing continues to hold the largest share at 32.56% of 2025 revenue. Retail’s expansion is driven by omnichannel store-pickup and same-day delivery models, which rely on frequent, temperature-controlled truckloads to replenish micro-fulfillment centers and urban dark stores. Amazon’s rapid warehouse expansion has pressured traditional chains to adopt just-in-time restocking, injecting consistent volume into grocery, apparel, and electronics lanes. Retailers’ demand for visibility and strict on-time performance further favors carriers capable of API-based, real-time location feeds.
Meanwhile, Manufacturing underpins the market with automotive, electronics, and industrial equipment flows, though load growth lags retail due to inventory rationalization and robotics-driven plant efficiency. Nearshoring shifts many tier-2 component moves south of the border, redirecting some domestic tonnage to cross-border categories. Construction sees episodic spikes from Infrastructure Investment and Jobs Act projects, and agriculture contributes seasonal surges during harvests. Together, diversified end-user demand stabilizes base volumes even as segment-specific CAGRs diverge.


By Destination: Cross-Border Lanes Outpace Domestic Staples
Domestic hauls, which accounted for 69.97% of the United States full-truck-load market size in 2025, remain the backbone of internal freight, while international shipments to Mexico and Canada are set to grow at a 5.51% CAGR, nearly double domestic expansion. E-commerce and grocery restocking continue to favor coast-to-coast dry-van and reefer circuits, generating predictable contract freight, though domestically focused fleets face intensifying competition that keeps margins closely tied to fuel-adjusted cost curves.
Cross-border lanes benefit from automotive, industrial machinery, and consumer-goods factories relocating south of the border, supporting premium pricing for bilingual drivers and CTPAT-compliant carriers. Schneider, J.B. Hunt, and other specialists are investing in Laredo and Monterrey logistics hubs to capture this accelerating segment of the United States full-truck-load market. Regulatory complexity and customs processes create barriers to entry, insulating incumbents and sustaining strong revenue per mile.
Geography Analysis
Texas dominates regional activity, fusing energy-sector moves with USMCA gateway volumes that funnel through Laredo, El Paso, and Brownsville. Deep pools of drayage and cross-dock capacity allow fleets to triangulate backhauls efficiently, sustaining above-average tractor utilization throughout the United States full-truck-load market. State grants supporting alternative-fuel corridors also accelerate electric and RNG tractor trials around Houston and Dallas.
The Southeast posts the fastest regional growth as foreign automakers and battery plants rise across Georgia, Tennessee, Alabama, and South Carolina. Infrastructure funding widens interstates and deepens port channels, shortening transit to Atlantic and Gulf gateways. Carriers that embed dedicated capacity near these plants secure multi-year contracts with predictable volumes, a hedge against spot-market volatility. California remains indispensable thanks to its import gateways at Los Angeles/Long Beach and its formidable agricultural export base. However, CARB emissions mandates, congestion tolling, and warehouse labor legislation raise compliance costs. Fleets offset expenses through drayage-to-inland transloads that reposition containers onto domestic trailers, protecting service reliability without dwelling in port queues.
The Midwest maintains steady tonnage from traditional automotive cores in Michigan and Ohio. Winter storms require investment in all-weather tires and engine block heaters, nudging operating costs above national averages. Yet abundant backhaul into consumer-rich East Coast markets keeps load balance favorable. The Northeast corridor generates dense but lower-margin freight given driver shortages and roadway constraints. Urban consolidation centers around New Jersey and eastern Pennsylvania reduce last-mile congestion, but carriers often impose accessorials to cover tolls and dwell. Alternative-fuel mandates foster early adoption of battery-electric box trucks for intra-metro hops, signaling a technology beachhead that could later expand to regional FTL legs[3].U.S. Department of Transportation, “Infrastructure Investment and Jobs Act Implementation,” transportation.gov
Competitive Landscape
Digitalization is eroding the moat traditionally held by top brokerages, but asset control still differentiates leaders in the United States full-truck-load market. J.B. Hunt’s integrated platform marries owned equipment with marketplace capacity, letting shippers toggle between assets, brokerage, and intermodal through a single API feed. Knight-Swift leverages scale economies to negotiate favorable equipment-purchase pricing and group insurance structures, partially shielding earnings from nuclear-verdict inflation.
Alternative-fuel adoption has become a bidding criterion for major CPG shippers. Werner’s 500-unit electric rollout, scheduled through 2027, already secures sustainability-linked contracts in West Coast supermarket lanes. Penske and Ryder exploit leasing models to de-risk technology transition for private fleets, broadening their value proposition beyond pure carrier services.
Consolidation remains active. DSV’s USD 15.9 billion purchase of DB Schenker positions the mega-forwarder to cross-sell surface capacity to its air-ocean clientele, intensifying competition for large enterprise contracts. Yet heavy cap-ex barriers keep thousands of regional and niche players viable, especially in temperature-controlled, heavy-haul, and cross-border niches where local knowledge trumps sheer size. Overall, rivalry is spirited but disciplined, anchored by capacity cycles and the rising cost of compliance[4]Financial Times, “DSV Completes DB Schenker Acquisition,” ft.com .
United States Full-Truck-Load (FTL) Industry Leaders
J.B. Hunt Transport, Inc.
Knight-Swift Transportation Holdings Inc.
Landstar System Inc.
Werner Enterprises Inc.
Schneider National Inc.
- *Disclaimer: Major Players sorted in no particular order

Recent Industry Developments
- February 2026: ArcBest is developing its ArcBest View™ transportation management platform (expected mid-2026) alongside advanced autonomous material handling and real-time visibility tools (Vaux suite), driving internal logistics innovation.
- January 2026: Werner completed the acquisition of dedicated trucking provider FirstFleet, Inc. for approximately USD 245 million.
- May 2025: J.B. Hunt, in collaboration with BNSF Railway and Grupo México Transportes (GMXT), expanded intermodal rail-road service into Mexico via “Quantum de México” – this enhances multimodal freight options linking major United States and Mexican logistics hubs.
- April 2025: Knight-Swift partnered with Netradyne to equip 15,500 trucks with advanced AI fleet safety tech (Driver•i systems) to enhance driver behavior monitoring and real-time feedback.


United States Full-Truck-Load (FTL) Market Report Scope
End User Industry
| Agriculture, Fishing, and Forestry |
| Construction |
| Manufacturing |
| Oil and Gas, Mining and Quarrying |
| Wholesale and Retail Trade |
| Others |
Destination
| Domestic |
| International |
| End User Industry | Agriculture, Fishing, and Forestry |
| Construction | |
| Manufacturing | |
| Oil and Gas, Mining and Quarrying | |
| Wholesale and Retail Trade | |
| Others | |
| Destination | Domestic |
| International |


Market Definition
- Agriculture, Fishing, and Forestry (AFF) - This end user industry segment captures the external (outsourced) logistics expenditure incurred by the AFF industry players on road freight transport service. The end user players considered are the establishments primarily engaged in growing crops, raising animals, harvesting timber, harvesting fish & other animals from their natural habitats and providing related support activities. Herein, across the value chain, Logistics Service Providers (LSPs) play a crucial role in acquisition, storage, handling, transportation, and distribution activities for the optimal & continuous flow of inputs (seeds, pesticides, fertilizers, equipment, and water) from manufacturers or suppliers to the producers and smooth flow of output (produce, agro-goods) to distributors/ consumers. This includes both termperature controlled and non-temperature controlled logistics, as and when required according to the shelf life of goods being transported or stored.
- Construction - This end user industry segment captures the external (outsourced) logistics expenditure incurred by the construction industry players, on road freight transport service. The end user players considered are the establishments primarily engaged in constructing, repairing and renovating residential & commercial buildings, infrastructure, engineering works, subdividing and developing land. Logistics Service Providers (LSPs) play a crucial role in increasing profitability of construction projects by maintaing the inventory of raw materials & equipment, time-critical supplies and by providing other value added services for effective project management.
- Containerized Road Freight Transport - The segment captures the external (outsourced) logistics expenditure incurred by the road freight transport service end users on Full-Truck-Load (FTL) services. FTL road freight transport is characterized as a full single load not combined with other shipments. It comprises of shipments (i) devoted to the goods of a single shipper (ii) taken directly from a point of origin to one or more destination points (iii) comprising of bulk mail truck transportation (iv) comprising of both Container (Full Container Load, FCL)/Non-Container trucking services (v)comprsing of goods requiring temperature controlled or non-temperature controlled transportation services (vi) comprising of bulk liquid tankering (vii) invoving trucking of waste (viii) hazardous material trucking. Related value added services (VAS) of sorting, consolidation, deconslidation are included in the other services segment of freight and logistics market.
- Export Trends and Import Trends - Overall logistics performance of an economy is positively and significantly (statistically) correlated to its trade performance (exports and imports). Hence, in this industry trend, total value of trade, major commodities/ commodity groups and the major trade partners, for the studied geography (country or region as per the scope of report) have been analysed alongside the impact of major trade/logistics infrastructure investments & regulatory environment.
- Fluid Goods - The segment captures the external (outsourced) logistics expenditure incurred by the road freight transport service end users for the transport of bulk liquids, that are often used in extraction, manufacturing, food processing, agriculture industries among others. It includes transportation of liquids like (i) Chemicals/ hazardous goods (for instance acids) (ii) Water (potable as well as waste) (iii) Oil and gas (upstream as well as downstream like gasoline, fuel, crude oil, or propane), (iv) Food grade bulk liquids (like milk, or juice), (v) Rubber, (vi) Agrichemical products, among others. These goods are generally transported through tanker trucking.
- Fuel Price - Fuel price spikes can cause delays and diruption for logistics service providers (LSPs), while drops in the same can result in higher short-term profitability and increased market rivalry to offer consumers with the best deals. Hence, the fuel price variations have been studied over the review period and presented along with the causes as well as market impacts.
- Full-Truck-Load (FTL) Road Freight Transport - The segment captures the external (outsourced) logistics expenditure incurred by the road freight transport service end users on Full-Truck-Load (FTL) services. FTL road freight transport is characterized as a full single load not combined with other shipments. It comprises of shipments (i) devoted to the goods of a single shipper (ii) taken directly from a point of origin to one or more destination points (iii) comprising of bulk mail truck transportation (iv) comprising of both Container (Full Container Load, FCL)/Non-Container trucking services (v)comprsing of goods requiring temperature controlled or non-temperature controlled transportation services (vi) comprising of bulk liquid tankering (vii) invoving trucking of waste (viii) hazardous material trucking. Related value added services (VAS) of sorting, consolidation, deconslidation are included in the other services segment of freight and logistics market.
- GDP Distribution by Economic Activity - Nominal Gross Domestic Product and distribution of the same, across major economic sectors in the geography studied (country or region as per scope of the report) have been studied and presented in this industry trend. As GDP is positively related to the profitability and growth of logistics industry, this data has been used in adjunction to the input-output tables/ supply-use tables for analyzing the potential major contributing sectors towards the logistics demand.
- GDP Growth by Economic Activity - Growth of Nominal Gross Domestic Product across major economic sectors, for the geography studied (country or region as per scope of the report) have been presented in this industry trend. This data has been utilized for assessing the growth of logistics demand from all the market end users (economic sectors considered here).
- Inflation - Variations in both Wholesale Price Inflation (YoY change in producer price index) and Consumer Price Inflation have been presented in this industry trend. This data has been used to assess the inflationary environment as it plays a vital role in smooth functioning of the supply chain, directly impacting the logistics operational cost components e.g., pricing of tyres, driver wages & benefits, energy/fuel prices, maintenace costs, toll charges, warehousing rents, custom brokerage, forwarding rates, courier rates etc. hence impacting the overall freight and logistics market.
- Key Industry Trends - The report section named "Key Industry Trends" include all the key variables/parameters studied to better analyze the market size estimates and forecasts. All the trends have been presented in the form of data points (time series or latest available data points) along with analysis of the paramter in the form of concise market relevant commentary, for the geography studied (country or region as per the scope of report).
- Key Strategic Moves - The action taken by a company to differentiate from its competitor or used as a general strategy is referred to as a key strategic move (KSM). This includes (1) Agreements (2) Expansions (3) Financial Restructuring (4) Mergers and Acquisitions (5) Partnerships, and (6) Product Innovations. Key players (Logistics Service Providers, LSPs) in the market have been shortlisted, their KSM have been studied and presented in this section.
- Less than-Truck-Load (LTL) Road Freight Transport - The segment captures the external (outsourced) logistics expenditure incurred by the road freight transport service end users on Less than-Truck-Load (LTL) services. LTL road freight transport is characterized as multiple shipments combined onto a single truck for multiple deliveries within a network. It comprises of establishments (i) primarily engaged in general and specialized freight trucking of less than complete truck-loads, (ii) characterized by the use of terminals to consolidate shipments, generally from several shippers, into a single truck for haulage between a load assembly terminal and a disassembly terminal, where the load is sorted and shipments are re-routed for delivery (iv) Less than-Container-Load (LCL) shipping/ Groupage Shipping in case of trucking services. The activities in scope include (i) local pick-up, (ii) line-haul, and (iii) local delivery. Related value added services (VAS) of sorting, consolidation, deconslidation are included in the other services segment of freight and logistics market.
- Logistics Performance - Logistics Performance and Logistics Costs are the backbone of trade, and influences trade costs, making countries compete globally. Logistics performance is influenced by market wide adopted supply chain management strategies, government services, investments & policies, fuel/ energy costs, inflationary environment etc. Hence, in this industry trend, the logistics performance of the geography studied (country/ region as per the scope of report) has been analysed and presented over the review period.
- Major Truck Suppliers - Market share of truck brands is influenced by factors like geographical preferences, portfolio of truck types, truck prices, local production, truck repair & maintenance service peneteration, customer support, technological innovations (like electric vehicles, digitalization, autonomous trucks), fuel efficiency, financing options, annual maintenance costs, availability of substitutes, marketing startegies etc. Hence, the distribution (share % for base year of the study) of truck sales volume for leading truck brands and commentary on current market scenario & market anticipation over the forecast period have been presented in this industry trend.
- Manufacturing - This end user industry segment captures the external (outsourced) logistics expenditure incurred by the Manufacturing industry players, on road freight transport service. The end user players considered are the establishments primarily engaged in the chemical, mechanical or physical transformation of materials or substances into new products. Logistics Service Providers (LSPs) play a crucial role in maintaining a smooth flow of raw materials across the supply chain, enabling timely delivery of finished goods to distributors or end customers and storing & supplying the raw materials to clients for just-in-time manufacturing.
- Modal Share - Freight Modal Share is influenced by factors like modal productivity, government regulations, containerization, distance of shipment, temperature control requirements, type of goods, international trade, terrain, speed of delivery, shipment weight, bulk shipments, etc. Also, modal share by tonnage (tons) and modal share by freight turnover (ton-km) differ as per average distance of shipments, weight of major commodity groups transported in the economy and number of trips. This industry trend represents the distribution of freight transported by mode of transport (tons as well as ton-km), for the study base year.
- Oil and Gas, Mining and Quarrying - This end user industry segment captures the external (outsourced) logistics expenditure incurred by the extraction industry players, on road freight transport service. The end user players considered are the establishments that extract naturally occurring mineral solids, such as coal and ores; liquid minerals, such as crude petroleum; and gases, such as natural gas. Logistics Service Providers (LSPs) covers entire phases from upstream to downstream and plays a crucial role in the transportation of machinery, drilling equipments, extracted minerals, crude oil & natural gas and refined/ processed products from one place to another.
- Other End Users - Other end user segment captures the external (outsourced) logistics expenditure incurred by the financial services (BFSI), real estate, educational services, healthcare, and professional services (administrative, waste management, legal, architectural, engineering, design, consulting, scientific R&D), on road freight transport service. Logistics Service Providers (LSPs) plays a crucial role in the reliable movement of supplies and documents to/from these industries such as transporting any equipment or resources required, shipping confidential documents and files, movement of medical goods & supplies (surgical supplies and instruments, including gloves, masks, syringes, equipment) to name a few.
- Producer Price Inflation - It indicates inflation from viewpoint of the producers viz. the average selling price received for their output over a period of time. Annual change (YoY) of producer price index is reported as wholesale price inflation in the "Inflation" industry trend. As WPI captures dynamic price movements in most comprehensive way, it is widely used by governments, banks, industry, business circles and is deemed important in formulation of trade, fiscal and other economic policies. The data has been used in adjunction to consumer price inflation for better understanding the inflationary environment.
- Road Freight Pricing Trends - Freight pricing by mode of transport (USD/tonkm), over the review period, has been presented in this industry trend. The data has been used in assessing the inflationary environment, impact on trade, freight turnover (tonkm), road freight transport market demand and hence the road freight transport market size.
- Road Freight Tonnage Trends - Freight tonnage (weight of goods in tons) handled by mode of transport, over the review period, has been presented in this industry trend. The data has been used as one of the parameters apart from average distance per shipment (km), freight volume (tonkm), and freight pricing (USD/tonkm) to assess the freight transport market size.
- Road Freight Transport - Hiring a road freight transport logistics service provider (LSP) or haulier (outsourced logistics), for the transport of commodities constitutes road freight transport market. The scope of study includes (i) road transport of goods reported by hauliers registered in the reporting countries (ii) transport of raw materials or manufactured goods (solids as well as fluids) (iii) transport using commerical motor vehicles (rigid trucks or tractor-trailers, (iv) Full-Truck-Load (FTL) or Less than-Truck-Load (LTL) transport (v) containerized or non-containerized transport (vi) temperature controlled or non-temperature controlled trasnport, (vii) short haul or long haul (Over-the-road, OTR) transport, (viii) used office or household goods transport (movers and packers), (ix) other specialized cargo transport (dangerous goods, oversized cargo) and (x) outsourced first mile/ middle mile/last mile delivery shipments undertaken by road freight transport players. The scope does not include (i) transport undertaken by hauliers registered in other countries (ii) last mile meal delivery market (iii) grocery delivery market (iv) transportation via road network undertaken/ reported by Courier, Express, and Parcel (CEP) players.
- Road Length - As infrastructure plays a vital role in an economy's logistics performance, variables like length of roads, distribution of road length by surface category (paved v/s unpaved), distribution of road length by road classification (expressways v/s highways v/s other roads), have been analysed and presented in this industry trend.
- Segmental Revenue - Segmental Revenue has been triangulated or computed and presented for all the major players in the market. It refers to the road freight transport market specific revenue earned by the company, over the base year of study, in the geography studied (country or region as per the scope of report). It is computed through the study and analysis of major parameters like financials, service portfolio, employee strength, fleet size, investments, number of countries present in, major economies of concern, etc. that have been reported by the company in its annual reports, webpage. For companies having scarce financial disclosures, paid databases like D&B Hoovers, Dow Jones Factiva have been resorted to and verified through industry/expert interactions.
- Short Haul Road Freight Transport - The segment captures the external (outsourced) logistics expenditure incurred by the road freight transport service end users on local trucking (less than 100 miles). It includes the road transport of goods (i) within a single administrative area and its hinterland, (ii) by smaller trucks and pickup trucks (iii) via containerized as well as dry bulk services (iv) intermodal from ports, container terminals or airports, and (v) outsourced first mile/ last mile delivery shipments undertaken by road freight transport players.
- Transport and Storage Sector GDP - Value and growth of Transport and Storage Sector GDP has a direct relation to the freight and logistics market size, and hence road freight transport market size. Therefore, this variable has been studied and presented over the review period, in value terms (USD) and as share % of total GDP, in this industry trend. The data has been supported by concise and relevant commentary around the investments, developments, and current market scenario.
- Trends in E-Commerce Industry - Enhanced internet connectivity and boom in smartphone penetration, coupled with increasing disposable incomes, has led to a phenomenal growth in the e-commerce market globally. Online shoppers require fast and efficient delivery of their orders leading to an increase in the demand for logistics services especially e-commerce fulfilment services. Hence, the Gross Merchandise Value (GMV), historial and projected growth, breakup of major commodity groups in e-commerce industry for the studied geography (country or region as per scope of the report) have been analysed and presented in this industry trend.
- Trends in Manufacturing Industry - Manufacturing industry involves the transformation of raw materials into finished products, while logistics industry ensures the efficient flow of raw materials to the factory, and the transport of manufactured products to the distributors & consumers. Demand-Supply of both industries are highly cross-linked and critical for a seamless supply chain. Hence, the Gross Value Added (GVA), breakup of GVA into major manufacturing sectors, and growth of manufacturing industry over the review period have been analysed and presented, in this industry trend.
- Trucking Fleet Size By Type - Market share of truck types is influenced by factors like geographical preferences, major end user industries, truck prices, local production, truck repair & maintenance service peneteration, customer support, technological disruptions (like electric vehicles, digitalization, autonomous trucks) etc. Hence, the distribution (share % for base year of study) of truck parc volume by type of truck, market disruptors, truck manufacturing investments, truck specifications, truck use & import regulations, and market anticipation over the forecast period have been presented in this industry trend.
- Trucking Operational Costs - The prime reasons for measuring/ benchmarking logistics performance of any trucking company are to reduce operational costs and increase profitability. On the other hand, measuring operational costs helps to identify whether and where to make operational changes to control expenses and identify areas for improved performance. Hence, in this industry trend, trucking operational costs and the variables involved viz. driver wages & benefits, fuel prices, repairs & maintenance costs, tyre costs etc. have been studied over the base year of study, and presented for the geography studied (country or region as per the scope of report).
- Wholesale and Retail Trade - This end user industry segment captures the external (outsourced) logistics expenditure incurred by the wholesalers and retailers, on road freight transport service. The end user players considered are the establishments primarily engaged in wholesaling or retailing merchandise, generally without transformation, and rendering services incidental to the sale of merchandise. Logistics Service Providers (LSPs) plays a crucial role in the reliable movement of supplies to and finished products from production houses to the distributors and finally to the end customer covering activites like material sourcing, transportation, order fulfillment, warehousing & storage, demand forecasting, inventory management etc.
| Keyword | Definition |
|---|---|
| Cabotage | Road transport by a motor vehicle registered in a country performed on the national territory of another country. |
| Cross Docking | Cross docking is a logistics procedure where products from a supplier or manufacturing plant are distributed directly to a customer or retail chain with marginal to no handling or storage time. Cross docking takes place in a distribution docking terminal; usually consisting of trucks and dock doors on two (inbound and outbound) sides with minimal storage space. The name ‘cross docking’ explains the process of receiving products through an inbound dock and then transferring them across the dock to the outbound transportation dock. |
| Cross Trade | International road transport between two different countries performed by a road motor vehicle registered in a third country. A third country is a country other than the country of loading/embarkation and than the country of unloading/disembarkation. |
| Dangerous Goods | The classes of dangerous goods carried by Road are those defined by the fifteenth revised edition of the UN Recommendations on the Transport of Dangerous Goods, United Nations, Geneva 2007. They include Class 1: Explosives; Class 2: Gases; Class 3: Flammable Liquids; Class 4: Flammable solids- substances liable to spontaneous combustion; substances which, on contact with water, emit flammable gases; Class 5: Oxidizing substances and organic peroxides; Class 6: Toxic and infectious substances; Class 7: Radioactive material and Class 8: Corrosive substances, Class 9: Miscellaneous dangerous substances and articles. |
| Direct Shipment | Direct shipment is a method of delivering goods from the supplier or the product owner to the customer directly. In most cases, the customer orders the goods from the product owner. This delivery scheme reduces transportation and storage costs, but requires additional planning and administration. |
| Drayage | A drayage is a form of trucking service that connects the different modes of shipping (intermodal), such as ocean freight or air freight. It’s a short-haul trip that transports goods from one place to another, usually before or after its long-haul shipping process. Drayage trucks move cargo to and from various destinations, such as container ships, storage lots, order fulfillment warehouses, and rail yards. Typically, drayage only transports goods in short distances and operates only in one metropolitan area. It also requires only one trucker in a single shift. But despite this, but it plays an important role in long-haul shipping because it gets the goods to the cargo and vice versa. It makes intermodal transport much more efficient and enables the seamless transfer of goods to the end customer. |
| Dry van | A dry van is a type of semi-trailer that's fully enclosed to protect shipments from outside elements. Designed to carry palletized, boxed or loose freight, dry vans aren't temperature-controlled (unlike refrigerated “reefer” units) and can't carry oversized shipments (unlike flatbed trailers). |
| Final Demand | Final demand includes all types of commodities (goods as well as services) consumed as final use and might include personal consumption, or consumption by government, by businesses as capital investment, and as exports. includes all types of commodities (goods as well as services) consumed as final use and might include personal consumption, or consumption by government, by businesses as capital investment, and as exports. |
| Flatbed Truck | A flatbed truck is a type of truck with rigid design. It has a back body that is flatly shaped for easy loading and unloading of goods. The flatbed truck is mostly used to transport heavy, oversized, wide and indelicate goods such as machinery, building supplies or equipment. Due to the truck open body, the goods transported with it must not be vulnerable to rain. By functionality, the flatbed truck is comparable to a flatbed trailer. |
| Inbound Logistics | Inbound logistics is the way materials and other goods are brought into a company. This process includes the steps to order, receive, store, transport and manage incoming supplies. Inbound logistics focuses on the supply part of the supply-demand equation. |
| Intermediate Demand | Intermediate demand includes goods, services, and maintenance and repair construction sold to businesses, excluding capital investment. |
| International Loaded | Place of loading of goods in reporting country (i.e., country in which the vehicle performing the transport is registered) and place of unloading in a different country. |
| International Unloaded | Place of unloading of goods in reporting country (i.e., country in which the vehicle performing the transport is registered) and place of loading in a different country. |
| OOG cargo | Out of Gauge (OOG) cargo is any cargo that can not be loaded into six-sided shipping containers simply because it is too large. The term is a very loose classification of all cargo with dimensions beyond the maximum 40HC container dimensions. That is a length beyond 12.05 meters – a width beyond 2.33 meters – or a height beyond 2.59 meters. |
| Pallets | Raised platform, intended to facilitate the lifting and stacking of goods. |
| Part load | A part load describes goods which only fills a truck partially. In essence, the quantity of the shipment is bigger than the Less Than Truckload (LTL) shipment. Also, the shipment cannot fully occupy a truck i.e. its capacity is much lower than a Full Truckload (FTL) shipment. |
| Paved Road | Road surfaced with crushed stone (macadam) with hydrocarbon binder or bituminized agents, with concrete or with cobblestone. |
| Reverse Logistics | Reverse logistics comprises of the sector of supply chains that process anything returning inwards through the supply chain or traveling ‘backward’ through the supply chain. |
| Road Freight Transport Service | Hiring a trucking agency for transport of commodities (raw materials or manufactured goods including both solids and liquids) form the origin to a destination within the country (domestic) or cross-border (international) constitutes road freight transport market. The service might be Full-Truck-Load or Less than-Truck-Load, containerized or non-containerized, temperature controlled or non temperature controlled, short haul or long haul. |
| Tautliner vehicle | Tautliner and curtainsider are used as generic names for curtain sided trucks/trailers. The curtains are permanently fixed to a runner at the top and detachable rails/poles at front and rear, allowing the curtains to be drawn open and forklifts used all along the sides for easy and efficient loading and unloading. When closed for travel, vertical load restraint straps are attached to a rope rail beneath the truck bed, connecting the truck bed and curtain along both sides. Winches at either end of the curtain tension it, hence the 'Tautliner' name. This stops the curtain from flapping or drumming in the wind and can also help retain light loads from slipping sideways. |
| Transport for hire or reward | The carriage for remuneration of goods. |
| Unpaved Road | Road with a stabilized base not surfaced with crushed stone, hydrocarbon binder or bituminized agents, concrete or cobblestone. |


Research Methodology
Mordor Intelligence follows a four-step methodology in all our reports.
- Step-1: Identify Key Variables: In order to build a robust forecasting methodology, the variables and factors identified in Step-1 are tested against available historical market numbers. Through an iterative process, the variables required for market forecast are set and the model is built on the basis of these variables.
- Step-2: Build a Market Model: Market-size estimations for the forecast years are in nominal terms. Inflation is considered to be a part of the pricing, and the average selling price (ASP) is varying throughout the forecast period for each country
- Step-3: Validate and Finalize: In this important step, all market numbers, variables and analyst calls are validated through an extensive network of primary research experts from the market studied. The respondents are selected across levels and functions to generate a holistic picture of the market studied.
- Step-4: Research Outputs: Syndicated Reports, Custom Consulting Assignments, Databases & Subscription Platforms


