Market Overview
| Study Period | 2019 - 2031 |
|---|---|
| Forecast Data Period | 2026 - 2031 |
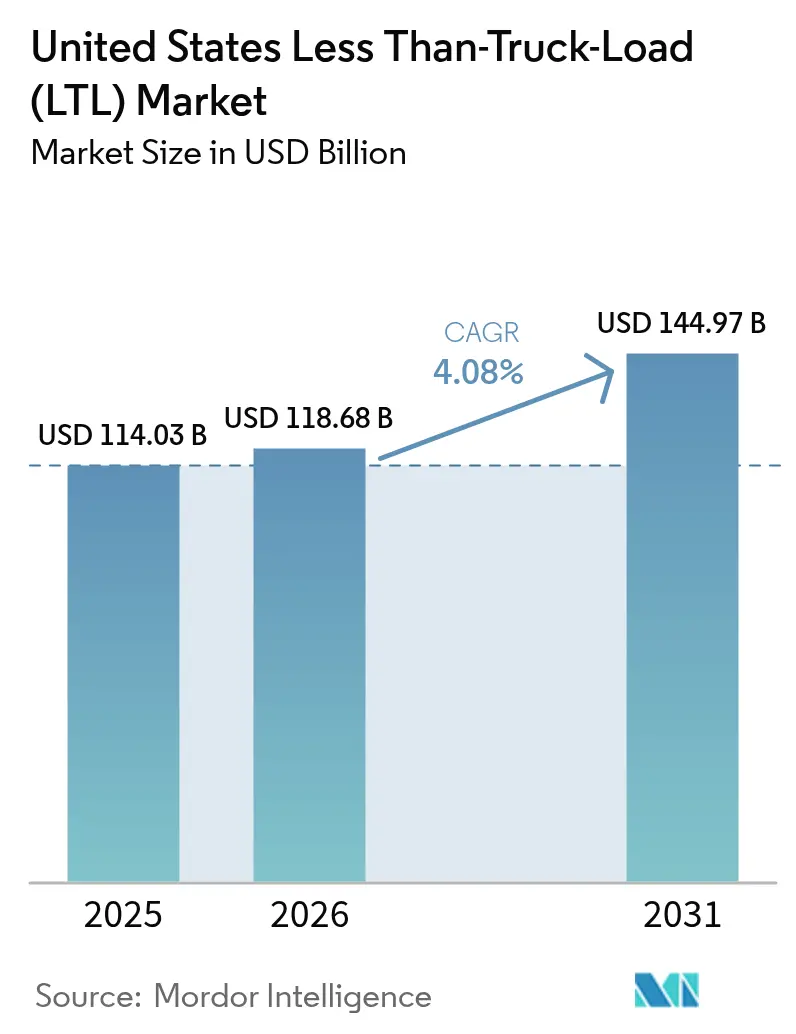
| Base Year Market Size (2025) | USD 114.03 Billion |
| Market Size (2026) | USD 118.68 Billion |
| Market Size (2031) | USD 144.97 Billion |
| Growth Rate (2026 - 2031) | 4.08% CAGR |
| Market Concentration | Low |
Major Players *Disclaimer: Major Players sorted in no particular order Image © Mordor Intelligence. Reuse requires attribution under CC BY 4.0. | |
United States Less Than-Truck-Load (LTL) Market Analysis by Mordor Intelligence
The United States Less than-Truck-Load market size in 2026 is estimated at USD 118.68 billion, growing from 2025 value of USD 114.03 billion with 2031 projections showing USD 144.97 billion, growing at 4.08% CAGR over 2026-2031. E-commerce fulfillment, reshoring of domestic manufacturing, and omnichannel retail strategies are re-shaping shipment profiles, while capacity constraints in tier-1 metropolitan terminals have elevated average warehouse lease rates above USD 8 per square foot in markets such as Los Angeles and New Jersey. Rising labor costs linked to driver shortages, energy price volatility, and heightened consolidation following Yellow Corporation’s 2023 exit are intensifying competitive dynamics and encouraging regional carriers to acquire terminals released by the bankruptcy estate. Investments authorized under the Infrastructure Investment and Jobs Act (IIJA) are earmarked for truck-only lanes and port upgrades that will enhance network fluidity, yet near-term service reliability remains sensitive to East and Gulf Coast labor disruptions that periodically reroute freight flows. Collectively, these factors reinforce the resilience of the United States Less than-Truck-Load market as shippers favor mode flexibility, granular visibility, and technology-enabled pricing models.
Key Report Takeaways
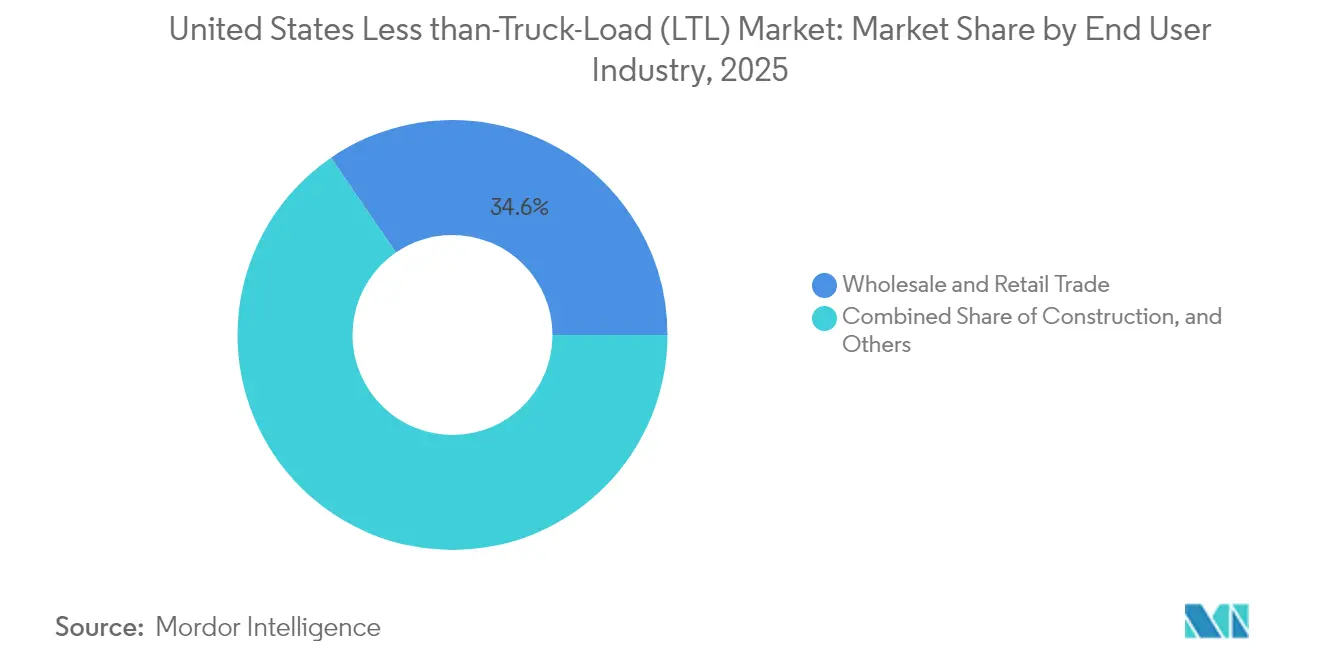
- By end-user industry, Wholesale and Retail Trade led with 34.56% revenue share of the United States Less than-Truck-Load market share in 2025 and is projected to expand at a 5.13% CAGR through 2031.
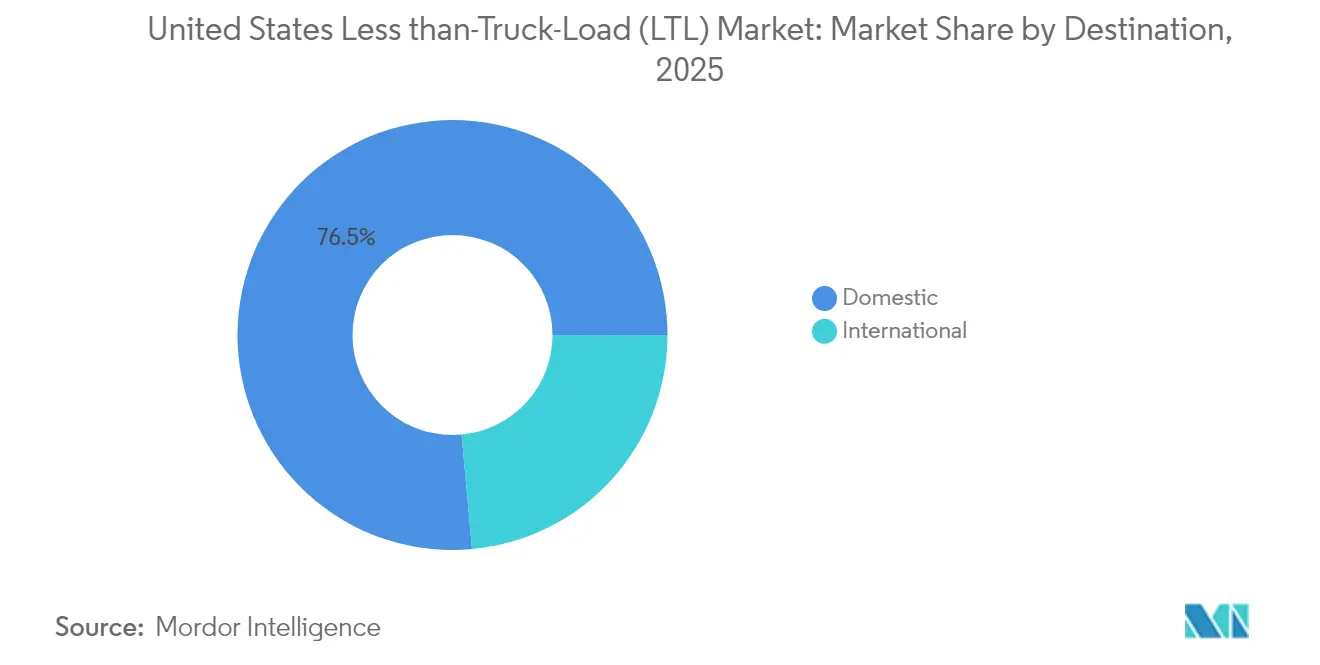
- By destination, the domestic segment held 76.45% of the United States Less than-Truck-Load market share in 2025, while international shipments are advancing at a 4.21% CAGR through 2031.
- By company concentration, the top 5 carriers commanded 50% of the United States Less than-Truck-Load market share in 2023; the top 10 controlled 75% of total revenue.
Note: Market size and forecast figures in this report are generated using Mordor Intelligence’s proprietary estimation framework, updated with the latest available data and insights as of 2026.
United States Less Than-Truck-Load (LTL) Market Trends and Insights
Drivers Impact Analysis*
| Driver | (~) % Impact on CAGR Forecast | Geographic Relevance | Impact Timeline |
|---|---|---|---|
| E-commerce fulfillment growth | +1.2% | National, with concentration in major metro areas | Medium term (2-4 years) |
| Reshoring-led domestic manufacturing rebound | +0.8% | National, with early gains in Texas, Mexico border states | Long term (≥ 4 years) |
| Omnichannel retail network optimization | +0.6% | National, urban retail markets | Medium term (2-4 years) |
| Urban retail real-estate repurposed into cross-dock micro-hubs | +0.4% | Major metropolitan areas, Tier-1 cities | Short term (≤ 2 years) |
| API-enabled parcel-to-LTL mode shift for SMB shippers | +0.3% | National, technology-enabled markets | Medium term (2-4 years) |
| Truck-only lane investments under IIJA boosting LTL transit reliability | +0.5% | National highway corridors, freight-intensive routes | Long term (≥ 4 years) |
| Source: Mordor Intelligence | |||


E-commerce Fulfillment Growth
United States retail e-commerce sales surpassed USD 1 trillion in 2024, prompting retailers to position inventory within one- to two-day ground zones around dense population centers. This geographic dispersion increases the frequency of medium-weight shipments unsuitable for parcel networks, thereby enlarging the addressable base of the United States Less than-Truck-Load market. Carriers such as PITT OHIO apply artificial-intelligence-driven route optimization to reduce labor costs by 25% and sharpen service windows. Residential deliveries of furniture, appliances, and office equipment yield higher margins when carried through specialized LTL final-mile services, encouraging ongoing investment in lift-gate equipment and white-glove capabilities. Cross-border e-commerce related to nearshoring further lifts volumes as Mexican-origin goods flow north into metropolitan delivery zones. As retailers seek consistent two-day performance at competitive rates, the United States Less than-Truck-Load market will remain integral to omnichannel fulfillment strategies across 2025-2030[1]“PITT OHIO Harnesses AI for Network Efficiency,” The Trucker, thetrucker.com .
Reshoring-Led Domestic Manufacturing Rebound
Federal industrial incentives exceeding USD 910 billion stimulate the onshoring of automotive, aerospace, medical device, and electronics production, concentrating activity along the Interstate 35 corridor and similar arteries. Mexico ascended to the United States’ top trading partner position in 2024, raising cross-border truck traffic that benefits LTL carriers adept at customs documentation and border drayage. Averitt’s 85,000 ft² San Antonio expansion featuring 80 cross-dock doors typifies asset deployment aimed at capturing this surge. Predictable component flows from nearshore plants allow density gains, translating into superior network economics and pricing leverage for carriers with strategically located terminals. The United States Less than-Truck-Load market consequently deepens its role in regionalized supply chains designed for resilience against trans-Pacific disruptions[2]“Urban Real-Estate Costs Reshape Distribution,” TT News, ttnews.com .
Omnichannel Retail Network Optimization
Retailers are moving from hub-and-spoke distribution to mesh networks that integrate regional distribution centers, micro-fulfillment nodes, and store-based fulfillment. The model drives a steady cadence of store replenishment, inventory transfers, and large-parcel home delivery that rely on the United States Less than-Truck-Load market for flexibility. Shippers use application-program-interface (API) links to obtain real-time pricing and capacity, favoring carriers offering dynamic lane-based discounts. Advanced visibility platforms inform inventory orchestration, ensuring high in-stock rates without overpositioning. Carriers embracing digital connectivity secure stickier contracts, higher utilization, and balanced lane density ingredients needed to sustain profitable growth at mid-single-digit CAGR.
Urban Retail Real-Estate Repurposed into Cross-Dock Micro-Hubs
Former big-box stores and underutilized malls in cities such as Chicago, New York, and Los Angeles are converting into micro-fulfillment facilities ranging from 10,000 to 50,000 square feet. High lease rates demand rapid inventory turnover that favors frequent LTL replenishment over full truckload. Port-supported upgrades such as the USD 54.2 million Husky Terminal improvements in Tacoma—shorten dwell time and accelerate inland distribution. Zoning reforms permitting logistics activity in commercial districts also enable carriers to embed terminals closer to end customers, trimming accessorial expenses and boosting on-time service metrics. These micro-hubs, coupled with sophisticated appointment scheduling, expand same-day delivery coverage, reinforcing the relevance of the United States Less than-Truck-Load market within urban supply chains.
Restraints Impact Analysis*
| Restraint | (~) % Impact on CAGR Forecast | Geographic Relevance | Impact Timeline |
|---|---|---|---|
| Driver shortage and aging workforce | -0.9% | National, acute in rural and long-haul routes | Medium term (2-4 years) |
| Diesel-price volatility | -0.4% | National, higher impact on long-haul operations | Short term (≤ 2 years) |
| Acute terminal-capacity constraints in Tier-1 metros | -0.6% | Major metropolitan areas, coastal markets | Medium term (2-4 years) |
| Warehouse labor unionization ripple-effects | -0.3% | Regional, concentrated in unionized markets | Short term (≤ 2 years) |
| Source: Mordor Intelligence | |||
Driver Shortage and Aging Workforce
Drug and Alcohol Clearinghouse enforcement could remove up to 177,000 drivers, reducing the effective labor pool even as nearly one-third of current operators are near retirement age. Carriers counter by hiking pay—Averitt lifted hazmat driver rates from USD 0.60 to USD 0.64 per mile in 2025—and by channeling 20% of profits into employee retirement accounts to boost retention. Yet wage escalation inflates operating ratios, compelling carriers to refine linehaul planning, increase load factors, and introduce driver-assisting technology such as lane-keeping systems to lengthen career longevity. Persistent recruitment hurdles continue to weigh on the United States Less than-Truck-Load market growth trajectory despite healthy freight fundamentals[3]“FHWA Funds Mobile River Bridge,” TT News, ttnews.com.
Acute Terminal-Capacity Constraints in Tier-1 Metros
Average urban industrial lease rates above USD 8 per ft² in Los Angeles and New Jersey hinder capacity additions, forcing carriers to run dray loops that degrade service and elevate costs. Saia’s purchase of 28 Yellow terminals for USD 235.7 million illustrates the premium now attached to in-network doors in supply-constrained locales. Concurrent port labor actions such as the October 2024 strike affecting 36 East and Gulf Coast gateways—magnify congestion and extend dwell, further stressing terminal throughput. Although IIJA-funded expansions will yield structural relief, near-term scarcity of urban dock doors tempers the United States Less than-Truck-Load market’s ability to fully capitalize on rising shipment volumes[4]“Dockworker Strike Shuts Ports,” Los Angeles Times, latimes.com.
*Our forecasts treat driver/restraint impacts as directional, not additive. The impact forecasts reflect baseline growth, mix effects, and variable interactions.
Segment Analysis
By End User Industry: Wholesale Trade Drives Diversification
Wholesale and Retail Trade accounted for 34.56% of the United States less than-truck-load market size in 2025 and is advancing at a 5.13% CAGR between 2026-2031, outpacing every other vertical as retailers recalibrate inventory closer to consumption points. Manufacturing remains the second-largest contributor, buoyed by nearshoring that channels components northbound through inland hubs. Construction, Agriculture, and Energy add variability across seasons, yet together strengthen lane density in secondary markets where capacity would otherwise be imbalanced.
Retail fulfillment’s requirement for rapid restocking of micro-fulfillment and dark-store formats means medium-weight loads ride LTL more often than truckload or parcel. AI-enhanced demand sensing has trimmed inventory carrying costs for large chains, yet it raises shipment frequency, a factor that ultimately expands the United States Less than-Truck-Load market. Manufacturing traffic, especially auto parts and machinery, keeps south-to-north routes balanced, reducing empty miles and undergirding network economics. The United States Less than-Truck-Load industry thus maintains a stable revenue mix, mitigating sector cyclicality through vertical diversification.


By Destination: Cross-Border Acceleration Reshapes Networks
Domestic freight retained 76.45% of the United States less than-truck-load market size in 2025 thanks to ubiquitous hub-and-spoke coverage and deep route density. Yet international volumes, while smaller, are forecast to climb 4.21% CAGR between 2026-2031 as USMCA provisions streamline customs flows and Mexican factories ship heavier, high-value goods that prefer LTL over parcel.
Border-centric terminals in Laredo, El Paso, and San Diego are scaling dock doors, drop lots, and bilingual support teams to seize transnational demand. Higher revenue per hundredweight on cross-border moves improves margin mix, encouraging carriers to invest in CTPAT certification and real-time clearance technology. Accordingly, the United States Less than-Truck-Load market sees its international share expanding without cannibalizing domestic core lanes, fostering network synergies that raise overall asset utilization.
Geography Analysis
Regional dynamics shape cost structures and service propositions across the United States Less than-Truck-Load market. Coastal metros generate the densest freight but burden carriers with high real-estate and labor expenses, pushing lease rates beyond USD 8 per square foot in Los Angeles and New Jersey. The Southeast capitalizes on pro-business tax regimes, attracting fulfillment centers that draw steady LTL replenishment cycles. Texas dominates nearshoring corridors; the Interstate 35 spine channels Mexican output northward, elevating lane density for carriers equipped with border compliance expertise.
Midwestern hubs such as Chicago, Columbus, and Kansas City retain pivotal roles in consolidating east-west flows, leveraging intermodal gateways to optimize long-haul cost efficiency. However, demographic shifts toward Sunbelt states gradually redistribute demand southward, prompting carriers to rebalance terminal networks. IIJA-backed projects, including the USD 550 million Interstate 10 Mobile River Bridge, cut transit delays and bolster east-west reliability. Gulf Coast port enlargements exemplified by the Velasco Terminal expansion, give carriers alternative entry points when Atlantic labor issues flare, sustaining service consistency during high-volume seasons.
Regulatory diversity remains a wild card. California’s emissions mandates elevate capital outlay for zero-emission trucks, while Florida’s permissive stance accelerates cross-docking growth. Rural regions face acute driver scarcity that inflates wage premiums, whereas metropolitan areas encounter tighter warehouse labor markets. Nonetheless, the United States Less than-Truck-Load market maintains nationwide cohesion by leveraging technology-based visibility, centralized dispatch, and dynamic pricing that harmonize service levels across heterogeneous geographies.
Competitive Landscape
Yellow Corporation’s 2023 bankruptcy extracted USD 5 billion in annual capacity and catalyzed a scramble for scarce terminals. The market is moderately fragmented structure that still offers room for nimble regional entrants. Saia’s USD 235.7 million purchase of 28 Yellow properties, TFI International’s string of 11 United States acquisitions, and Knight-Swift’s entry via Dependable Highway Express illustrate a market where inorganic growth is indispensable to network expansion.
Technology defines the new battleground. Carriers deploy API-based instant rating, dynamic LTL load matching, and machine-learning arrival predictions to sharpen value propositions. FedEx’s decision to spin off its USD 9.1 billion LTL arm underscores the strategic premium placed on specialized focus and digital reinvention. Meanwhile, regional specialists differentiate through high-touch services, cross-border expertise, and industry-specific solutions like temperature-controlled short-haul. The United States Less than-Truck-Load industry thereby exhibits a duality: scale rewards density, yet specialization secures loyalty in niche lanes.
Regulatory compliance acts as both moat and cost center. Drug and Alcohol Clearinghouse adherence, CTPAT border security, and state emissions rules impose capital and administrative burdens that deter under-resourced newcomers. Established carriers leverage compliance infrastructure to protect share while lobbying for truck-parking grants and dedicated freight corridors under IIJA, ensuring that future infrastructure boosts align with their networks. These dynamics suggest sustained consolidation momentum tempered by the rise of tech-enabled disruptors targeting underserved small and mid-sized shippers.
United States Less Than-Truck-Load (LTL) Industry Leaders
FedEx
Old Dominion Freight Line
XPO, Inc.
Saia Inc.
ArcBest
- *Disclaimer: Major Players sorted in no particular order


Recent Industry Developments
- December 2024: FedEx announced plans to spin off FedEx Freight as an independent public company, a move expected to reconfigure competitive priorities.
- December 2024: Knight-Swift Transportation acquired Dependable Highway Express, enlarging its LTL footprint in key Western markets.
- November 2024: TFI International purchased Keystone Western, extending specialized services and edging toward top-three national status.
- October 2024: Saia closed on 28 Yellow terminals for USD 235.7 million, enhancing network density and door count.


United States Less Than-Truck-Load (LTL) Market Report Scope
Agriculture, Fishing, and Forestry, Construction, Manufacturing, Oil and Gas, Mining and Quarrying, Wholesale and Retail Trade, Others are covered as segments by End User Industry. Domestic, International are covered as segments by Destination.End User Industry
| Agriculture, Fishing, and Forestry |
| Construction |
| Manufacturing |
| Oil and Gas, Mining and Quarrying |
| Wholesale and Retail Trade |
| Others |
Destination
| Domestic |
| International |
| End User Industry | Agriculture, Fishing, and Forestry |
| Construction | |
| Manufacturing | |
| Oil and Gas, Mining and Quarrying | |
| Wholesale and Retail Trade | |
| Others | |
| Destination | Domestic |
| International |


Market Definition
- Agriculture, Fishing, and Forestry (AFF) - This end user industry segment captures the external (outsourced) logistics expenditure incurred by the AFF industry players on road freight transport service. The end user players considered are the establishments primarily engaged in growing crops, raising animals, harvesting timber, harvesting fish & other animals from their natural habitats and providing related support activities. Herein, across the value chain, Logistics Service Providers (LSPs) play a crucial role in acquisition, storage, handling, transportation, and distribution activities for the optimal & continuous flow of inputs (seeds, pesticides, fertilizers, equipment, and water) from manufacturers or suppliers to the producers and smooth flow of output (produce, agro-goods) to distributors/ consumers. This includes both termperature controlled and non-temperature controlled logistics, as and when required according to the shelf life of goods being transported or stored.
- Construction - This end user industry segment captures the external (outsourced) logistics expenditure incurred by the construction industry players, on road freight transport service. The end user players considered are the establishments primarily engaged in constructing, repairing and renovating residential & commercial buildings, infrastructure, engineering works, subdividing and developing land. Logistics Service Providers (LSPs) play a crucial role in increasing profitability of construction projects by maintaing the inventory of raw materials & equipment, time-critical supplies and by providing other value added services for effective project management.
- Containerized Road Freight Transport - The segment captures the external (outsourced) logistics expenditure incurred by the road freight transport service end users on Full-Truck-Load (FTL) services. FTL road freight transport is characterized as a full single load not combined with other shipments. It comprises of shipments (i) devoted to the goods of a single shipper (ii) taken directly from a point of origin to one or more destination points (iii) comprising of bulk mail truck transportation (iv) comprising of both Container (Full Container Load, FCL)/Non-Container trucking services (v)comprsing of goods requiring temperature controlled or non-temperature controlled transportation services (vi) comprising of bulk liquid tankering (vii) invoving trucking of waste (viii) hazardous material trucking. Related value added services (VAS) of sorting, consolidation, deconslidation are included in the other services segment of freight and logistics market.
- Export Trends and Import Trends - Overall logistics performance of an economy is positively and significantly (statistically) correlated to its trade performance (exports and imports). Hence, in this industry trend, total value of trade, major commodities/ commodity groups and the major trade partners, for the studied geography (country or region as per the scope of report) have been analysed alongside the impact of major trade/logistics infrastructure investments & regulatory environment.
- Fluid Goods - The segment captures the external (outsourced) logistics expenditure incurred by the road freight transport service end users for the transport of bulk liquids, that are often used in extraction, manufacturing, food processing, agriculture industries among others. It includes transportation of liquids like (i) Chemicals/ hazardous goods (for instance acids) (ii) Water (potable as well as waste) (iii) Oil and gas (upstream as well as downstream like gasoline, fuel, crude oil, or propane), (iv) Food grade bulk liquids (like milk, or juice), (v) Rubber, (vi) Agrichemical products, among others. These goods are generally transported through tanker trucking.
- Fuel Price - Fuel price spikes can cause delays and diruption for logistics service providers (LSPs), while drops in the same can result in higher short-term profitability and increased market rivalry to offer consumers with the best deals. Hence, the fuel price variations have been studied over the review period and presented along with the causes as well as market impacts.
- Full-Truck-Load (FTL) Road Freight Transport - The segment captures the external (outsourced) logistics expenditure incurred by the road freight transport service end users on Full-Truck-Load (FTL) services. FTL road freight transport is characterized as a full single load not combined with other shipments. It comprises of shipments (i) devoted to the goods of a single shipper (ii) taken directly from a point of origin to one or more destination points (iii) comprising of bulk mail truck transportation (iv) comprising of both Container (Full Container Load, FCL)/Non-Container trucking services (v)comprsing of goods requiring temperature controlled or non-temperature controlled transportation services (vi) comprising of bulk liquid tankering (vii) invoving trucking of waste (viii) hazardous material trucking. Related value added services (VAS) of sorting, consolidation, deconslidation are included in the other services segment of freight and logistics market.
- GDP Distribution by Economic Activity - Nominal Gross Domestic Product and distribution of the same, across major economic sectors in the geography studied (country or region as per scope of the report) have been studied and presented in this industry trend. As GDP is positively related to the profitability and growth of logistics industry, this data has been used in adjunction to the input-output tables/ supply-use tables for analyzing the potential major contributing sectors towards the logistics demand.
- GDP Growth by Economic Activity - Growth of Nominal Gross Domestic Product across major economic sectors, for the geography studied (country or region as per scope of the report) have been presented in this industry trend. This data has been utilized for assessing the growth of logistics demand from all the market end users (economic sectors considered here).
- Inflation - Variations in both Wholesale Price Inflation (YoY change in producer price index) and Consumer Price Inflation have been presented in this industry trend. This data has been used to assess the inflationary environment as it plays a vital role in smooth functioning of the supply chain, directly impacting the logistics operational cost components e.g., pricing of tyres, driver wages & benefits, energy/fuel prices, maintenace costs, toll charges, warehousing rents, custom brokerage, forwarding rates, courier rates etc. hence impacting the overall freight and logistics market.
- Key Industry Trends - The report section named "Key Industry Trends" include all the key variables/parameters studied to better analyze the market size estimates and forecasts. All the trends have been presented in the form of data points (time series or latest available data points) along with analysis of the paramter in the form of concise market relevant commentary, for the geography studied (country or region as per the scope of report).
- Key Strategic Moves - The action taken by a company to differentiate from its competitor or used as a general strategy is referred to as a key strategic move (KSM). This includes (1) Agreements (2) Expansions (3) Financial Restructuring (4) Mergers and Acquisitions (5) Partnerships, and (6) Product Innovations. Key players (Logistics Service Providers, LSPs) in the market have been shortlisted, their KSM have been studied and presented in this section.
- Less than-Truck-Load (LTL) Road Freight Transport - The segment captures the external (outsourced) logistics expenditure incurred by the road freight transport service end users on Less than-Truck-Load (LTL) services. LTL road freight transport is characterized as multiple shipments combined onto a single truck for multiple deliveries within a network. It comprises of establishments (i) primarily engaged in general and specialized freight trucking of less than complete truck-loads, (ii) characterized by the use of terminals to consolidate shipments, generally from several shippers, into a single truck for haulage between a load assembly terminal and a disassembly terminal, where the load is sorted and shipments are re-routed for delivery (iv) Less than-Container-Load (LCL) shipping/ Groupage Shipping in case of trucking services. The activities in scope include (i) local pick-up, (ii) line-haul, and (iii) local delivery. Related value added services (VAS) of sorting, consolidation, deconslidation are included in the other services segment of freight and logistics market.
- Logistics Performance - Logistics Performance and Logistics Costs are the backbone of trade, and influences trade costs, making countries compete globally. Logistics performance is influenced by market wide adopted supply chain management strategies, government services, investments & policies, fuel/ energy costs, inflationary environment etc. Hence, in this industry trend, the logistics performance of the geography studied (country/ region as per the scope of report) has been analysed and presented over the review period.
- Major Truck Suppliers - Market share of truck brands is influenced by factors like geographical preferences, portfolio of truck types, truck prices, local production, truck repair & maintenance service peneteration, customer support, technological innovations (like electric vehicles, digitalization, autonomous trucks), fuel efficiency, financing options, annual maintenance costs, availability of substitutes, marketing startegies etc. Hence, the distribution (share % for base year of the study) of truck sales volume for leading truck brands and commentary on current market scenario & market anticipation over the forecast period have been presented in this industry trend.
- Manufacturing - This end user industry segment captures the external (outsourced) logistics expenditure incurred by the Manufacturing industry players, on road freight transport service. The end user players considered are the establishments primarily engaged in the chemical, mechanical or physical transformation of materials or substances into new products. Logistics Service Providers (LSPs) play a crucial role in maintaining a smooth flow of raw materials across the supply chain, enabling timely delivery of finished goods to distributors or end customers and storing & supplying the raw materials to clients for just-in-time manufacturing.
- Modal Share - Freight Modal Share is influenced by factors like modal productivity, government regulations, containerization, distance of shipment, temperature control requirements, type of goods, international trade, terrain, speed of delivery, shipment weight, bulk shipments, etc. Also, modal share by tonnage (tons) and modal share by freight turnover (ton-km) differ as per average distance of shipments, weight of major commodity groups transported in the economy and number of trips. This industry trend represents the distribution of freight transported by mode of transport (tons as well as ton-km), for the study base year.
- Oil and Gas, Mining and Quarrying - This end user industry segment captures the external (outsourced) logistics expenditure incurred by the extraction industry players, on road freight transport service. The end user players considered are the establishments that extract naturally occurring mineral solids, such as coal and ores; liquid minerals, such as crude petroleum; and gases, such as natural gas. Logistics Service Providers (LSPs) covers entire phases from upstream to downstream and plays a crucial role in the transportation of machinery, drilling equipments, extracted minerals, crude oil & natural gas and refined/ processed products from one place to another.
- Other End Users - Other end user segment captures the external (outsourced) logistics expenditure incurred by the financial services (BFSI), real estate, educational services, healthcare, and professional services (administrative, waste management, legal, architectural, engineering, design, consulting, scientific R&D), on road freight transport service. Logistics Service Providers (LSPs) plays a crucial role in the reliable movement of supplies and documents to/from these industries such as transporting any equipment or resources required, shipping confidential documents and files, movement of medical goods & supplies (surgical supplies and instruments, including gloves, masks, syringes, equipment) to name a few.
- Producer Price Inflation - It indicates inflation from viewpoint of the producers viz. the average selling price received for their output over a period of time. Annual change (YoY) of producer price index is reported as wholesale price inflation in the "Inflation" industry trend. As WPI captures dynamic price movements in most comprehensive way, it is widely used by governments, banks, industry, business circles and is deemed important in formulation of trade, fiscal and other economic policies. The data has been used in adjunction to consumer price inflation for better understanding the inflationary environment.
- Road Freight Pricing Trends - Freight pricing by mode of transport (USD/tonkm), over the review period, has been presented in this industry trend. The data has been used in assessing the inflationary environment, impact on trade, freight turnover (tonkm), road freight transport market demand and hence the road freight transport market size.
- Road Freight Tonnage Trends - Freight tonnage (weight of goods in tons) handled by mode of transport, over the review period, has been presented in this industry trend. The data has been used as one of the parameters apart from average distance per shipment (km), freight volume (tonkm), and freight pricing (USD/tonkm) to assess the freight transport market size.
- Road Freight Transport - Hiring a road freight transport logistics service provider (LSP) or haulier (outsourced logistics), for the transport of commodities constitutes road freight transport market. The scope of study includes (i) road transport of goods reported by hauliers registered in the reporting countries (ii) transport of raw materials or manufactured goods (solids as well as fluids) (iii) transport using commerical motor vehicles (rigid trucks or tractor-trailers, (iv) Full-Truck-Load (FTL) or Less than-Truck-Load (LTL) transport (v) containerized or non-containerized transport (vi) temperature controlled or non-temperature controlled trasnport, (vii) short haul or long haul (Over-the-road, OTR) transport, (viii) used office or household goods transport (movers and packers), (ix) other specialized cargo transport (dangerous goods, oversized cargo) and (x) outsourced first mile/ middle mile/last mile delivery shipments undertaken by road freight transport players. The scope does not include (i) transport undertaken by hauliers registered in other countries (ii) last mile meal delivery market (iii) grocery delivery market (iv) transportation via road network undertaken/ reported by Courier, Express, and Parcel (CEP) players.
- Road Length - As infrastructure plays a vital role in an economy's logistics performance, variables like length of roads, distribution of road length by surface category (paved v/s unpaved), distribution of road length by road classification (expressways v/s highways v/s other roads), have been analysed and presented in this industry trend.
- Segmental Revenue - Segmental Revenue has been triangulated or computed and presented for all the major players in the market. It refers to the road freight transport market specific revenue earned by the company, over the base year of study, in the geography studied (country or region as per the scope of report). It is computed through the study and analysis of major parameters like financials, service portfolio, employee strength, fleet size, investments, number of countries present in, major economies of concern, etc. that have been reported by the company in its annual reports, webpage. For companies having scarce financial disclosures, paid databases like D&B Hoovers, Dow Jones Factiva have been resorted to and verified through industry/expert interactions.
- Short Haul Road Freight Transport - The segment captures the external (outsourced) logistics expenditure incurred by the road freight transport service end users on local trucking (less than 100 miles). It includes the road transport of goods (i) within a single administrative area and its hinterland, (ii) by smaller trucks and pickup trucks (iii) via containerized as well as dry bulk services (iv) intermodal from ports, container terminals or airports, and (v) outsourced first mile/ last mile delivery shipments undertaken by road freight transport players.
- Transport and Storage Sector GDP - Value and growth of Transport and Storage Sector GDP has a direct relation to the freight and logistics market size, and hence road freight transport market size. Therefore, this variable has been studied and presented over the review period, in value terms (USD) and as share % of total GDP, in this industry trend. The data has been supported by concise and relevant commentary around the investments, developments, and current market scenario.
- Trends in E-Commerce Industry - Enhanced internet connectivity and boom in smartphone penetration, coupled with increasing disposable incomes, has led to a phenomenal growth in the e-commerce market globally. Online shoppers require fast and efficient delivery of their orders leading to an increase in the demand for logistics services especially e-commerce fulfilment services. Hence, the Gross Merchandise Value (GMV), historial and projected growth, breakup of major commodity groups in e-commerce industry for the studied geography (country or region as per scope of the report) have been analysed and presented in this industry trend.
- Trends in Manufacturing Industry - Manufacturing industry involves the transformation of raw materials into finished products, while logistics industry ensures the efficient flow of raw materials to the factory, and the transport of manufactured products to the distributors & consumers. Demand-Supply of both industries are highly cross-linked and critical for a seamless supply chain. Hence, the Gross Value Added (GVA), breakup of GVA into major manufacturing sectors, and growth of manufacturing industry over the review period have been analysed and presented, in this industry trend.
- Trucking Fleet Size By Type - Market share of truck types is influenced by factors like geographical preferences, major end user industries, truck prices, local production, truck repair & maintenance service peneteration, customer support, technological disruptions (like electric vehicles, digitalization, autonomous trucks) etc. Hence, the distribution (share % for base year of study) of truck parc volume by type of truck, market disruptors, truck manufacturing investments, truck specifications, truck use & import regulations, and market anticipation over the forecast period have been presented in this industry trend.
- Trucking Operational Costs - The prime reasons for measuring/ benchmarking logistics performance of any trucking company are to reduce operational costs and increase profitability. On the other hand, measuring operational costs helps to identify whether and where to make operational changes to control expenses and identify areas for improved performance. Hence, in this industry trend, trucking operational costs and the variables involved viz. driver wages & benefits, fuel prices, repairs & maintenance costs, tyre costs etc. have been studied over the base year of study, and presented for the geography studied (country or region as per the scope of report).
- Wholesale and Retail Trade - This end user industry segment captures the external (outsourced) logistics expenditure incurred by the wholesalers and retailers, on road freight transport service. The end user players considered are the establishments primarily engaged in wholesaling or retailing merchandise, generally without transformation, and rendering services incidental to the sale of merchandise. Logistics Service Providers (LSPs) plays a crucial role in the reliable movement of supplies to and finished products from production houses to the distributors and finally to the end customer covering activites like material sourcing, transportation, order fulfillment, warehousing & storage, demand forecasting, inventory management etc.
| Keyword | Definition |
|---|---|
| Cabotage | Road transport by a motor vehicle registered in a country performed on the national territory of another country. |
| Cross Docking | Cross docking is a logistics procedure where products from a supplier or manufacturing plant are distributed directly to a customer or retail chain with marginal to no handling or storage time. Cross docking takes place in a distribution docking terminal; usually consisting of trucks and dock doors on two (inbound and outbound) sides with minimal storage space. The name ‘cross docking’ explains the process of receiving products through an inbound dock and then transferring them across the dock to the outbound transportation dock. |
| Cross Trade | International road transport between two different countries performed by a road motor vehicle registered in a third country. A third country is a country other than the country of loading/embarkation and than the country of unloading/disembarkation. |
| Dangerous Goods | The classes of dangerous goods carried by Road are those defined by the fifteenth revised edition of the UN Recommendations on the Transport of Dangerous Goods, United Nations, Geneva 2007. They include Class 1: Explosives; Class 2: Gases; Class 3: Flammable Liquids; Class 4: Flammable solids- substances liable to spontaneous combustion; substances which, on contact with water, emit flammable gases; Class 5: Oxidizing substances and organic peroxides; Class 6: Toxic and infectious substances; Class 7: Radioactive material and Class 8: Corrosive substances, Class 9: Miscellaneous dangerous substances and articles. |
| Direct Shipment | Direct shipment is a method of delivering goods from the supplier or the product owner to the customer directly. In most cases, the customer orders the goods from the product owner. This delivery scheme reduces transportation and storage costs, but requires additional planning and administration. |
| Drayage | A drayage is a form of trucking service that connects the different modes of shipping (intermodal), such as ocean freight or air freight. It’s a short-haul trip that transports goods from one place to another, usually before or after its long-haul shipping process. Drayage trucks move cargo to and from various destinations, such as container ships, storage lots, order fulfillment warehouses, and rail yards. Typically, drayage only transports goods in short distances and operates only in one metropolitan area. It also requires only one trucker in a single shift. But despite this, but it plays an important role in long-haul shipping because it gets the goods to the cargo and vice versa. It makes intermodal transport much more efficient and enables the seamless transfer of goods to the end customer. |
| Dry van | A dry van is a type of semi-trailer that's fully enclosed to protect shipments from outside elements. Designed to carry palletized, boxed or loose freight, dry vans aren't temperature-controlled (unlike refrigerated “reefer” units) and can't carry oversized shipments (unlike flatbed trailers). |
| Final Demand | Final demand includes all types of commodities (goods as well as services) consumed as final use and might include personal consumption, or consumption by government, by businesses as capital investment, and as exports. includes all types of commodities (goods as well as services) consumed as final use and might include personal consumption, or consumption by government, by businesses as capital investment, and as exports. |
| Flatbed Truck | A flatbed truck is a type of truck with rigid design. It has a back body that is flatly shaped for easy loading and unloading of goods. The flatbed truck is mostly used to transport heavy, oversized, wide and indelicate goods such as machinery, building supplies or equipment. Due to the truck open body, the goods transported with it must not be vulnerable to rain. By functionality, the flatbed truck is comparable to a flatbed trailer. |
| Inbound Logistics | Inbound logistics is the way materials and other goods are brought into a company. This process includes the steps to order, receive, store, transport and manage incoming supplies. Inbound logistics focuses on the supply part of the supply-demand equation. |
| Intermediate Demand | Intermediate demand includes goods, services, and maintenance and repair construction sold to businesses, excluding capital investment. |
| International Loaded | Place of loading of goods in reporting country (i.e., country in which the vehicle performing the transport is registered) and place of unloading in a different country. |
| International Unloaded | Place of unloading of goods in reporting country (i.e., country in which the vehicle performing the transport is registered) and place of loading in a different country. |
| OOG cargo | Out of Gauge (OOG) cargo is any cargo that can not be loaded into six-sided shipping containers simply because it is too large. The term is a very loose classification of all cargo with dimensions beyond the maximum 40HC container dimensions. That is a length beyond 12.05 meters – a width beyond 2.33 meters – or a height beyond 2.59 meters. |
| Pallets | Raised platform, intended to facilitate the lifting and stacking of goods. |
| Part load | A part load describes goods which only fills a truck partially. In essence, the quantity of the shipment is bigger than the Less Than Truckload (LTL) shipment. Also, the shipment cannot fully occupy a truck i.e. its capacity is much lower than a Full Truckload (FTL) shipment. |
| Paved Road | Road surfaced with crushed stone (macadam) with hydrocarbon binder or bituminized agents, with concrete or with cobblestone. |
| Reverse Logistics | Reverse logistics comprises of the sector of supply chains that process anything returning inwards through the supply chain or traveling ‘backward’ through the supply chain. |
| Road Freight Transport Service | Hiring a trucking agency for transport of commodities (raw materials or manufactured goods including both solids and liquids) form the origin to a destination within the country (domestic) or cross-border (international) constitutes road freight transport market. The service might be Full-Truck-Load or Less than-Truck-Load, containerized or non-containerized, temperature controlled or non temperature controlled, short haul or long haul. |
| Tautliner vehicle | Tautliner and curtainsider are used as generic names for curtain sided trucks/trailers. The curtains are permanently fixed to a runner at the top and detachable rails/poles at front and rear, allowing the curtains to be drawn open and forklifts used all along the sides for easy and efficient loading and unloading. When closed for travel, vertical load restraint straps are attached to a rope rail beneath the truck bed, connecting the truck bed and curtain along both sides. Winches at either end of the curtain tension it, hence the 'Tautliner' name. This stops the curtain from flapping or drumming in the wind and can also help retain light loads from slipping sideways. |
| Transport for hire or reward | The carriage for remuneration of goods. |
| Unpaved Road | Road with a stabilized base not surfaced with crushed stone, hydrocarbon binder or bituminized agents, concrete or cobblestone. |


Research Methodology
Mordor Intelligence follows a four-step methodology in all our reports.
- Step-1: Identify Key Variables: In order to build a robust forecasting methodology, the variables and factors identified in Step-1 are tested against available historical market numbers. Through an iterative process, the variables required for market forecast are set and the model is built on the basis of these variables.
- Step-2: Build a Market Model: Market-size estimations for the forecast years are in nominal terms. Inflation is considered to be a part of the pricing, and the average selling price (ASP) is varying throughout the forecast period for each country
- Step-3: Validate and Finalize: In this important step, all market numbers, variables and analyst calls are validated through an extensive network of primary research experts from the market studied. The respondents are selected across levels and functions to generate a holistic picture of the market studied.
- Step-4: Research Outputs: Syndicated Reports, Custom Consulting Assignments, Databases & Subscription Platforms


