On-demand Freight Transportation Market Size and Share
Market Overview
| Study Period | 2020 - 2031 |
|---|---|
| Market Size (2026) | USD 143.78 Billion |
| Market Size (2031) | USD 298.55 Billion |
| Growth Rate (2026 - 2031) | 15.74% CAGR |
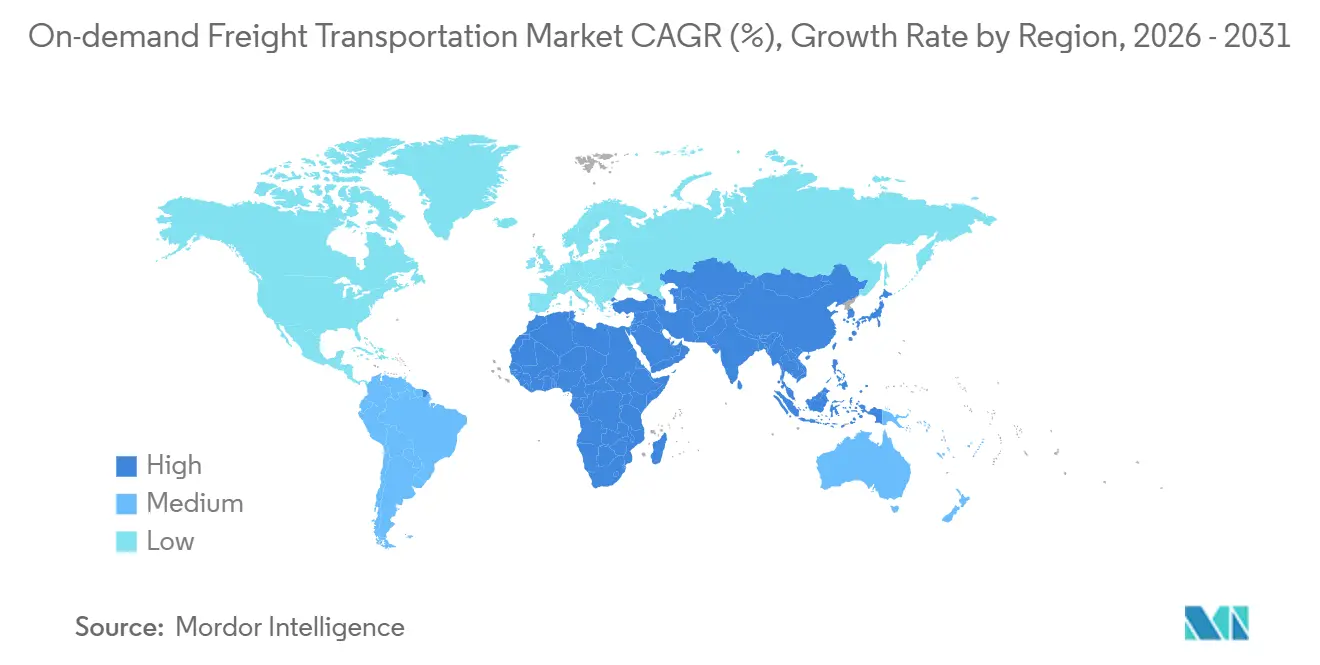
| Fastest Growing Market | Asia Pacific |
| Largest Market | Asia Pacific |
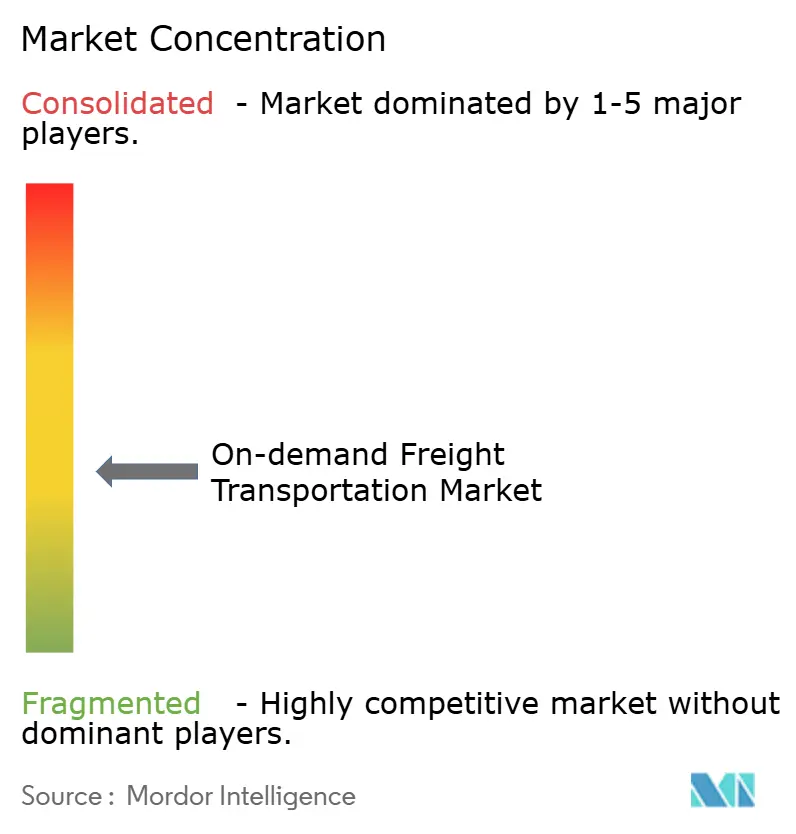
| Market Concentration | Medium |
Major Players *Disclaimer: Major Players sorted in no particular order Image © Mordor Intelligence. Reuse requires attribution under CC BY 4.0. | |
On-demand Freight Transportation Market Analysis by Mordor Intelligence
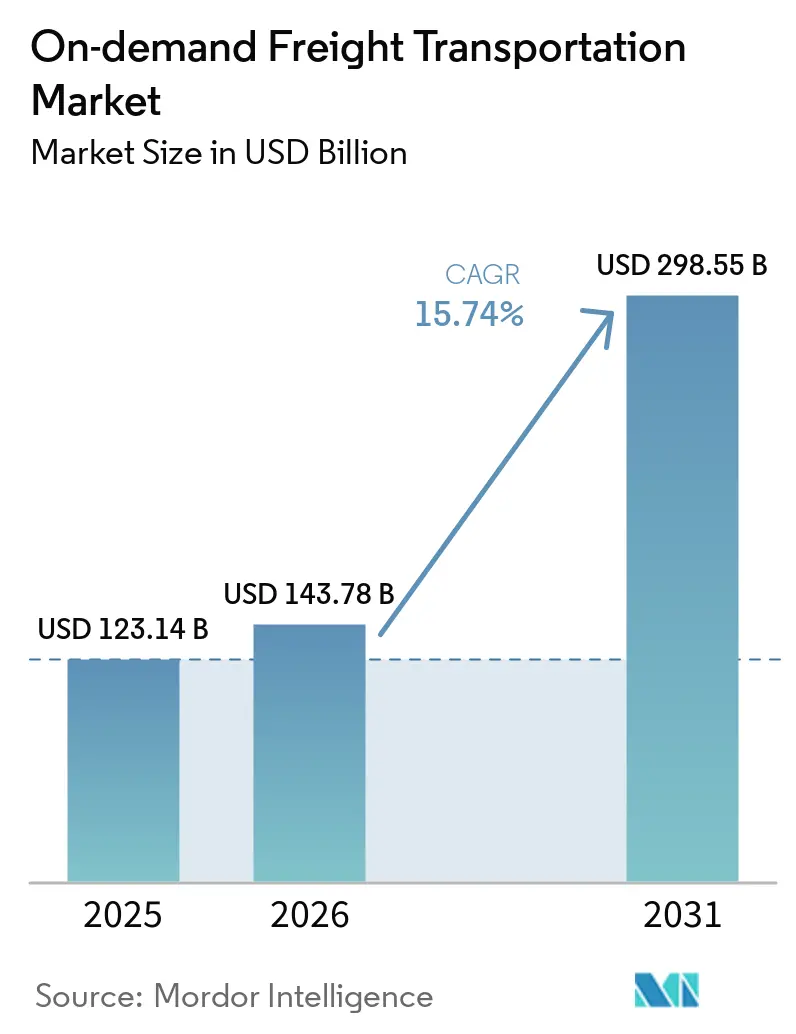
The On-demand Freight Transportation Market size is expected to increase from USD 123.14 billion in 2025 to USD 143.78 billion in 2026 and reach USD 298.55 billion by 2031, growing at a CAGR of 15.74% over 2026-2031.
Strong reshoring momentum compresses supply chains geographically, prompting shippers to favor flexible capacity they can activate in hours rather than weeks. Digital brokerage platforms deepen spot-market liquidity, allowing enterprise traffic that once moved under annual contracts to clear through real-time auctions that shave 5-7 percentage points off traditional broker margins. Infrastructure bills in major economies earmark billions of public dollars for corridor digitalization, which lowers asset dwell times and strengthens the commercial case for data-driven freight orchestration. Finally, temperature-controlled healthcare, fresh food, and semiconductor loads reinforce long-haul air and premium road demand, offsetting cost pressures from labor shortages and rising insurance premiums.
Key Report Takeaways
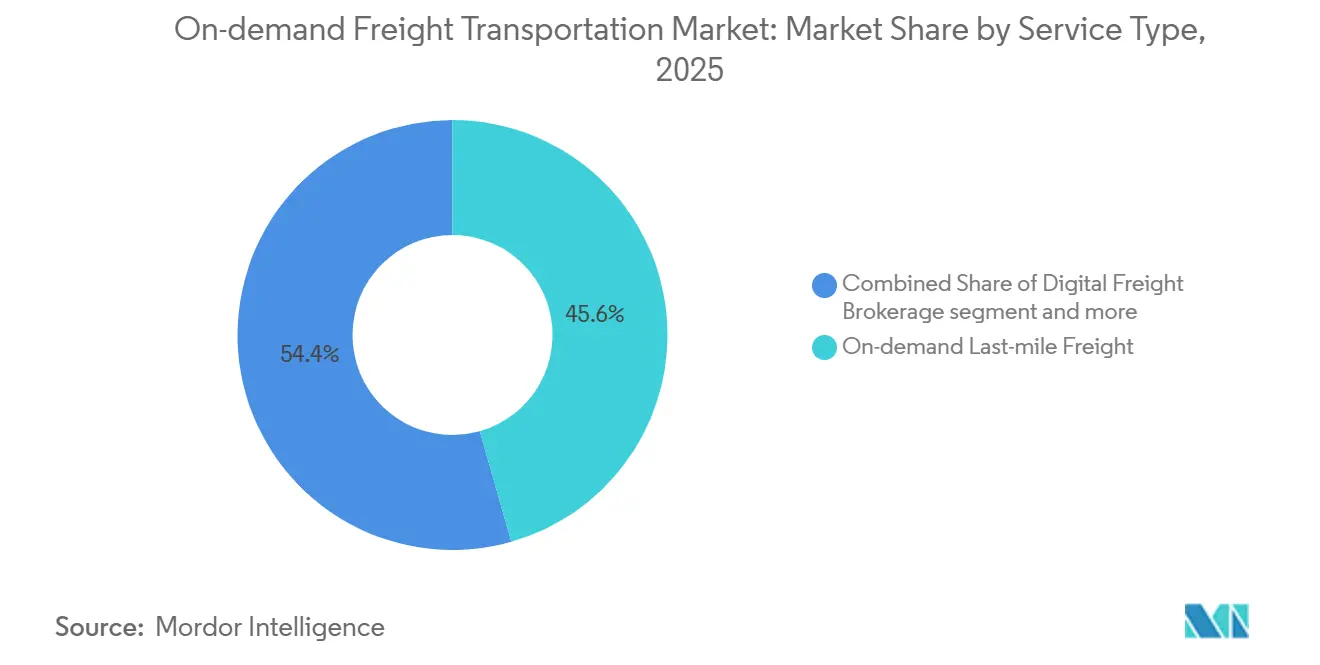
- By service type, on-demand last-mile freight led with 45.59% of the on-demand freight transportation market share in 2025, while digital freight brokerage platforms are forecast to grow at a 19.91% CAGR through 2031.
- By mode of transport, road services commanded 64.25% share of the on-demand freight transportation market size in 2025, and air freight is projected to expand at an 18.42% CAGR through 2031.
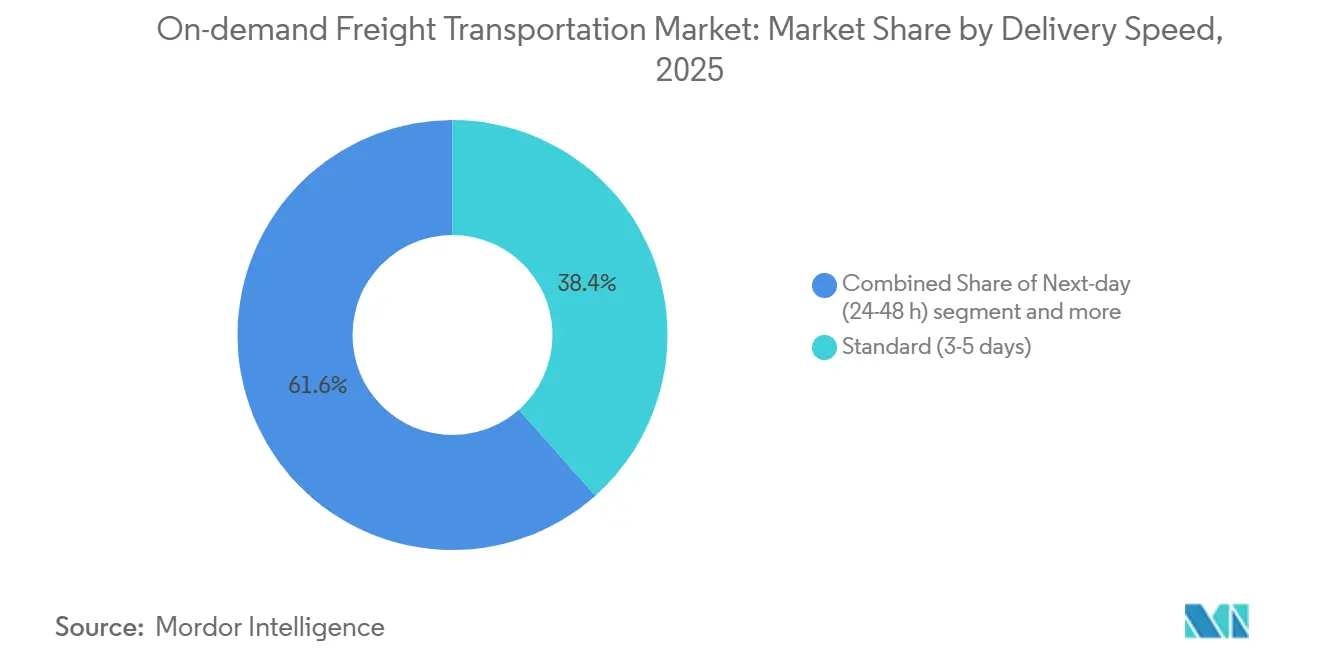
- By delivery speed, standard 3-5 day services accounted for 38.43% share of the on-demand freight transportation market in 2025, whereas same-day delivery is advancing at a 19.21% CAGR to 2031.
- By end-user industry, e-commerce and retail held 26.03% of the on-demand freight transportation market in 2025, yet healthcare and pharma record the highest forecast growth at 19.63% CAGR.
- By geography, Asia-Pacific captured 41.74% of the on-demand freight transportation market in 2025 and is expected to grow at an 18.15% CAGR between 2026 and 2031.
Note: Market size and forecast figures in this report are generated using Mordor Intelligence’s proprietary estimation framework, updated with the latest available data and insights as of January 2026.
Global On-demand Freight Transportation Market Trends and Insights
Drivers Impact Analysis*
| Drivers | (~) % Impact on CAGR Forecast | Geographic Relevance | Impact Timeline |
|---|---|---|---|
| Nearshoring of manufacturing boosting short-haul and cross-border truckload demand | +3.1% | North America (Mexico corridor), ASEAN core | Long term (≥ 4 years) |
| B2B freight-procurement platforms mainstreaming spot capacity access | +2.9% | Global, led by North America and the EU | Medium term (2-4 years) |
| Exploding demand for temperature-controlled pharma and fresh food on-demand services | +2.4% | Global, concentrated in developed markets | Medium term (2-4 years) |
| Government-backed supply-chain resilience funds expanding digital freight corridors | +2.2% | North America, EU, India | Long term (≥ 4 years) |
| Blockchain-enabled smart contracts shrinking carrier payment cycles | +1.6% | Global, early adoption in North America | Short term (≤ 2 years) |
| Quantum-inspired route optimization lifting trailer utilisation by more than 8 % | +1.3% | Global, dense corridors | Medium term (2-4 years) |
| Source: Mordor Intelligence | |||
Nearshoring of Manufacturing Boosting Short-haul and Cross-border Truckload Demand
The United States goods imports from Mexico are eclipsing China for the first time in over two decades and spurring dense 300-800-mile lanes that favor on-demand digital matching. Automotive and electronics plants straddling the Texas-Nuevo León corridor require same-day or next-day trucking that commands premium rates. Similar relocation to Vietnam, Thailand, and Indonesia grows intra-ASEAN freight, although Purchasing Managers’ Index values still hover around the 50 resilience threshold. Digital platforms capitalize on this predictable, high-frequency traffic by automating customs, proof-of-delivery, and capacity balancing across borders.[1]U.S. Census Bureau, “Trade in Goods with Mexico,” census.gov
B2B Freight-procurement Platforms Mainstreaming Spot Capacity Access
Large shippers now blend contract and spot freight in unified workflows, using real-time digital auctions that eliminate manual phone bids. Walmart processes tens of millions of annual shipments with its private fleet alone driving nearly 1 billion miles a year showing that scalable APIs can coexist with long-term carrier commitments. The resulting transparency pushes broker spreads into single digits, unlocking logistics savings. Mid-size firms also benefit as open marketplaces level the playing field for capacity during crunch periods. Together these shifts recast price discovery and power dynamics across the on-demand freight transportation market.
Exploding Demand for Temperature-controlled Pharma and Fresh Food On-demand Services
Biologics and vaccines must stay between 2–8 °C, and any deviation risks inventory losses that the industry values at USD 35 billion a year. UPS Healthcare has rapidly expanded its global cold-chain footprint, more than doubling its dedicated healthcare warehousing space and absorbing Bomi Group to capture high-margin healthcare logistics growth. Parallel growth in ultrafast grocery global fresh e-grocery sales requires refrigerated final-mile fleets and IoT monitoring. Multizone vehicles that handle both perishables and pharma thus earn premium yields and extend the addressable on-demand freight transportation market.
Government-backed Supply-chain Resilience Funds Expanding Digital Freight Corridors
The USD 1.2 trillion Infrastructure Investment and Jobs Act dedicates USD 110 billion to roads and bridges, including weigh-station automation that trims detention and idling. India’s National Logistics Policy seeks to cut logistics costs to 8% of GDP by 2030 via multimodal freight corridors and single-window digital clearance. Within Europe, the Connecting Europe Facility allocates USD 37.07 billion equivalent for transport upgrades, of which USD 28.38 billion is specifically to trans-European transport networks, with a heavy emphasis on cross-border interoperability and rail digitalization. These public funds encourage private capital deployment in visibility platforms that ride on improved physical infrastructure, lifting utilization and throughput.[2]Government of India, “National Logistics Policy 2022,” india.gov.in
Restraints Impact Analysis*
| Restraints | (~) % Impact on CAGR Forecast | Geographic Relevance | Impact Timeline |
|---|---|---|---|
| Battery-electric truck range limits & charging dwell time | -1.9% | Urban centers globally, EU and North America | Medium term (2-4 years) |
| Lack of interoperable data standards hindering multi-platform visibility | -1.7% | Global, fragmented markets worst hit | Long term (≥ 4 years) |
| Escalating cargo-theft incidents driving up security overheads | -1.4% | Global, high exposure in North and Latin America | Short term (≤ 2 years) |
| AI-driven risk scoring inflating insurance premiums for owner-operators | -1.2% | North America and EU | Medium term (2-4 years) |
| Source: Mordor Intelligence | |||
Battery-electric Truck Range Limits and Charging Dwell Time Constraining Urban Roll-outs
Class-8 electric rigs typically run 150-250 miles per charge compared with 1,000 miles for diesel, restricting them to drayage and metro shuttle work. Even with 350 kW chargers, 80% top-ups can take an hour, slicing 10-15% off daily utilization. The USD 5 billion United States NEVI program prioritizes light vehicles, so heavy-duty corridors still lack consistent charging. Until megawatt charging and denser station networks arrive, operators limit electric adoption, tempering the on-demand freight transportation market’s sustainability edge.[3]U.S. Department of Energy, “NEVI Formula Program Fact Sheet,” energy.gov
Lack of Interoperable Data Standards Hindering Multi-platform Visibility
A significant portion of shipment track-and-trace still requires manual email or phone confirmation because leading logistics platforms often rely on guarded, proprietary APIs. While industry groups like the Blockchain in Transport Alliance drafted open standards, widespread adoption remains patchy following its merger into the Global Blockchain Business Council. Operationally, logistics teams routinely lose hours each week manually reconciling these data silos, a friction tax that costs the broader global supply chain tens of billions of dollars annually in lost productivity. Ultimately, this limited visibility deters some enterprise shippers from shifting larger volumes of freight into on-demand channels.
*Our forecasts treat driver/restraint impacts as directional, not additive. The impact forecasts reflect baseline growth, mix effects, and variable interactions.
Segment Analysis
By Service Type: Digital Brokerage Scaling Beyond Last-mile
On-demand last-mile freight dominated with 45.59% of the on-demand freight transportation market share in 2025. Yet digital brokerage platforms, benefiting from zero-asset scaling and direct TMS integrations, are forecast to post a 19.91% CAGR, the fastest within the segment. Broker marketplaces match enterprise loads to carriers in seconds, cutting empty miles and lowering administrative overhead. Crowd-sourced courier networks face rising employment compliance costs, narrowing their cost advantage. API-enabled brokerage also unlocks international corridors, linking shippers directly with cross-border carriers and reinforcing network effects.
Platform operators monetize via 8-12% transaction fees rather than capital-intensive vehicle fleets, so incremental volume drops quickly to profit. However, Convoy’s recent exit illustrated that liquidity alone is insufficient; dense carrier relationships and disciplined freight underwriting remain decisive. To differentiate, surviving platforms roll out embedded payment products, load-board-plus insurance bundles, and predictive ETAs, deepening stickiness inside shipper workflows. As these services mature, the on-demand freight transportation market size tied to brokerage is expected to overtake last-mile turnover early in the next decade.


By Mode of Transport: Road Dominance with Air Acceleration
Road transport captured 64.25% of 2025 revenue, underpinned by ubiquitous full-truckload (FTL) and less-than-truckload (LTL) demand. The sub-segment’s granular origin-destination pairs suit algorithmic matching that lifts utilization and compresses lead times. Nevertheless, air freight is projected to expand 18.42% annually to 2031, outstripping all other modes. Pharmaceutical biologics, semiconductor dies, and luxury electronics increasingly rely on time-definite flights, where on-demand portals secure space across airline, integrator, and charter networks.
Sustained belly-hold capacity deficits preserve pricing power for freighter operators, with air rates still more than 12 times ocean levels on a per-kilogram basis. Digital cargo marketplaces respond by enabling instant booking, dynamic pricing, and automated airway bills that reduce clerical touchpoints. Road-air-road multimodal orchestration further boosts the on-demand freight transportation market by bundling airport drayage and customs clearance into a single transaction.
By Delivery Speed: Standard Bulk Still Largest, Same-day Surges
Standard 3-5 day services held 38.43% of 2025 revenue due to consolidation economics that minimize unit costs across middle-mile networks. Same-day delivery, though smaller, is racing ahead at a 19.21% CAGR as consumer expectations migrate from next-day benchmarks to sub-12-hour windows. Amazon’s regional air hubs and local sort centers exemplify the capex required to cut transit times without eroding margin. Micro-fulfillment nodes within 15 miles of consumers shrink line-haul distance and enable dense route batching.
Next-day delivery occupies the median price-speed tier and serves durable goods where immediate gratification weighs less than shipping cost. Economy options beyond five days cater to price-sensitive shippers willing to trade transit time for freight savings, often filling backhauls in low-demand lanes. Across tiers, digital orchestration steers load to carriers with the optimal cost-to-service mix, deepening the reach of the on-demand freight transportation market.
By End-user Industry: Retail Scale Meets Healthcare Complexity
E-commerce and retail contributed 26.03% of revenue in 2025, leveraging platform APIs for automated rate shopping and real-time tracking. Healthcare and pharmaceuticals, while smaller in absolute size, show the fastest growth at 19.63% CAGR through 2031. Cold-chain compliance regulations from the U.S. Food and Drug Administration mandate continuous 2–8 °C monitoring and chain-of-custody logs. Providers such as UPS Healthcare respond with investments in GDP-compliant storage, real-time temperature sensors, and validated packaging to command premium yields.
Consumer packaged goods favor predictable palletized flows suited to FTL and LTL consolidation, whereas fresh food e-grocery demands refrigerated vans and tight delivery windows. Industrial and manufacturing freights mirror macro cycles but generates steady tonnage that cushions platform volume during retail downturns. Niche verticals like hazardous chemicals and oversized machinery impose specialized requirements, motivating platforms to certify carriers and expand insurance offerings to capture incremental share.[4]U.S. Food and Drug Administration, “Good Distribution Practice Guidelines,” fda.gov
Geography Analysis
Asia-Pacific held 41.74% of global revenue in 2025 and is forecast to compound at 18.15% through 2031, cementing its role as the volume and growth engine for the on-demand freight transportation market. Factory relocations from coastal China into Vietnam, Indonesia, and India create dense intra-regional corridors where digital platforms manage customs pre-clearance and demand pooling. Belt and Road rail links further integrate Southeast Asia with inland Chinese production clusters, cutting transit times and expanding available capacity for cross-border e-commerce sellers.
North America trails in market share yet benefits disproportionately from nearshoring between Mexico and the United States. Cross-border truckload totals have surged significantly as electronics and automotive OEMs colocate assembly and component plants within 500 miles of final demand. The Infrastructure Investment and Jobs Act funds smart parking, weigh-in-motion, and telematics corridors that amplify asset productivity and encourage platform adoption. United States platforms also pioneer blockchain-driven instant payments, helping them attract independent owner-operators during persistent driver shortages.
Europe emphasizes sustainability and modal shift. The Connecting Europe Facility’s USD 28.38 billion transport budget includes funding that targets seamless cross-border freight paths, which platforms convert into intermodal door-to-door offers. Carbon regulations and urban low-emission zones push shippers toward green capacity, prompting carriers to trial battery-electric trucks on predictable urban legs despite current range limits. Platforms that can surface certified low-carbon options gain volume as large retailers commit to science-based emission targets.

Competitive Landscape
The on-demand freight transportation market exhibits moderate fragmentation. Global technology players charge 8-12% transaction fees for matching while minimizing capital risk, yet invest heavily in patented optimization engines; XPO Logistics alone holds several key patents in routing and pricing. Asset-based incumbents react by spinning off pure-play brokerages witness RXO’s recent separation to unlock valuation premiums and pursue tech-first growth. Mergers such as Korber’s pending acquisition of MercuryGate underline consolidation around end-to-end execution suites that blend warehouse, transportation, and visibility modules.
Payment velocity emerges as a new battleground. Schneider FreightPower and similar blockchain wallets settle within 24 hours, cutting working-capital drag for small carriers and swelling loyal capacity pools. Meanwhile, autonomous trucking pilots such as Uber Freight and Aurora on the Dallas-Houston lane aim to remove driver constraints in high-volume corridors. Early adopters expect 15-20% lower cost per mile on mature runs, compelling rivals to form AV partnerships or risk margin erosion.
Specialization presents a parallel path. DHL Supply Chain’s EUR 2 billion (USD 2.33 billion) global temperature-controlled build-out and UPS Healthcare’s USD 500 million cold-chain expansion target regulated lanes with entry barriers where commoditized spot rates cannot easily compress margin. Platforms that certify for GDP, HazMat, or high-value cargo secure pricing power, while generalist marketplaces face dilution as new entrants bid down transaction fees. All told, competitive intensity rises, but superior technology stacks, vertical focus, and payment innovation differentiate leaders in the on-demand freight transportation market.
On-demand Freight Transportation Industry Leaders
Uber Freight
C.H. Robinson Worldwide
J.B. Hunt 360
Flexport Inc.
XPO Logistics
- *Disclaimer: Major Players sorted in no particular order

Recent Industry Developments
- November 2025: Uber Freight executed an expansive commercial partnership with Better Trucks, accompanied by a direct capital investment. This strategic alignment is designed to integrate last-mile delivery capabilities, allowing Uber Freight to architect a flexible, global delivery ecosystem for enterprise brands.
- May 2025: Uber Freight launched an industry-first AI Logistics Network at scale. Powered by a logistics-specific Large Language Model (LLM) and advanced machine learning algorithms, this proprietary system is engineered to optimize dynamic truck routing, reduce empty transit miles, and enable intelligent supply chain execution across the full freight lifecycle.
- February 2025: Loadsmart announced the deployment of its ShipperGuide Marketplace, an on-demand digital architecture connecting corporate shippers directly with a vetted carrier network. The platform's pricing engine automates the spot quoting and bidding lifecycle, facilitating instantaneous full truckload (FTL) capacity matching.
- February 2025: Loadsmart launched a comprehensive Yard Management System (YMS) natively integrated into its Opendock scheduling software. Utilizing artificial intelligence and optical character recognition (OCR) via its NavTrac asset intelligence solution, the system digitizes gates, docks, and yards into a singular workflow, eliminating manual audits and enhancing terminal visibility.


Global On-demand Freight Transportation Market Report Scope
| Digital Freight Brokerage / Matching |
| On-demand Last-mile Freight |
| Crowd-sourced Delivery Platforms |
| Others |
| Road | Full-Truckload (FTL) |
| Less-than-Truckload (LTL) | |
| Air | |
| Other Mode of Transportation |
| Same-day (less than 24 h) |
| Next-day (24–48 h) |
| Standard (3-5 days) |
| Economy (more than 5 days) |
| Others |
| E-commerce and Retail |
| Consumer Packaged Goods |
| Food and Beverage (incl. Cold-chain) |
| Healthcare and Pharma |
| Industrial and Manufacturing |
| Others |
| North America | United States |
| Canada | |
| Mexico | |
| South America | Brazil |
| Peru | |
| Chile | |
| Argentina | |
| Rest of South America | |
| Asia-Pacific | India |
| China | |
| Japan | |
| Australia | |
| South Korea | |
| Southeast Asia (Singapore, Malaysia, Thailand, Indonesia, Vietnam, and Philippines) | |
| Rest of Asia-Pacific | |
| Europe | United Kingdom |
| Germany | |
| France | |
| Spain | |
| Italy | |
| BENELUX (Belgium, Netherlands, and Luxembourg) | |
| NORDICS (Denmark, Finland, Iceland, Norway, and Sweden) | |
| Rest of Europe | |
| Middle East And Africa | United Arab Emirates |
| Saudi Arabia | |
| South Africa | |
| Nigeria | |
| Rest of Middle East And Africa |
| By Service Type | Digital Freight Brokerage / Matching | |
| On-demand Last-mile Freight | ||
| Crowd-sourced Delivery Platforms | ||
| Others | ||
| By Mode of Transport | Road | Full-Truckload (FTL) |
| Less-than-Truckload (LTL) | ||
| Air | ||
| Other Mode of Transportation | ||
| By Delivery Speed | Same-day (less than 24 h) | |
| Next-day (24–48 h) | ||
| Standard (3-5 days) | ||
| Economy (more than 5 days) | ||
| Others | ||
| By End-user Industry | E-commerce and Retail | |
| Consumer Packaged Goods | ||
| Food and Beverage (incl. Cold-chain) | ||
| Healthcare and Pharma | ||
| Industrial and Manufacturing | ||
| Others | ||
| By Geography | North America | United States |
| Canada | ||
| Mexico | ||
| South America | Brazil | |
| Peru | ||
| Chile | ||
| Argentina | ||
| Rest of South America | ||
| Asia-Pacific | India | |
| China | ||
| Japan | ||
| Australia | ||
| South Korea | ||
| Southeast Asia (Singapore, Malaysia, Thailand, Indonesia, Vietnam, and Philippines) | ||
| Rest of Asia-Pacific | ||
| Europe | United Kingdom | |
| Germany | ||
| France | ||
| Spain | ||
| Italy | ||
| BENELUX (Belgium, Netherlands, and Luxembourg) | ||
| NORDICS (Denmark, Finland, Iceland, Norway, and Sweden) | ||
| Rest of Europe | ||
| Middle East And Africa | United Arab Emirates | |
| Saudi Arabia | ||
| South Africa | ||
| Nigeria | ||
| Rest of Middle East And Africa | ||


Key Questions Answered in the Report
How fast is digital freight brokerage growing within on-demand freight?
Digital brokerage revenue is forecast to climb at a 19.91% CAGR between 2026-2031, significantly outpacing other service types.
Which region contributes the most volume to on-demand freight?
Asia-Pacific held 41.74% of global revenue in 2025 and is projected to remain the largest contributor through 2031.
Why is air freight gaining share despite higher costs?
Pharmaceutical cold-chain and urgent e-commerce shipments are driving 18.42% annual growth in on-demand air services, offsetting cost premiums through speed-to-market gains.
What limits electric truck adoption for on-demand transport?
Typical 150-250 mile ranges and hour-long charging dwell times reduce daily utilization by up to 15%, confining electric rigs to short-haul routes for now.
How do blockchain smart contracts benefit small carriers?
They release payment within a week of delivery, eliminating 2-3% factoring fees and improving working capital by 200-300 basis points.
Which end-user vertical is expanding fastest?
Healthcare and pharmaceuticals are growing at 19.63% CAGR due to strict temperature-control and traceability requirements.
Page last updated on:


