Green Logistics Market Size and Share
Market Overview
| Study Period | 2020 - 2031 |
|---|---|
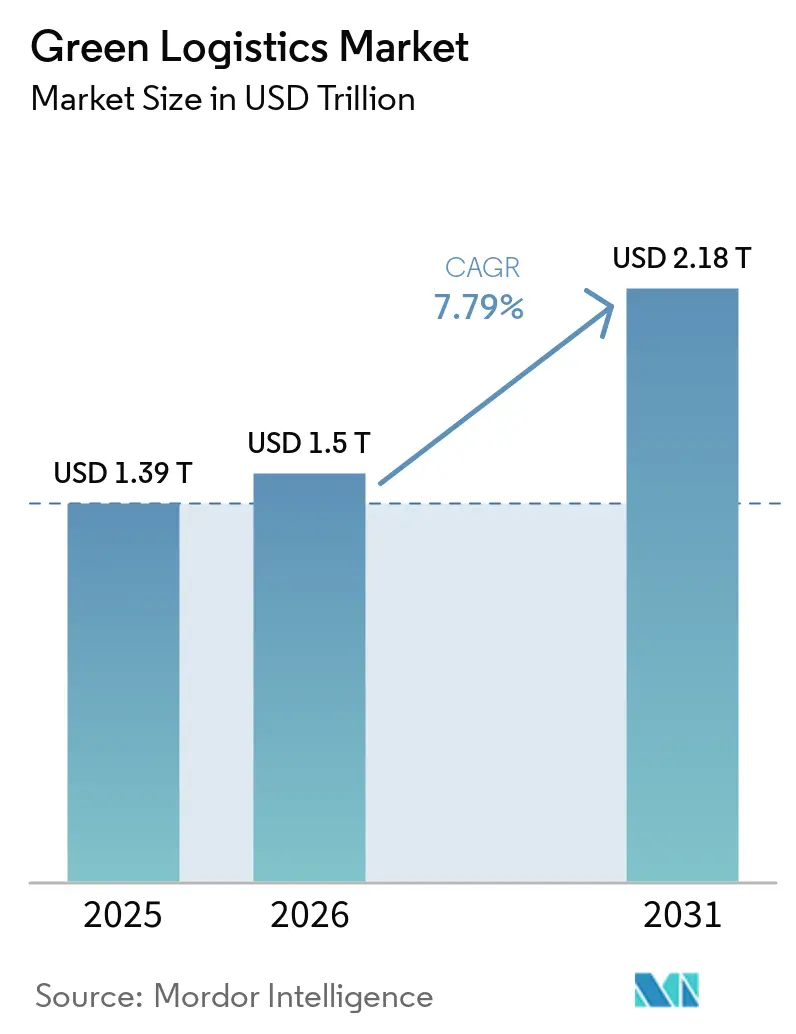
| Market Size (2026) | USD 1.5 Trillion |
| Market Size (2031) | USD 2.18 Trillion |
| Growth Rate (2026 - 2031) | 7.79% CAGR |
| Fastest Growing Market | Asia Pacific |
| Largest Market | Asia Pacific |
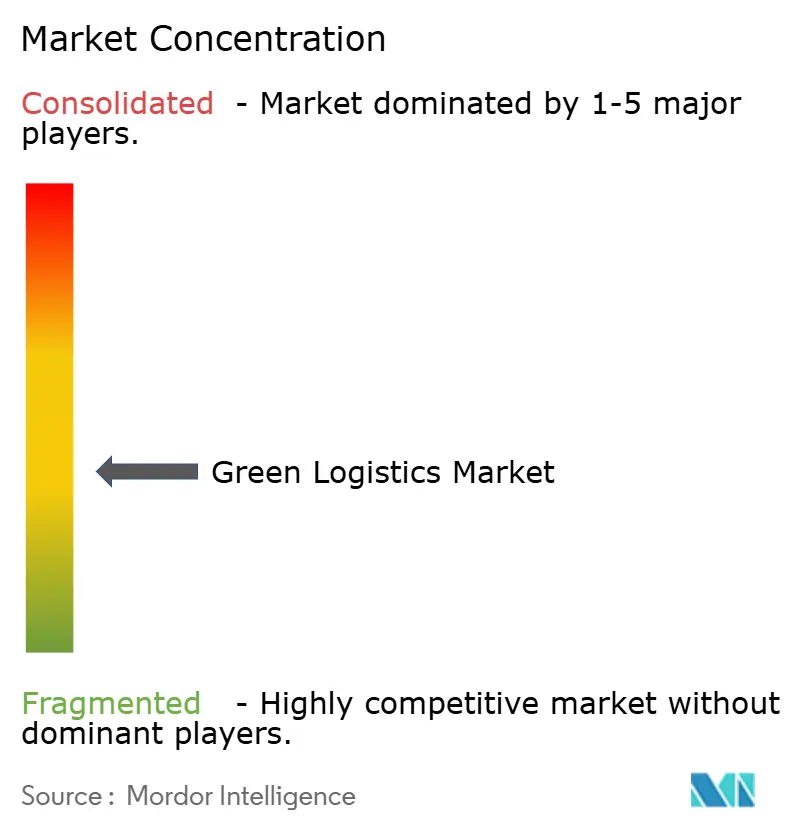
| Market Concentration | Medium |
Major Players *Disclaimer: Major Players sorted in no particular order Image © Mordor Intelligence. Reuse requires attribution under CC BY 4.0. | |
Green Logistics Market Analysis by Mordor Intelligence
The Green Logistics Market size was valued at USD 1.39 trillion in 2025 and estimated to grow from USD 1.5 trillion in 2026 to reach USD 2.18 trillion by 2031, at a CAGR of 7.79% during the forecast period (2026-2031).
Increased regulatory scrutiny, rapid electrification of transport assets, and the falling cost of renewables are reshaping procurement criteria as shippers link vendor selection to verifiable Scope 3 emissions cuts. Digital route-planning, battery-electric truck parity, and the rise of “green-as-a-service” contracts are reinforcing adoption across both industrial and consumer supply chains. Logistics providers that can demonstrate transparent, audited emissions reporting are already securing premium contracts, while those lagging in decarbonization face shrinking addressable demand in major trade lanes. Capital continues to migrate toward firms combining scale with technology partnerships, creating a widening capability gap that accelerates consolidation in the green logistics market.
Key Report Takeaways
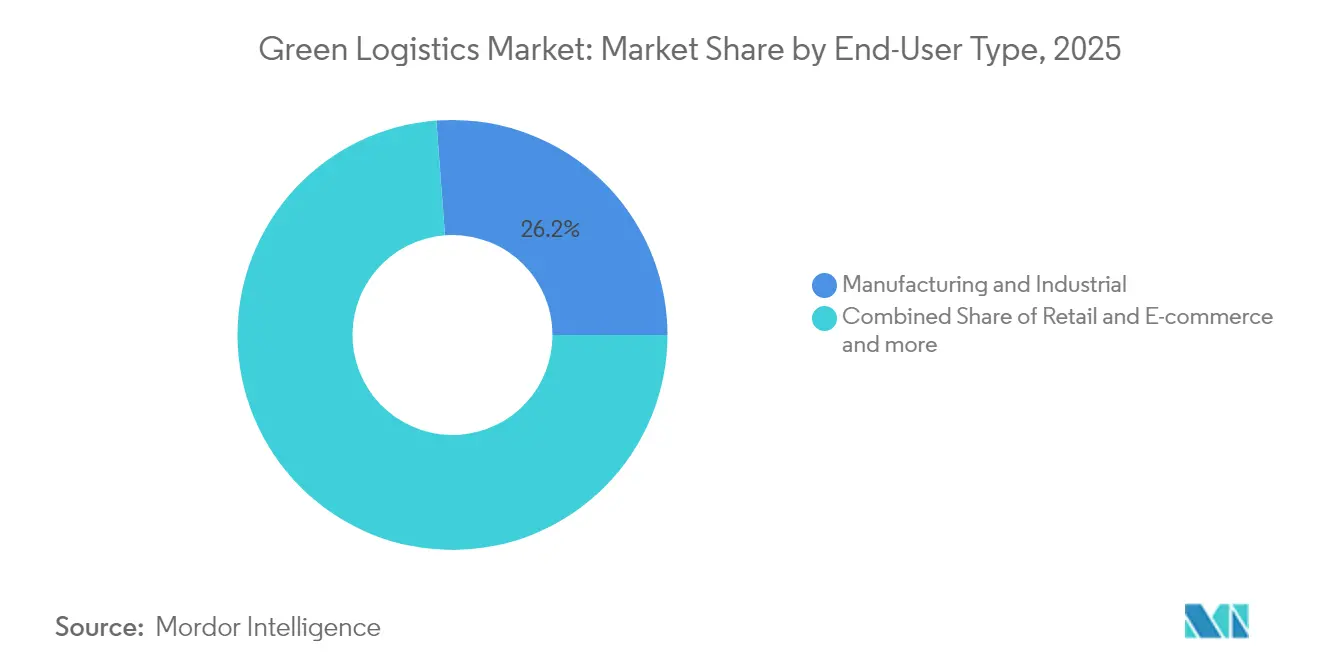
- By end user, manufacturing & industrial led with 26.20% of green logistics market share in 2025; retail & e-commerce is projected to grow at 17.35% CAGR between 2026-2031.
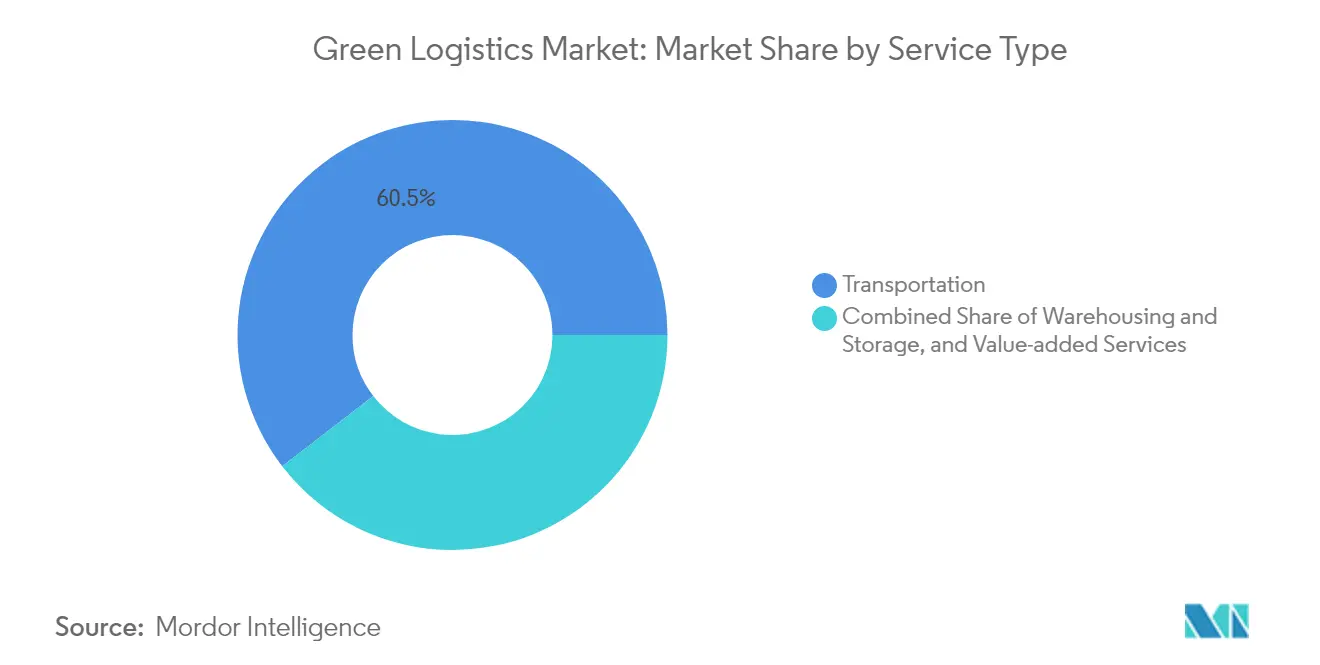
- By service type, transportation services held 60.45% of the green logistics market share in 2025, while reverse & return logistics is advancing at a 20.16% CAGR between 2026-2031.
- By transport mode, road accounted for 71.30% of green logistics market share in 2025; electric-road systems are forecast to post 18.14% CAGR between 2026-2031.
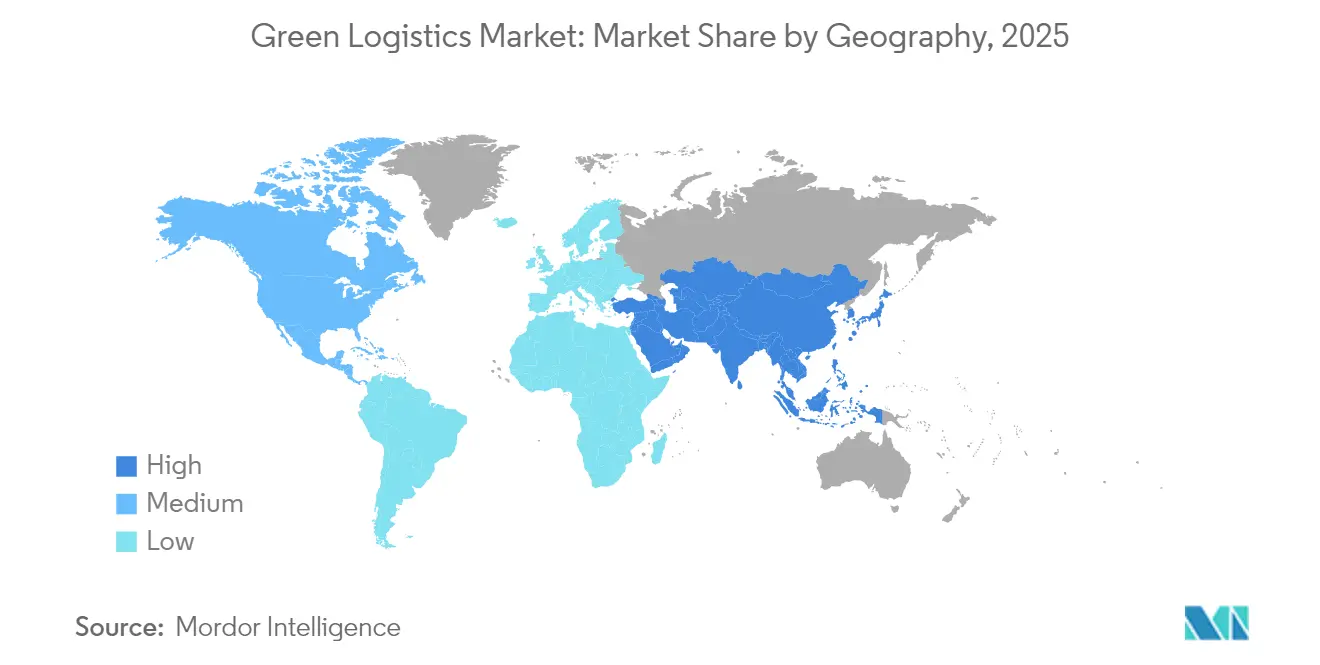
- By geography, APAC commanded 36.65% of the green logistics market share in 2025 and is set to expand at a 8.62% CAGR between 2026-2031.
Note: Market size and forecast figures in this report are generated using Mordor Intelligence’s proprietary estimation framework, updated with the latest available data and insights as of 2026.
Global Green Logistics Market Trends and Insights
Drivers Impact Analysis*
| DRIVER | (~) % IMPACT ON CAGR FORECAST | GEOGRAPHIC RELEVANCE | IMPACT TIMELINE |
|---|---|---|---|
| Net-zero mandates tightening across supply chains | +1.8% | Global (EU, California leading) | Medium term (2-4 years) |
| E-commerce boom and low-carbon last mile | +1.5% | Global urban centers | Short term (≤ 2 years) |
| Cost declines in battery-electric & fuel-cell trucks | +1.2% | North America, EU, APAC | Medium term (2-4 years) |
| AI-enabled route & load optimization | +0.9% | Global, developed markets first | Short term (≤ 2 years) |
| Roll-out of electric road systems | +0.7% | Nordic EU, APAC pilots | Long term (≥ 4 years) |
| “Green-as-a-service” contractual models | +0.6% | North America, EU | Medium term (2-4 years) |
| Source: Mordor Intelligence | |||
Net-zero mandates tightening across supply chains
Mandatory disclosure rules such as the EU Corporate Sustainability Reporting Directive and California’s Advanced Clean Truck regulation are forcing shippers to embed carbon criteria into bids, accelerating demand for certified low-emission services[1]European Commission, “Corporate Sustainability Reporting Directive,” ec.europa.eu . DHL already targets 30% sustainable aviation fuel (SAF) blending by 2030, while UPS plans fleet-wide carbon neutrality by 2050. Procurement leaders now allocate up to 3% of logistics budgets to compliance-linked decarbonization projects, turning emissions performance into a contract-winning differentiator. Providers showing audit-ready data enjoy first-mover advantages in lane awards, especially on EU-US trade flows. Absent credible roadmaps, carriers risk exclusion from preferred supplier lists as early as 2027.
E-commerce boom accelerating low-carbon last-mile solutions
Spiking parcel volumes concentrate emissions in dense urban nodes, where municipalities deploy zero-emission zones and congestion pricing. AI-guided routing of electric vans has cut delivery times by 15-20% while lowering CO2 by as much as 40% in large European capitals. Retailers such as Mars are co-funding 300 electric Class 8 trucks with Einride, targeting 20,000 t annual reductions by 2030. Although consumer willingness to pay premiums remains muted, regulatory incentives and brand commitments are pushing “green delivery” toward default status in the green logistics market.
Rapid cost declines in battery-electric & fuel-cell trucks
Battery pack prices for heavy-duty vehicles dropped 64-75% since 2020 and are expected to halve again by 2030, while fuel-cell systems chart similar curves. Research at Lawrence Berkeley National Laboratory shows Class 8 electrics already deliver 13% lower per-mile costs over the life of the asset. Fleet operators such as Schneider National surpassed 6 million electric miles in 2024, avoiding 20 million lb of CO2 and confirming commercial viability on high-density routes. Economic, rather than regulatory, triggers are now driving investment timing for fleet renewals.
AI-enabled route & load optimization, cutting emissions
Machine-learning models that incorporate elevation, weather, and traffic variables have lowered fuel burn by up to 5.7% while raising on-time performance mit.edu. Digital freight platforms reduce empty kilometers, improving asset-use economics and Scope 3 reporting precision supplychainmanagementreview.com. Start-ups such as Finmile report 20-30% diesel savings in last-mile operations through dynamic replanning, showcasing low-capex decarbonization levers.
Restraints Impact Analysis*
| RESTRAINT | (~) % IMPACT ON CAGR FORECAST | GEOGRAPHIC RELEVANCE | IMPACT TIMELINE |
|---|---|---|---|
| High upfront capex for zero-emission fleets & infrastructure | -1.4% | Global, acute in developing markets | Medium term (2-4 years) |
| Fragmented global standards for carbon reporting & green fuels | -0.8% | Global, severe in cross-border operations | Long term (≥ 4 years) |
| Limited charging & green-fuel infrastructure outside Tier-1 routes | -1.1% | Global, severe in rural and secondary corridors | Long term (≥ 4 years) |
| Rising litigation/penalties linked to ESG-greenwashing claims | -0.5% | North America & EU primarily, expanding globally | Short term (≤ 2 years) |
| Source: Mordor Intelligence | |||
High upfront capex for zero-emission fleets & infrastructure
Purchase premiums on battery-electric trucks range from USD 70,000-113,000 per unit, while megawatt chargers can exceed USD 3.1 million per kilometer on dedicated electric-road projects[2]International Council on Clean Transportation, “Total Cost of Ownership for Zero-Emission Trucks,” theicct.org. Smaller carriers struggle to secure financing, and uncertainty over residual values still dampens resale-based funding models. Although operating savings accumulate over time, near-term cash-flow strain hinders scale adoption in emerging economies lacking green credit facilities.
Limited charging & green-fuel infrastructure outside Tier-1 routes
High-speed chargers remain clustered around ports and primary highways, leaving rural and secondary lanes underserved. The European Automobile Manufacturers Association warns that sparse coverage adds 16-32% to journey times for battery trucks on cross-border routes. Infrastructure investors hesitate without throughput certainty, perpetuating a chicken-and-egg cycle that slows the green logistics market in lower-density regions.
*Our forecasts treat driver/restraint impacts as directional, not additive. The impact forecasts reflect baseline growth, mix effects, and variable interactions.
Segment Analysis
By End User: Manufacturing sustains leadership while e-commerce fuels momentum
Manufacturing & industrial shippers accounted for 26.20% of the green logistics market in 2025, reflecting decades-long compliance cultures and predictable shipping patterns that simplify emissions auditing. Their embedded supplier scorecards channel freight budgets toward providers with asset-based decarbonization roadmaps, reinforcing share dominance. Energy-intensive plants increasingly negotiate integrated renewable power and electric truck packages that lock in multiyear carbon reductions. Retail & e-commerce, though smaller today, is advancing at an 17.35% CAGR, propelled by urban micro-fulfilment centers and mandated zero-emission delivery windows in metropolitan zones. The green logistics market size for e-commerce shipments is set to climb sharply as returns volumes swell and merchants internalize the cost of “free” delivery. Automotive OEMs, meanwhile, trial electric car carriers to cut distribution emissions by 40% per unit, while healthcare brands co-invest in SAF corridors to safeguard cold-chain integrity without raising carbon intensity.
Electric-vehicle density, standardized pallets, and digitized bill-of-lading systems grant manufacturers visibility into cradle-to-gate footprints, enabling continuous optimization. In contrast, e-commerce operators leverage AI to orchestrate parcel lockers, bike couriers, and dark-store networks that eliminate failed delivery attempts. Both archetypes converge on data-centric performance dashboards that convert emissions tracking into a competitive procurement variable, illustrating how diverse end users amplify growth in the green logistics market.


By Service Type: Transport leads, but reverse logistics accelerates
Transportation services contributed 60.45% of 2025 revenue as fleets, fuel, and labor remain the costliest—and carbon-heaviest—elements of supply chains. Electrification of light-, medium-, and heavy-duty assets, paired with SAF commitments for air cargo, dominates capital expenditure. Reverse & return logistics, however, is the fastest-growing pocket, expanding 20.16% annually as circular-economy policies force retailers to reclaim products and packaging. Providers respond with automated sortation, refurbishment, and recommerce hubs that convert waste streams into secondary revenue. DHL’s acquisition of Inmar Supply Chain Solutions consolidated 14 centers under one platform, positioning the company to capture rising apparel and electronics return flows. Although still less than 10% of the green logistics market, reverse logistics unlocks disproportionate emissions savings relative to revenue, making it a strategic lever in decarbonization playbooks.
Electric-road-enabled trucking, rail revival, and inland waterways diversify modal portfolios. Road retained 71.30% share in 2025, yet rail’s ability to supplant 300 truckloads per train offers structural emissions advantages on suitable lanes. Meanwhile, high-BREEAM warehouses powered by onsite solar and battery storage shape the next frontier in asset decarbonization, demonstrating that facility design can negate operational emissions within a decade of commissioning.
Geography Analysis
APAC led the green logistics market with a 36.65% revenue share in 2025 and is growing fastest at 8.62% CAGR through 2031. China’s nationwide green-freight corridors and subsidies for electric Class 8 trucks accelerate fleet turnover, while India leverages new-build industrial parks to embed rooftop PV and EV charging from inception . Japan continues to modernize freight rail, expanding its modal shift program to lower highway congestion and cut logistics CO2. Southeast Asian nations capitalize on technology transfer, integrating battery swapping and microgrid solutions into port expansions to leapfrog legacy infrastructure.
North America remains the second-largest regional contributor, buoyed by the US federal target for 100% zero-emission truck sales by 2040 and tax credits that slash acquisition costs on Class 7-8 electrics. California’s Advanced Clean Truck rule already compels OEMs to meet escalating ZEV sales quotas, driving early deployment of charging hubs across I-5 and I-10 corridors. Canada’s anti-greenwashing legislation, effective June 2024, imposes fines up to CAD 10 million for misleading environmental claims, pushing carriers toward audit-ready disclosures, while Mexico promotes green-border programs that synchronize emissions standards on North-South trade routes.
Europe enjoys the world’s most sophisticated policy mix—carbon pricing, eHighway pilots, and 43% CO2 cut mandates for heavy trucks by 2030—making zero-emission freight a regulatory certainty. Sweden’s electric road classes expanded to over 50 km in 2025, generating performance data that informs Germany’s national rollout. Logistics firms deploy low-carbon fleets as a licence-to-operate; CEVA’s addition of 23 electric trucks curbs 38,300 t of CO2 annually, while integrated charging networks protect uptime. Eastern European lanes, though lagging infrastructure, attract EU cohesion funds earmarked for green corridors, promising convergence by the end of the decade.
The Middle East and Africa are nascent but rapidly mobilizing. The UAE’s Net Zero 2050 Strategy backs solar-powered logistics parks at Jebel Ali, and Saudi Arabia links green hydrogen pilots to freight trials on the Riyadh-Jeddah corridor. South Africa’s carbon tax nudges carriers toward biodiesel blends, yet grid reliability challenges slow widespread fleet electrification. Overall, regional heterogeneity ensures that localized policy incentives, infrastructure readiness, and industrial baselines dictate adoption speed, but each geography now features anchor projects that signal irreversible momentum in the green logistics market.

Competitive Landscape
The green logistics market remains moderately fragmented, yet consolidation is accelerating as scale and capital depth become prerequisites for large-scale decarbonization. DSV’s EUR 14.3 billion purchase of DB Schenker created a provider with EUR 41.6 billion in revenue and forecast DKK 9 billion in synergies, underscoring the premium on network density and pooled asset utilization. DHL couples vertical integration with an ecosystem of energy partners—Neste for SAF, E.ON for charging, and Envision for renewable power—to secure diversified green fuel access and stabilize operating costs.
UPS earmarked USD 1 billion for alternative fuel vehicles and reports 28.8% alternative fuel penetration in ground operations, leveraging proprietary telematics for continuous efficiency gains. FedEx channels USD 2 billion into sustainability, focusing on autonomous ground vehicles and carbon-neutral facilities. Asset-light forwarders lean on strategic alliances: Kuehne + Nagel expands SAF agreements to guarantee book-and-claim access for key customers, while GXO integrates AI-powered warehouse automation to lower energy per pick. Innovation white space persists in secondary-market infrastructure, reverse logistics software, and embedded carbon accounting services, offering runway for specialized entrants.
Price competition is tempered by the cost of green-capex programs; as a result, differentiation increasingly rests on emissions transparency, multimodal flexibility, and the ability to translate sustainability metrics into shippers’ ESG disclosures. With top-five players controlling roughly 38% of revenue, the market still offers room for regional specialists but is trending toward oligopolistic dynamics. Successful participants convert sustainability compliance into direct revenue by bundling carbon reporting dashboards, advisory services, and premium low-emission lanes. Lagging players risk relegation to price-taker status or face acquisition as capital requirements mount.
Green Logistics Industry Leaders
DHL Group
United Parcel Service (UPS)
FedEx Corporation
GEODIS
XPO Logistics
Bollore Logistics
- *Disclaimer: Major Players sorted in no particular order

Recent Industry Developments
- March 2025: DHL Group completed extended-range electric truck trials with Scania, recording 90% CO2 cuts across 22,000 km while operating 90% of duty cycles in electric mode.
- April 2025: DSV closed its EUR 14.3 billion acquisition of DB Schenker, forming a USD 41.6 billion revenue giant targeting DKK 9 billion in sustainability-linked synergies by 2028.
- February 2025: DHL and Neste expanded their SAF offtake agreement to 300,000 t annually by 2030, further exploring renewable diesel for road fleets.
- January 2025: DHL Supply Chain acquired Inmar Supply Chain Solutions, adding 14 return centers and 800 staff to bolster reverse logistics capacity


Research Methodology Framework and Report Scope
Market Definitions and Key Coverage
Our study defines the green logistics market as all revenue earned from third-party warehousing, distribution, transportation, reverse and value-added logistics services that purposefully deploy low-carbon fleets, energy-efficient storage, optimized routing software, circular packaging, and verified carbon-accounting dashboards. These activities span road, rail, sea, and air movements for manufacturing, retail e-commerce, healthcare, automotive, and other end users across every region.
Scope exclusion: in-house captive logistics spending and standalone carbon-credit trading are not counted.
Segmentation Overview
- By End User (Value, USD Bn)
- Retail & E-commerce
- Manufacturing & Industrial
- Automotive
- Healthcare & Pharmaceuticals
- Food & Beverages
- Chemicals & Hazardous Materials
- Others
- By Service Type (Value)
- Warehousing and Storage
- Transportation
- Road
- Rail
- Sea and Inland Waterways
- Air
- Value-Added Services (Packaging, Kitting, Labelling)
- Geography (Value)
- North America
- United States
- Canada
- Mexico
- South America
- Brazil
- Peru
- Chile
- Argentina
- Rest of South America
- Asia-Pacific
- India
- China
- Japan
- Australia
- South Korea
- South East Asia (Singapore, Malaysia, Thailand, Indonesia, Vietnam, and Philippines)
- Rest of Asia-Pacific
- Europe
- United Kingdom
- Germany
- France
- Spain
- Italy
- BENELUX (Belgium, Netherlands, and Luxembourg)
- NORDICS (Denmark, Finland, Iceland, Norway, and Sweden)
- Rest of Europe
- Middle East And Africa
- United Arab of Emirates
- Saudi Arabia
- South Africa
- Nigeria
- Rest of Middle East And Africa
- North America
Detailed Research Methodology and Data Validation
Primary Research
Multiple semi-structured interviews were conducted with fleet managers in Europe and North America, sustainability chiefs of Asia-Pacific contract logistics firms, and procurement heads at fast-moving consumer brands in Latin America and the Gulf. These discussions validated emission-based pricing premiums, typical electric vehicle utilization rates, and the pace at which shippers are switching contracts toward greener vendors.
Desk Research
Mordor analysts began by mapping the size of total logistics spend country by country using publicly available statistics from the World Bank Logistics Performance Index, UNCTAD port throughput tables, Eurostat transport energy balances, the International Transport Forum's decarbonization outlooks, and national motor vehicle registration databases. Policy levers were tracked through US EPA SmartWay, EU Fit for 55 directives, and IMO 2023 maritime fuel rules. Company filings, investor decks, and trade association whitepapers supplied adoption rates for electric trucks, solar-powered warehouses, and recyclable packaging. Paid databases such as D&B Hoovers and Dow Jones Factiva enriched provider revenue splits and deal pipelines. This list is illustrative; many additional sources were consulted for cross-checks and clarifications.
Market-Sizing & Forecasting
A top-down model starts with national freight and warehousing outlays, adjusts for the share attributed to external service providers, and then applies verified green adoption ratios drawn from desk and field work. Bottom-up spot checks, provider roll-ups, sampled average selling price multiplied by volume lanes, and city-level last-mile parcel data were layered in to fine-tune totals. Key variables include battery electric truck registrations, certified eco warehouse floor area, carbon price trajectories, e-commerce parcel growth, and diesel to alt fuel cost spreads. A multivariate regression gauges the elasticity between those drivers and historical green logistics revenue before an ARIMA overlay extends the forecast through 2030, and scenario ranges are stress tested with our expert panel. Data gaps in immature regions are bridged using region-specific penetration proxies anchored to GDP per ton kilometer.
Data Validation & Update Cycle
Outputs pass a three-tier analyst review, outlier variance checks against independent fuel consumption and trade tonnage series, and management sign-off. Reports are refreshed annually; interim updates are triggered when carbon regulation deadlines, battery price shocks, or mega M&A deals materially shift baselines.
Why Mordor's Green Logistics Market Baseline Commands Reliability
Published estimates differ because each publisher chooses its own boundaries, price assumptions, and refresh cadence.
Key gap drivers include divergent treatment of in-house services, whether reverse logistics is folded in, the currency conversion logic, and how quickly electric vehicle total cost of ownership curves are updated.
Mordor's scope mirrors real buyer spend and is recalibrated every twelve months, whereas others often retain older cost curves or widen the basket to adjacent freight functions.
Benchmark comparison
| Market Size | Anonymized source | Primary gap driver |
|---|---|---|
| USD 1.28 trillion (2024) | Mordor Intelligence | - |
| USD 1.51 trillion (2024) | Global Consultancy A | Includes inbound supply nodes and packaging services beyond green criteria |
| USD 1.54 trillion (2024) | Industry Analytics B | Uses generalized logistics spend with GDP elasticities, limited adoption filters |
| USD 1.16 trillion (2023) | Sector Publisher C | Earlier base year and excludes value-added reverse logistics |
Taken together, the comparison shows that Mordor's regularly refreshed, clearly delimited approach offers decision makers a balanced baseline that is firmly anchored to verifiable variables and repeatable steps.


Key Questions Answered in the Report
What is the current Green Logistics Market size?
In 2026, the Green Logistics Market size is expected to reach USD 1.5 trillion.
How fast is the green logistics market expected to grow?
It is forecast to record an 7.79% CAGR, reaching USD 2.18 trillion by 2031.
Which region dominates the green logistics market?
APAC holds the largest share at 36.65% and is also the fastest-growing region with a 8.62% CAGR to 2031.
Which service segment is expanding most rapidly?
Reverse & return logistics is projected to climb at a 20.16% CAGR, outpacing all other service lines.
What are the biggest obstacles to green logistics adoption?
High upfront capital costs for zero-emission fleets and limited charging infrastructure on secondary routes remain primary challenges.
How are major logistics companies decarbonizing their operations?
Market leaders invest in electric and alternative-fuel vehicles, sustainable aviation fuel agreements, and AI optimization tools while forming strategic energy partnerships to secure long-term green fuel supplies.
Page last updated on:


