Market Overview
| Study Period | 2021 - 2031 |
|---|---|
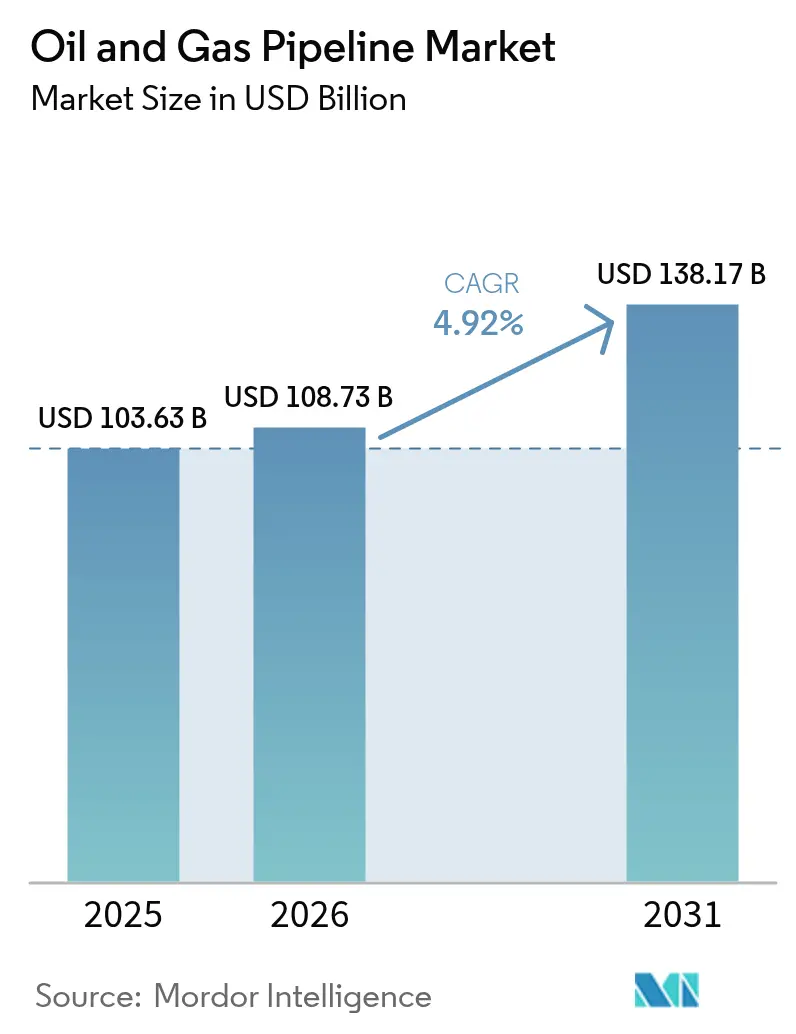
| Market Size (2026) | USD 108.73 Billion |
| Market Size (2031) | USD 138.17 Billion |
| Growth Rate (2026 - 2031) | 4.92% CAGR |
| Fastest Growing Market | Asia Pacific |
| Largest Market | Asia Pacific |
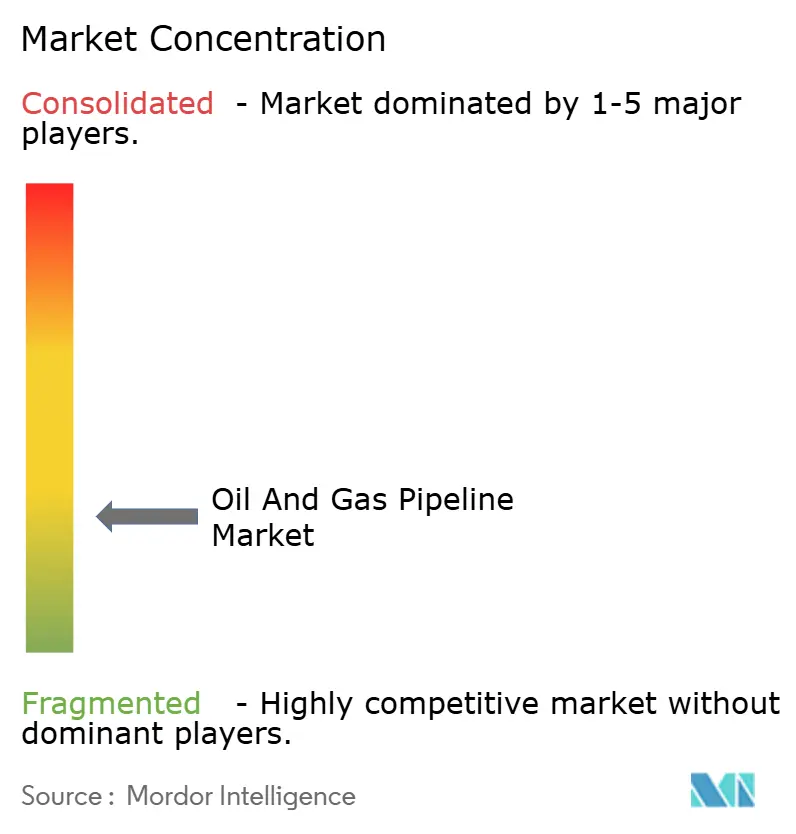
| Market Concentration | Low |
Major Players *Disclaimer: Major Players sorted in no particular order Image © Mordor Intelligence. Reuse requires attribution under CC BY 4.0. | |
Oil And Gas Pipeline Market Analysis by Mordor Intelligence
Oil And Gas Pipeline market size in 2026 is estimated at USD 108.73 billion, growing from 2025 value of USD 103.63 billion with 2031 projections showing USD 138.17 billion, growing at 4.92% CAGR over 2026-2031.
Heightened demand for intelligent, low-carbon infrastructure, generous government incentives for hydrogen-ready networks, and the development of North American export corridors are driving this expansion. Midstream operators are embedding AI-driven integrity analytics that lower unplanned downtime by 40% and trim annual operating expenses by 20%.(1)Rosen Group, “Predictive Integrity Analytics,” rosen-group.com At the same time, Europe’s REPowerEU framework and the United States’ Infrastructure Reduction Act have unlocked multi-billion-dollar subsidy pools for repurposing existing gas lines to carry hydrogen, extending the useful life of aging assets while future-proofing capacity. Offshore investment momentum is also gathering pace as deepwater discoveries in Guyana and Brazil demand specialized subsea flowlines that push metallurgical boundaries. Against this backdrop, the oil and gas pipeline market presents operators and suppliers with significant opportunities to monetize price differentials, diversify revenue streams, and mitigate capital risk through digitally enabled asset stewardship.
Key Report Takeaways
- By activity, capital expenditure accounted for 73.65% of the oil and gas pipeline market share in 2025, and this segment is also likely to grow the fastest, at a 5.03% CAGR through 2031.
- By function, distribution lines accounted for a 58.25% share of the oil and gas pipeline market size in 2025, while transmission lines are expected to expand at a 6.38% CAGR through 2031.
- By location, offshore installations are forecast to grow at a 7.05% CAGR to 2031, despite onshore systems retaining 85.05% of 2025 revenues.
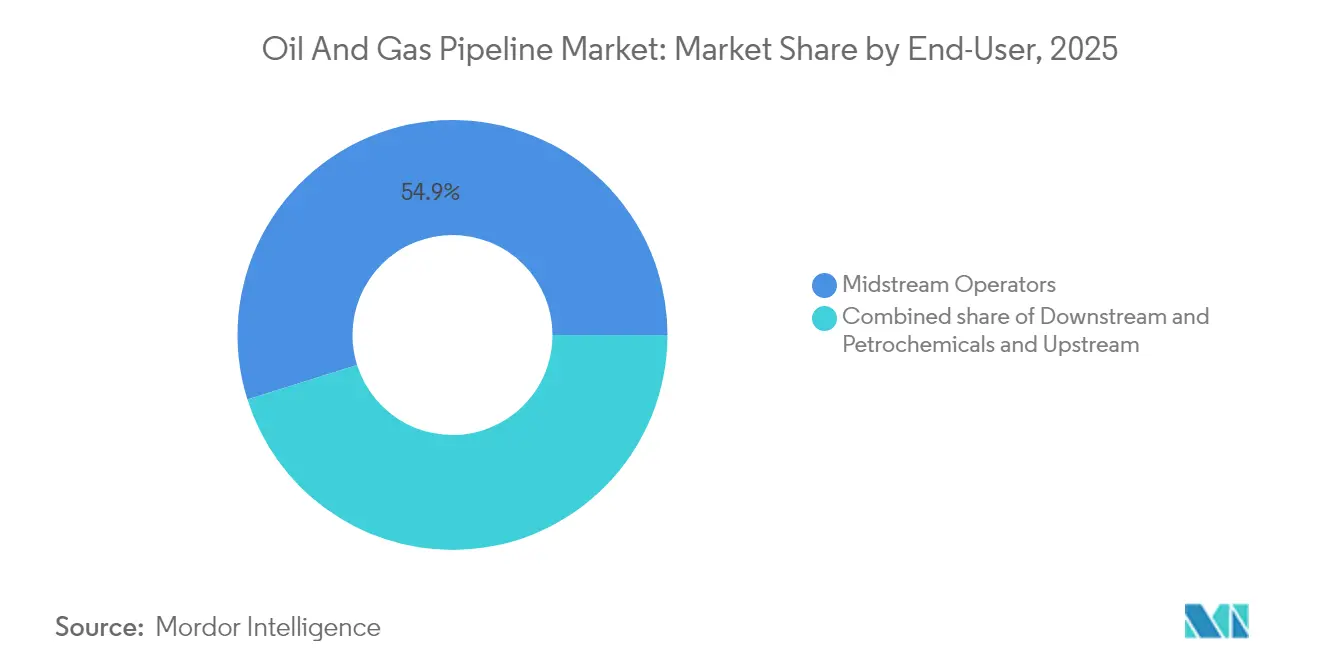
- By end-user, midstream operators accounted for a 54.85% revenue share in 2025 and are expected to remain the fastest-growing cohort, with a 5.28% CAGR through 2031.
- By geography, the Asia-Pacific region led with a 34.35% revenue contribution in 2025; it is projected to surge at a 6.46% CAGR, bolstered by India’s USD 67 billion gas grid expansion.
Note: Market size and forecast figures in this report are generated using Mordor Intelligence’s proprietary estimation framework, updated with the latest available data and insights as of 2026.
Global Oil And Gas Pipeline Market Trends and Insights
Drivers Impact Analysis*
| Driver | (~) % Impact on CAGR Forecast | Geographic Relevance | Impact Timeline |
|---|---|---|---|
| Permian associated-gas takeaway expansions stabilize Waha basis | +1.2% | United States (Texas, New Mexico) | Medium term (2-4 years) |
| Deepwater FPSO tie-backs in Guyana and Brazil spark subsea demand | +0.8% | South America | Long term (≥ 4 years) |
| US-Canada crude export corridors monetize price differentials | +0.6% | North America; Asia-Pacific buyers | Short term (≤ 2 years) |
| Hydrogen-ready pipeline retrofits unlock subsidy pools | +0.5% | United States & European Union | Long term (≥ 4 years) |
| AI-enabled integrity analytics cut OPEX and downtime | +0.4% | Global early adopters | Medium term (2-4 years) |
| FERC fast-track for small-diameter laterals accelerates gathering builds | +0.3% | United States shale basins | Short term (≤ 2 years) |
| Source: Mordor Intelligence | |||
Permian Associated-Gas Takeaway Expansions Stabilize Waha Hub Pricing
Kinder Morgan’s Permian Highway and Energy Transfer’s Warrior systems have added 4.1 Bcf/d of takeaway since early 2024, narrowing Waha basis differentials from −USD 2.50/MMBtu to −USD 0.75/MMBtu and cutting regional flaring by 35%.(2)Petrobras, “Mero Development Update,” petrobras.com.br Improved netbacks reinforce drilling economics, prompting producers to execute 15- to 20-year acreage dedications that underpin additional gathering and compression investments. Texas regulators are supporting the buildout by green-lighting USD 3.2 billion in new intrastate pipeline projects, shrinking environmental review cycles, and lowering financing risk.
Deepwater FPSO Tie-Back Pipelines Accelerate Subsea Order Books
ExxonMobil’s Stabroek Block in Guyana requires eight FPSOs connected by 450 km of flowlines by 2030, while Petrobras has awarded USD 2.8 billion for flexible subsea pipes in Brazil’s Mero and Búzios fields.(3)Railroad Commission of Texas, “Pipeline Project Approvals,” rrc.texas.gov Flexible thermoplastic composite pipe pioneered by TechnipFMC withstands 15,000 psi yet slices installation cost by 25%. Concentrated demand is driving fabrication yards in Brazil and Trinidad to achieve 15% cost efficiencies through bulk procurement and local content mandates.
US-Canada Crude Export Corridors Monetize Price Differentials
Completion of the Trans Mountain Expansion in 2024 shrank Western Canadian Select-WTI discounts from −USD 18/bbl to −USD 8/bbl within six months.(4)Petrobras, “Mero Development Update,” petrobras.com.br Complementary upgrades such as Enbridge’s Line 3 and Energy Transfer’s Dakota Access expansions have unlocked 1.2 million bbl/d of cross-border capacity, enabling refiners to arbitrage Gulf Coast and Asian pricing windows. Producers have responded with long-term ship-or-pay contracts totaling 400,000 barrels per day, reinforcing predictable cash flows for lenders.
Hydrogen-Ready Pipeline Retrofits Unlock Subsidy Pools
The United States has earmarked USD 8 billion for hydrogen infrastructure, 40% of which will target pipeline conversions. German transmission operators, backed by EUR 18 billion in commitments, plan to convert 11,200 km of gas lines for hydrogen service by 2032. Materials advances, such as Tenaris’ X70 H₂-tolerant steel, mitigate embrittlement, while TC Energy’s Alberta pilot validated 20% hydrogen blending without major upgrades, thereby extending the life of stranded gas assets.
Restraints Impact Analysis*
| Restraint | (~) % Impact on CAGR Forecast | Geographic Relevance | Impact Timeline |
|---|---|---|---|
| Growing ESG-led capital flight from long-lived oil trunklines | -0.7% | Global, most pronounced in Europe and North America | Long term (≥ 4 years) |
| Heightened ransomware & OT-cyber threats drive insurance costs | -0.5% | Global, with acute impact in North America and Europe | Short term (≤ 2 years) |
| Rising large-diameter steel prices widen project IRR hurdle rates | -0.4% | Global, particularly affecting CAPEX-intensive projects | Medium term (2-4 years) |
| Accelerating renewables-to-grid penetration cannibalises refined-product demand | -0.3% | Europe and North America, expanding to Asia-Pacific | Long term (≥ 4 years) |
| Source: Mordor Intelligence | |||
Growing ESG-Led Capital Flight from Oil Infrastructure
Global asset managers controlling USD 130 trillion have adopted exclusion criteria that have curtailed pipeline financing, driving borrowing costs up by 200-300 bp for projects lacking transition alignment. European banks now demand credible net-zero pathways by 2050, effectively sidelining greenfield crude lines with 40-year design lives. Operators are pivoting; TC Energy channels 30% of its USD 7 billion program into hydrogen-ready and carbon-capture assets, while private capital targets higher-return modernization plays.
Heightened Cybersecurity Threats Drive Insurance Costs
Following the "Colonial Pipeline" ransomware attack, cyber insurance premiums for critical energy assets have increased by 150%, and coverage limits have decreased by 40%. Kinder Morgan's USD 200 million OT-security program now accounts for 3% of its annual capital expenditures. PHMSA mandates incident reporting and fines of up to USD 2 million for non-compliance, compelling operators to deploy AI threat detection, air-gapped SCADA systems, and redundant control centers. Robust cyber postures increasingly influence shipper decisions, shifting competition from tariff levels to reliability guarantees.
*Our forecasts treat driver/restraint impacts as directional, not additive. The impact forecasts reflect baseline growth, mix effects, and variable interactions.
Segment Analysis
By Activity – CAPEX Investments Sustain Infrastructure Buildouts
Capital expenditure captured 73.65% of the oil and gas pipeline market share in 2025, supported by multi-billion-dollar projects such as Energy Transfer’s USD 6 billion Warrior system and TC Energy’s USD 4.5 billion Southeast Gateway line. Roughly 60% of CAPEX outlays are allocated to pipe materials and compression equipment, a share inflated by hydrogen-compatible X70 and X80 grades that command 25% price premiums over legacy alloys. Construction services account for the remaining 40%, yet chronic shortages of certified welders have stretched average build schedules by four months, thereby elevating contingency costs for developers. Engineering contractors mitigate these delays through modular spool fabrication and automated welding rigs, techniques that can lift weekly lay rates by 12% on linear spreads. Sub-segment prioritization increasingly favors lines with dual-service potential, such as natural gas today and hydrogen tomorrow, helping owners future-proof their assets against stranded-capital risk.
OPEX accounts for 26.35% of 2025 revenue but is evolving rapidly; AI-enabled inspections reduce survey frequency from triennial to quinquennial cycles, resulting in a 30% cost reduction. Inline inspection tools with ultrasonic crack detection identify micro-fissures that are invisible to older magnetic methods, thereby raising asset reliability. Decommissioning remains a niche market today but is expected to accelerate after 2028 as North American legacy assets approach the end of their life, unlocking specialized remediation opportunities.


By Function – Distribution Networks Secure Largest Revenue Pool
Distribution networks contributed 58.25% revenue in 2025, underpinned by dense residential and commercial demand in OECD nations. Smart meters and automated pressure controls are lowering leak incidents and enhancing regulatory compliance. The oil and gas pipeline market size for distribution lines is projected to rise steadily as urban centers electrify their heating systems with gas-fired backup and adopt hydrogen readiness.
Transmission systems, although smaller, are growing at a faster rate, with a 6.38% CAGR projected to 2031. Interstate lines, such as Mountain Valley and Coastal GasLink, cost roughly USD 8 million per mile due to high-spec compressors and thicker walls. Regulatory priority for energy-security projects reduces approval friction, and updated FERC policies reward ventures that cut regional price volatility. Gathering networks, closely tied to unconventional drilling, add 2.5 miles of pipe per horizontal well, anchoring midstream CAPEX in shale basins.
By Location – Onshore Pipelines Retain Dominance
Onshore infrastructure maintained an 85.05% share in 2025, thanks to established rights-of-way and standardized permitting processes that result in average build durations of 18 months. India’s 9,630-mile grid build, backed by USD 67 billion, illustrates the scale of the upcoming terrestrial opportunity. Horizontal directional drilling and micro-tunneling mitigate surface disruption, easing community acceptance.
Offshore segments, which account for only 14.95% of 2025 revenue, are expected to grow at a 7.05% CAGR as ultra-deepwater fields (greater than 1,500 m) proliferate. Brazil alone will invest USD 4.2 billion in presalt pipelines by 2026, leveraging standardized subsea layouts that reduce per-mile outlays by 20%. Guyana’s rapid production ramp is spawning a regional fabrication hub that benefits from economies of scale and streamlined export tax regimes.
By End-User – Midstream Operators Consolidate Market Power
Midstream entities commanded 54.85% of the revenue in 2025 and are expected to expand at a 5.28% CAGR, driven by fee-based toll structures that hedge against commodity price swings. ONEOK’s USD 18.8 billion purchase of Magellan Midstream unites crude, NGL, and refined-product corridors into a single utility-like platform, boosting utilization and cross-selling. Energy Transfer’s acquisition of WTG Midstream strengthens gathering footprints in high-growth shale basins while positioning for carbon-capture service add-ons.
Upstream E&P influence pipeline build schedules through volume commitments; long-term dedications derisk financing, though they rarely own lines directly. Downstream and petrochemical players require specialized pipes for ethane, propane, and hydrogen, which are tied to Gulf Coast crackers, spurring niche growth. Master limited partnerships, formerly dominant in financing, have been nudged by tax reforms toward C-corp status to enhance strategic flexibility.
Geography Analysis
Asia-Pacific dominated 2025 revenue at 34.35% and posts the fastest 6.46% CAGR through 2031. India's trunkline blitz will connect remote gasfields to urban hubs, fostering industrial gas use and displacing coal in power generation. China's Power of Siberia and Central Asia integrations deepen supply diversity and reduce LNG dependence, while emerging Southeast Asian economies court public-private partnerships to fund cross-border pipes.
North America remains pivotal as shale output pushes incremental takeaway builds and AI-enabled upgrades improve network uptime. The oil and gas pipeline market size for North America is projected to keep expanding as Gulf Coast export hubs secure additional feedgas pipes for LNG terminals. Europe's focus is on retrofitting gas grids for hydrogen, channeling REPowerEU grants to accelerate conversions and lower Russian supply risk. The Middle East and Africa offer greenfield prospects linking gas-rich basins to coastal demand centers, but geopolitical risk and financing gaps restrain near-term momentum. South America's opportunities center around Brazil's presalt and Argentina's Vaca Muerta gas evacuation, where regional cooperation frameworks aim to standardize regulatory and tariff regimes.


Regulatory Landscape
Pipeline regulation is tightening around integrity management, cybersecurity, and environmental review timelines, with U.S., EU, and Canadian authorities shaping baseline expectations for operators. In the United States, PHMSA advanced integrity-management updates in 2026, including an Integrity Management alternative tied to class location changes (effective March 16, 2026) and an April 2026 direct final rule clarifying Appendix C of 49 CFR part 195 for hazardous liquid and CO2 pipelines, particularly for High-Consequence Area determination and related IM implementation expectations.
In Europe, energy infrastructure policy is being aligned with security-of-supply and decarbonization corridors, with the European Commission adopting Regulation (EU) 2026/764 in December 2025 updating the Union list of projects of common interest and mutual interest (including smart gas grids and CO2 transport networks). Member States have a March 1, 2026 deadline to submit national diversification plans. In Canada, the Canada Energy Regulator has kept compliance pressure high through management system audits against the Onshore Pipeline Regulations (SOR/99-294) during 2024-2025, reinforcing operator requirements for demonstrable protection programs, control-room management, and continuous improvement practices.
Competitive Landscape
The oil and gas pipeline market exhibits moderate fragmentation with heightened pressure to integrate digital capabilities. Steel producers Tenaris and TMK differentiate themselves through hydrogen-compatible grades, which trade at a 25% price premium.(7)Tenaris, “Bay City Mill Launch,” tenaris.com Engineering contractors TechnipFMC and Saipem leverage deepwater installation fleets and flexible pipe IP that yield a competitive moat in ultra-deep projects.
ONEOK’s vertical integration following the Magellan takeover reduces third-party handling and captures margin across gathering, transmission, and distribution. Enbridge’s machine-learning rollout over 28,000 km of assets delivered USD 45 million in annual savings and underpins 99.8% uptime guarantees, which justify a 12% tariff adder. Kinder Morgan’s AI-based leak detection, spanning 5,000 miles, cuts inspection costs by USD 25 million while elevating safety compliance.
High barriers, regulatory approval, land acquisition, and substantial capital expenditures limit new entrants. Yet, niche disruptors targeting carbon-capture corridors or hydrogen blends are emerging, often backed by private equity firms seeking double-digit returns in transition-aligned infrastructure. Cyber resilience and ESG credentials are increasingly decisive procurement criteria as shippers weigh reliability and sustainability over headline tariff rates.
Oil And Gas Pipeline Industry Leaders
Enbridge Inc.
Kinder Morgan Inc.
Energy Transfer LP
TC Energy Corp.
Tenaris S.A.
- *Disclaimer: Major Players sorted in no particular order

Market Opportunities and Future Outlook
A key whitespace for pipeline developers and service providers is infrastructure that combines traditional hydrocarbon flow assurance with transition-aligned capabilities, particularly hydrogen and CO2 transport readiness. Policy and funding signals continue to support repurposing and modernization: the United States has earmarked USD 8 billion for hydrogen infrastructure with a material share aimed at pipeline conversions, and Germany has announced commitments to convert 11,200 km of gas lines for hydrogen service by 2032. On the materials and services side, hydrogen-tolerant steel grades (including Tenaris X70 H2-tolerant offerings referenced in the report context) and integrity-focused digital tools track the same retrofit activity, shifting spend toward higher-spec pipe, inspection, and control-system upgrades rather than only newbuild mileage.
Near-term opportunity is also visible in major gas takeaway and export-corridor build activity, which raises demand for transmission additions, compressor stations, and related construction services. The United States is tracking a large wave of natural gas pipeline capacity additions in 2026 (44.9 Bcf/d cited by EIA), and North American corridor economics have already been reinforced by projects such as the 2024 Trans Mountain Expansion reducing WCS-WTI discounts in the report context. At the project level, bundling pipelines with decarbonization initiatives is becoming more common, illustrated by the May 2026 Canada and Alberta implementation agreement to advance a west coast pipeline proposal alongside the Pathways Project carbon capture initiative, which creates combined demand for CO2 transport planning, materials qualification, and permitting support services.
Recent Industry Developments
- May 2026: Tenaris announced a CAD 300 million investment in its Sault Ste. Marie Industrial Centre to expand seamless and ERW steel pipe production capacity. The spend targets higher-value pipe demand linked to newbuild transmission projects and upgrades, including materials used in integrity-critical and hydrogen-ready applications, and it supports regional supply availability for North American pipeline programs.
- January 2025: TC Energy completed the USD 4.5 billion Southeast Gateway Pipeline, adding 1.5 Bcf/d of gas capacity from Texas to Florida markets. The in-service milestone expands downstream market access and provides a reference project for large-diameter gas transmission buildouts requiring complex permitting, compression, and reliability commitments.
- September 2024: Tenaris inaugurated its USD 1.2 billion Bay City mill, positioned as a US plant dedicated to hydrogen-ready seamless pipe. The commissioning increased domestic manufacturing capability for high-spec pipeline steel, supporting operators focused on modernization and conversion projects where material qualification and lead times directly affect construction schedules.


Research Methodology Framework and Report Scope
Market Definition and Coverage
This market covers the revenue generated from building, expanding, and upgrading oil and natural gas pipeline systems, including onshore and offshore networks. It includes project activity linked to crude oil pipelines and gas pipelines where pipeline transportation infrastructure is the core deliverable.
Scope exclusions: We exclude downstream storage terminals, LNG liquefaction and regasification assets, and non-pipeline transport modes such as rail and trucking.
Segmentation Overview
- By Activity
- CAPEX
- Pipeline Materials & Equipment
- Pipeline Fabrication & Construction
- OPEX
- Inspection
- MRO
- Decommissioning
- CAPEX
- By Function
- Gathering Lines
- Transmission Lines
- Distribution Lines
- By Location of Deployment
- Onshore
- Offshore
- By End-user Sector
- Upstream (E&P)
- Midstream Operators
- Downstream & Petrochemicals
- By Geography
- North America
- United States
- Canada
- Mexico
- Europe
- Germany
- France
- United Kingdom
- Spain
- NORDIC Countries
- Turkey
- Russia
- Rest of Europe
- Asia-Pacific
- India
- China
- South Korea
- Japan
- Malaysia
- Thailand
- Indonesia
- Vietnam
- Rest of Asia-Pacific
- South America
- Brazil
- Argentina
- Colombia
- Rest of South America
- Middle East and Africa
- Saudi Arabia
- United Arab Emirates
- South Africa
- Egypt
- Rest of Middle East and Africa
- North America
Data Sources, Market Sizing, and Validation
Desk Research
Desk work starts by mapping the demand triggers that typically lead to pipeline awards and spend, and then aligning them to regional energy balances and trade flows. We referenced public sources such as the International Energy Agency, U.S. Energy Information Administration, U.S. Federal Energy Regulatory Commission, Eurostat, and national statistics offices, since they provide grounding for oil and gas production, consumption, and cross border movements.
To keep assumptions practical, we also reviewed company annual reports, investor presentations, and public project announcements, then followed up with reputable press coverage and regulator filings where available. Patent databases and a shipment level import and export database were used selectively to validate material flows (for example, line pipe movements) and procurement timing. The sources listed here are illustrative, and many other public documents and datasets were used to collect, validate, and clarify the analysis.
Primary Interviews and Surveys
Primary discussions were used to verify how pipeline projects convert into revenue, since timing, contract structure, and cost inflation can shift annual totals. We spoke with a mix of pipeline owners, EPC and engineering teams, component and material suppliers, and local industry bodies across APAC, EMEA, and the Americas. After those interviews, we rechecked key inputs where secondary signals did not match.
Distribution of primary research fieldwork respondents
| Company type | Respondent position | Region |
|---|---|---|
| Top tier: 26% | CXOs: 17% | APAC: 38% |
| Mid tier: 57% | Functional/Unit leaders: 30% | EMEA: 36% |
| Smaller Players: 17% | Managers: 53% | Americas: 26% |
Market-Sizing & Forecasting
Sizing is built using a top-down structure where production, consumption, and cross border movement indicators are used to reconstruct where pipeline capacity additions and replacements are most likely to be required, and then converted into annual revenue using observed project economics. Since different regions move through planning, permitting, and execution at different speeds, the model also tracks sanctioned versus announced project mix so the year-by-year split stays realistic.
Once regional totals are formed, we corroborate them with selective bottom-up checks such as sampled project value per kilometer, typical diameter mix for major corridors, and channel checks on line pipe and key component demand, which are used to adjust outliers. Inputs used in the model include crude and gas throughput trends, upstream production outlook, pipeline utilization and bottleneck signals, construction cost inflation, and replacement activity driven by integrity and safety needs. For forecasting, scenario analysis is applied around capital allocation, permitting pace, and commodity price sensitivity, and then the mid case is chosen based on what interviewees view as most probable for award cycles. Where project disclosure is thin, gaps are handled using regional averages from comparable projects and then stress testing them against public capex guidance and trade indicators.
Data Validation & Update Cycle
Validation is done by comparing model outputs with independent signals such as announced pipeline kilometers, capex guidance, and regional throughput constraints, and then checking if the direction and magnitude make sense. If a large variance appears, the assumptions are revisited, supporting datapoints are re-read, and selective re-contacts are triggered to confirm what changed and why.
Before sign-off, the full worksheet goes through more than one analyst review so that formula logic, currency conversions, and year mapping are consistent across regions. The report is refreshed annually, and interim updates are added when material events occur, such as major sanctioning waves, large cancellations, or sharp cost inflation. Right before delivery, a final pass is completed so clients receive the most current view available at that time.
Mordor Intelligence's Oil and Gas Pipeline Market Size Measured Against Other Published Estimates
Published market values for oil and gas pipelines can look far apart, even when they appear to be describing the same scope. The differences usually come from how each study draws the market edges, which year is treated as the base, and how project timing and pricing are translated into yearly revenue.
The main gap comes from whether adjacent midstream activities are folded into the number. Mordor Intelligence counts pipeline revenue tied to oil and gas pipeline build and upgrade work, but does not roll in broader midstream services such as storage terminals or processing that often sit next to pipeline budgets. Other gaps come from how onshore versus offshore project pacing is treated, whether announced projects are assumed to convert quickly, how construction cost inflation is carried forward, and how currency timing is handled when regional spending is aggregated into USD.
Benchmark comparison
| Source | Market Size | Gaps in Research Methodology |
|---|---|---|
| Mordor Intelligence | USD 108.73 B (2026) | |
| Global Consultancy A | USD 113.55 B (2025) | Uses a different base year and often blends upstream, midstream, and downstream pipeline related spending together, which can lift the total when non-pipeline adjacent activities are included. |
| Industry Publisher B | USD 80.37 B (2024) | Earlier base year and a longer forecast horizon can amplify growth assumptions, and offshore weighting plus faster assumed project conversion can shift the current-year figure versus a revenue recognition view. |
Seen together, the spread is mostly explained by scope choices and how project pipelines are translated into annual revenue, not by a disagreement that pipelines are growing. By tying the total to observable project cadence, inflation signals, and cross checks from trade and capex indicators, we keep the estimate traceable to inputs that can be rechecked year after year.


Key Questions Answered in the Report
How large is the oil and gas pipeline market in 2026?
It stands at USD 108.73 billion in 2026 and is on track for USD 138.17 billion by 2031, implying sustained mid-single-digit annual growth.
Which region contributes the most revenue?
Asia-Pacific leads with a 34.35% share, propelled by India's and China's aggressive gas pipeline programs.
What is driving new offshore pipeline demand?
Deepwater fields in Brazil and Guyana require advanced flexible flowlines that withstand high pressure and temperature, lifting offshore spend at 7.05% CAGR.
Why are hydrogen-ready retrofits gaining traction?
U.S. and EU subsidies cut conversion costs, extend asset life, and position operators for the emerging hydrogen economy.
How are operators cutting operating costs?
AI-driven integrity analytics predict failures six months early, trimming unplanned downtime by 40% and lowering inspection budgets by 30%.
What level of market concentration exists today?
Moderate; the top five players hold around 60% of installed mileage, yielding a concentration score of 6/10.
Page last updated on:


