Market Overview
| Study Period | 2021 - 2031 |
|---|---|
| Forecast Data Period | 2026 - 2031 |
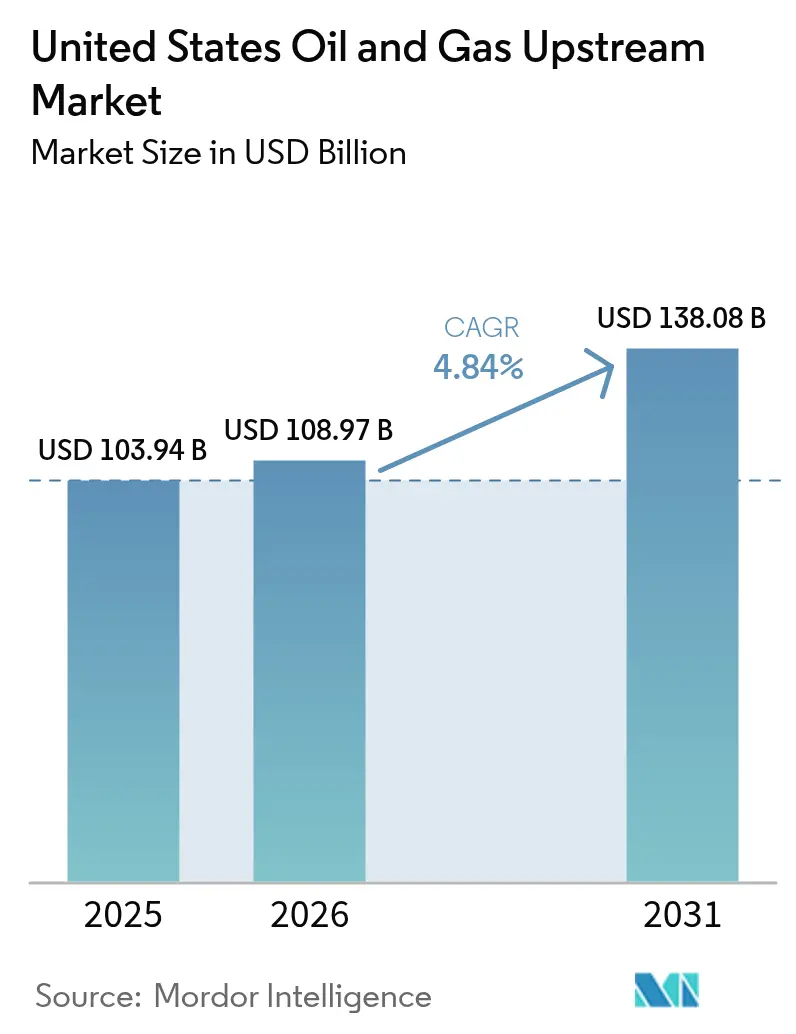
| Base Year Market Size (2025) | USD 103.94 Billion |
| Market Size (2026) | USD 108.97 Billion |
| Market Size (2031) | USD 138.08 Billion |
| Growth Rate (2026 - 2031) | 4.84% CAGR |
| Market Concentration | Low |
Major Players *Disclaimer: Major Players sorted in no particular order Image © Mordor Intelligence. Reuse requires attribution under CC BY 4.0. | |
United States Oil And Gas Upstream Market Analysis by Mordor Intelligence
The United States Oil And Gas Upstream Market size is expected to grow from USD 103.94 billion in 2025 to USD 108.97 billion in 2026 and is forecast to reach USD 138.08 billion by 2031 at 4.84% CAGR over 2026-2031.
Technology-enabled cost optimization, disciplined capital deployment, and digital drilling analytics that cut non-productive time by 15–20% are the primary growth engines behind the US oil and gas upstream market. Operators are increasingly concentrating their spending on proven shale basins, utilizing artificial intelligence and automation to enhance recovery rates from existing wells while reducing overall breakeven costs. Selective capital allocation toward high-return projects in the Permian Basin and the Gulf of Mexico underpins the sector’s resilience, even as commodity prices fluctuate. Near-term momentum also stems from LNG-export build-outs that add new natural-gas takeaway capacity and from Inflation Reduction Act incentives that monetize carbon capture and storage projects.
Key Report Takeaways
- By location of deployment, onshore drilling held a 74.18% share of the US oil and gas upstream market in 2025, while offshore production is projected to expand at a 5.66% CAGR through 2031
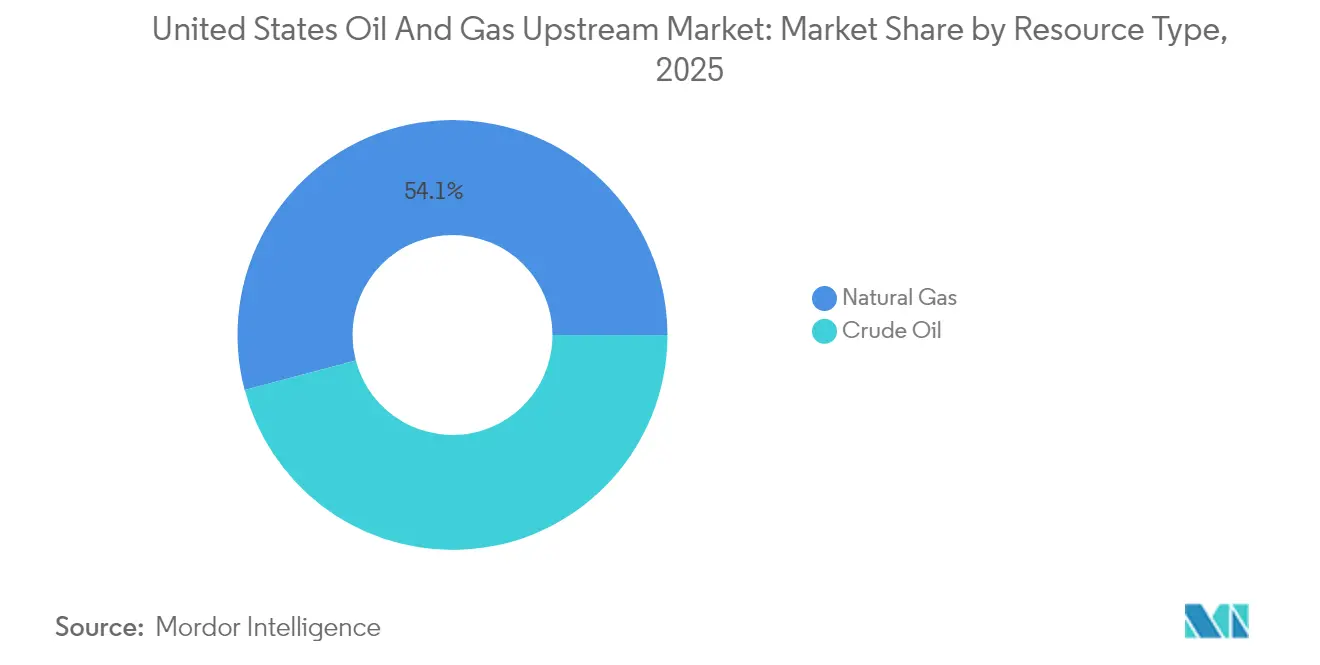
- By resource type, natural gas commanded 54.12% of the US oil and gas upstream market share in 2025 and carries the fastest growth outlook at a 5.17% CAGR to 2031
- By well type, unconventional wells accounted for 64.62% of the US oil and gas upstream market size in 2025 and are projected to grow at a 4.98% CAGR through 2031
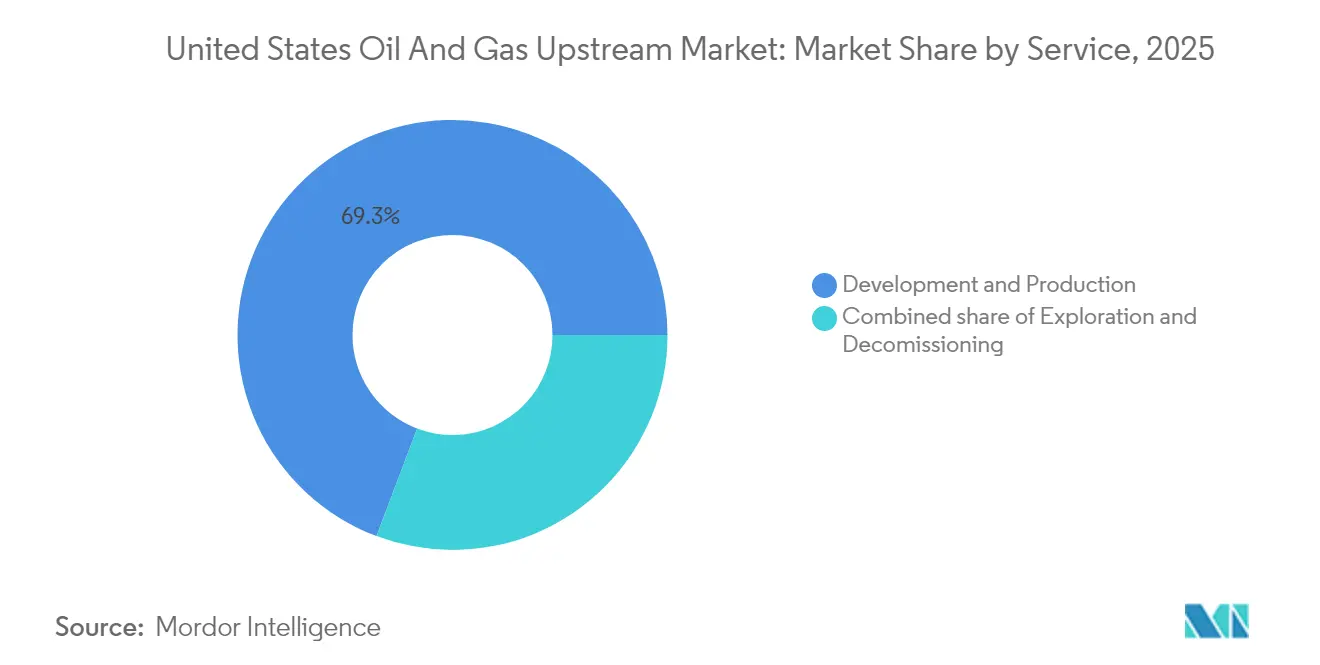
- By service, development and production services controlled 69.25% of spending in 2025, whereas decommissioning is forecast to register the highest 6.74% CAGR over the next five years
Note: Market size and forecast figures in this report are generated using Mordor Intelligence’s proprietary estimation framework, updated with the latest available data and insights as of 2026.
United States Oil And Gas Upstream Market Trends and Insights
Drivers Impact Analysis*
| Driver | (~) % Impact on CAGR Forecast | Geographic Relevance | Impact Timeline |
|---|---|---|---|
| Cost optimization through digital drilling analytics | 1.20% | Permian, Eagle Ford, Bakken | Short term (≤ 2 years) |
| Proliferation of horizontal shale drilling in the Permian Basin | 1.10% | Texas, New Mexico | Medium term (2-4 years) |
| Rising LNG-export infrastructure boosting gas drilling | 0.90% | Gulf Coast, Appalachia | Long term (≥ 4 years) |
| Inflation Reduction Act CCS incentives accelerating EOR projects | 0.70% | Texas, Louisiana, North Dakota | Medium term (2-4 years) |
| Re-fracking of mature shale wells extending field life | 0.60% | Permian, Eagle Ford, Bakken | Short term (≤ 2 years) |
| De-risked deep-water plays in the Gulf of Mexico | 0.40% | Gulf of Mexico federal waters | Long term (≥ 4 years) |
| Source: Mordor Intelligence | |||
Cost Optimization Through Digital Drilling Analytics
Digital drilling analytics reduce well costs by 10–15%, primarily by shortening drilling cycles and minimizing downhole incidents. SLB’s Neuro platform processes 1,000 data points per second and has reduced drilling time by 20% in the Permian Basin.[1]SLB, “Neuro Autonomous Drilling Platform,” slb.com Halliburton’s LOGIX system has logged 95% automated drilling on recent wells, cutting total spud-to-TD time by 30%. Corva’s cloud-hosted dashboard predicts stick-slip, differential sticking, and other hazards hours in advance, lowering unexpected downtime by 30%.[2]Halliburton, “LOGIX Automated Drilling Performance,” halliburton.com As algorithms learn from every run, performance gains become cumulative, pushing breakevens downward. The approach is especially attractive to smaller operators that can now lease software on a subscription basis rather than invest upfront in proprietary platforms.
Proliferation of Horizontal Shale Drilling in the Permian Basin
Extended-reach horizontals in the Permian yield initial production 30–40% higher than vertical counterparts, and active rigs topped 315 units—60% of the U.S. total—in late 2024. Average lateral lengths in core acreage already exceed 10,000 ft, with multi-zone completions improving recovery across stacked benches. Pad drilling reduces surface disturbance and trims per-well costs by 15–20% compared to single-well pads. Permian firms also benefit from mature transport and processing grids, which lower gathering costs and minimize flaring. Network effects entice additional capital, reinforcing the basin’s lead in short-cycle supply.
Rising LNG-Export Infrastructure Boosting Gas Drilling
LNG facilities added 2.1 Bcf/d of export capacity in 2024 and have more trains under construction, cementing new offtake demand for upstream gas.[3]Energy Transfer, “Permian Gulf Coast Projects,” energytransfer.com TotalEnergies’ USD 18.8 billion Rio Grande LNG project alone will require roughly 2.6 Bcf/d of feed gas once fully operational. Pipeline expansions by Energy Transfer and others have improved netbacks for Appalachian and Permian gas, narrowing basis differentials that were previously as wide as USD 1.50/MMBtu. Long-term sales and purchase agreements with Asian and European utilities mitigate price risk, allowing drillers to secure returns before spudding wells. The US oil and gas upstream market thus finds a durable outlet for supply growth in global LNG demand.
Inflation Reduction Act CCS Incentives Accelerating EOR Projects
The Inflation Reduction Act raised the 45Q credit to USD 85 per ton of CO₂ permanently sequestered, pushing many EOR schemes into profitability even at USD 55/bbl oil. Occidental’s flagship direct-air-capture plant in West Texas illustrates how captured CO₂ can both garner tax credits and raise incremental recovery by 10–15%. The 12-year payout window aligns with typical EOR life cycles, allowing operators to amortize capture equipment while extending field life. Partnerships with industrial emitters assure a steady CO₂ supply stream, turning environmental compliance into a revenue-generating asset.
Restraints Impact Analysis*
| Restraint | (~) % Impact on CAGR Forecast | Geographic Relevance | Impact Timeline |
|---|---|---|---|
| Crude-price volatility & capital-discipline pressures | -0.80% | Nationwide | Short term (≤ 2 years) |
| Federal leasing restrictions on public lands | -0.50% | Western states, Alaska | Long term (≥ 4 years) |
| ESG-driven divestment & financing constraints | -0.60% | Institutional funding markets | Medium term (2-4 years) |
| Skilled-labor shortages in advanced drilling ops | -0.40% | Remote basins | Medium term (2-4 years) |
| Source: Mordor Intelligence | |||
Crude-Price Volatility & Capital-Discipline Pressures
Oil prices fluctuated between USD 70 and USD 85/bbl in 2024, prompting producers to maintain breakevens near USD 45/bbl and to reduce their rig fleets when WTI dipped below USD 65/bbl.[4]U.S. Energy Information Administration, “Drilling Productivity Report 2024,” eia.gov Integrated majors capitalize on downturns by locking in discounted service rates, whereas independents often defer projects, resulting in a 15–20% reduction in activity. Variable cost structures—such as contracted rigs, spot frac spreads, and pay-as-you-go water services—help protect cash flow. Larger balance sheets and greater hedging depth confer a competitive advantage, enabling market share gains while weaker peers retreat. Continuous volatility thus reinforces consolidation and capital discipline, curbing near-term volume growth.
ESG-Driven Divestment & Financing Constraints
Institutional investors reduced their hydrocarbon exposure by 15-20% after 2024, and European banks curtailed new upstream lending, which led to a 50–100 basis point increase in borrowing costs for certain independent companies. Firms unable to secure sustainability-linked credit lines face higher hurdle rates and may curtail drilling plans. To regain access, operators highlight methane-abatement programs, adopt ESG scorecards, and fold in renewable-power offsets. The added reporting burden favors larger entities with diversified revenue streams, thereby accelerating M&A as smaller firms seek to scale up to clear capital-market screens.
*Our forecasts treat driver/restraint impacts as directional, not additive. The impact forecasts reflect baseline growth, mix effects, and variable interactions.
Segment Analysis
By Location of Deployment: Offshore Growth Outpaces Onshore Dominance
Onshore operations accounted for 74.18% of the US oil and gas upstream market in 2025, reflecting established infrastructure, rapid cycle times, and favorable cost profiles. Yet, the offshore segment is forecast to log a stronger 5.66% CAGR through 2031, as de-risked deepwater fields in the Gulf of Mexico move into development. Offshore projects involve higher upfront capital but generate flatter decline curves and longer plateau production, traits that attract patient capital. Chevron’s Anchor and BP’s Tiber are emblematic, each designed for 75,000 bbl/d peak output with managed-pressure drilling that trims subsalt risk.
Offshore growth bolsters supply diversity and tempers overall decline rates in the US oil and gas upstream market. Service providers are rolling out high-pressure riser systems, real-time formation evaluation, and automated well-completion strings that compress development schedules by 10-12%. As Gulf of Mexico lease sales raised USD 382 million in 2024, operators secured acreage at favorable terms amid muted competition. These commitments underpin a production up-cycle likely to endure beyond the current decade.
By Resource Type: Natural Gas Leads Both Scale and Growth
Natural gas held 54.12% of 2025 output and is projected to grow at a 5.17% CAGR, the fastest among resources in the US oil and gas upstream market. Abundant Appalachian dry gas and associated gas from Permian oil wells feed expanding LNG and domestic power demand, presenting multiple monetization avenues. Pipeline debottlenecks and processing plant additions in West Texas and Louisiana reduce flaring and capture more rich-gas liquids, improving well economics.
Crude oil volumes, while still substantial, face growth headwinds from OPEC+ coordination and refinery capacity constraints. Nonetheless, associated gas elevates the composite return of oil-weighted wells. The US oil and gas upstream industry is increasingly selling “energy packages” consisting of oil, condensate, gas, and NGLs, thereby optimizing revenue streams against market fluctuations.


By Well Type: Unconventional Dominance Reinforces Technology Leadership
Unconventional wells captured 64.62% of the US oil and gas upstream market size in 2025 and are expected to grow at a 4.98% CAGR through 2031, driven by continuous improvements in lateral length, proppant loading, and real-time geosteering. Engineered completions deliver 20-30% higher estimated ultimate recovery, justifying tighter stage spacing and more intense fracture treatments. Data-rich pad drilling also reduces lease operating expense by sharing infrastructure across multi-well pads.
Conventional wells retain a niche in aging fields where secondary and tertiary recovery extend plateau output. However, the steep learning curve and network effects in shale favor incumbents that amassed core acreage early. Regulatory spacing rules, water-management constraints, and surface-use agreements are increasingly shaping drilling geometry, compelling operators to invest in sophisticated reservoir models and public engagement programs.
By Service: Decommissioning Emerges as Fastest-Growing Segment
Development and production activities accounted for 69.25% of 2025 spending, reflecting the constant need to drill, complete, and optimize wells. However, decommissioning services are expected to grow at a rate of 6.74% annually as 2,700 Gulf of Mexico platforms approach their end-of-life status. Stricter federal standards now require full jacket removal and seabed clearance, raising the technical bar.
Specialist contractors utilize heavy-lift vessels, modular cutting tools, and remotely operated vehicles to mitigate project risk and reduce costs. Technology spillovers from offshore wind installation and subsea robotics improve safety and environmental compliance. As decommissioning liabilities crystallize on balance sheets, operators are increasingly reserving capital for plug-and-abandon activities, opening a multi-billion-dollar service niche within the broader US oil and gas upstream market.
Geography Analysis
Texas remained the nerve center of the US oil and gas upstream market in 2025, contributing approximately 40% of the nation's oil output and 25% of its gas volumes through the Permian and Eagle Ford plays. Infrastructure density, mineral-owner familiarity, and year-round drilling weather encourage sustained investment, even during price dips. North Dakota's Bakken supplied 12% of US crude despite winter weather, thanks to heated gathering lines and high-efficiency drilling rigs purpose-built for the Williston Basin.
Federal Gulf of Mexico waters are the fastest-growing geography, expected to post 6-8% production gains as deepwater hubs, such as Mad Dog 2 and Whale, come online. Long-life assets stabilize national decline curves and provide baseload volumes for Gulf Coast refiners. High-spec drillships, riserless mud recovery, and subsea boosting extend the reach into ultra-deep zones that were formerly deemed marginal.
Appalachia dominates dry-gas supply, with Pennsylvania and West Virginia delivering more than 35 Bcf/d as of late 2024. The regional focus now shifts from pure volume growth to emissions management and well-site electrification, aligning with ESG mandates. Smaller but important contributions arise from Colorado's J Basin, Wyoming's Powder River, and Alaska's North Slope, each subject to distinct regulatory and logistical hurdles that temper growth but preserve supply diversity within the US oil and gas upstream market.
Competitive Landscape
The top five operators—ExxonMobil, Chevron, ConocoPhillips, EOG Resources, and Occidental—collectively control approximately 60% of the US oil and gas upstream market value, resulting in a moderately concentrated competitive field. Scale enables these companies to negotiate lower service rates, secure premium acreage, and fund multi-year capital programs, all while dedicating 3–5% of their capital expenditures to digital transformation.
Consolidation accelerated in 2024, with Chevron’s USD 6.3 billion acquisition of PDC Energy and Diamondback’s USD 26 billion merger with Endeavor expanding horizontal shale footprints. Larger portfolios cushion against basin-specific risks and facilitate balanced oil-gas mixes aligned with price and demand trends. Mid-cap independents respond by doubling down on their core competencies—such as high-resolution subsurface imaging, rapid-cycle pad development, or CO₂-EOR expertise—to carve out defensible niches.
Technology alliances are proliferating as service firms embed AI modules into drilling, completion, and production workflows. SLB, Halliburton, and Baker Hughes provide turnkey platforms that smaller operators access via subscription, flattening technology adoption disparities. Competitive intensity shifts from acreage capture to operational execution, rewarding continuous learning and efficiency gains across the US oil and gas upstream market.
United States Oil And Gas Upstream Industry Leaders
Exxon Mobil Corporation
Chevron Corporation
Occidental Petroleum Corporation
Pioneer Natural Resources
- *Disclaimer: Major Players sorted in no particular order

Recent Industry Developments
- September 2025: BP announced a final investment decision for the USD 5 billion Tiber deepwater project in the Gulf of Mexico, targeting first oil in 2029 at a peak of 75,000 bbl/d.
- December 2024: Halliburton’s LOGIX system logged 30% faster drilling times in the Permian.
- November 2024: ConocoPhillips added two Permian rigs, citing sub-12-month payouts.
- September 2024: Diamondback completed the merger with Endeavor in a USD 26 billion all-stock deal, creating the Permian’s top producer.


United States Oil And Gas Upstream Market Report Scope
The oil and gas industry explains the stages of operations that entail exploration and production upstream. The oil and gas industry's exploration and early production stages are the main focus of upstream businesses.
The United States oil and gas market is segmented by location. By location, the market is segmented into onshore and offshore. Each segment's market sizing and forecasts are based on crude oil production (million barrels per day).
By Location of Deployment
| Onshore |
| Offshore |
By Resource Type
| Crude Oil |
| Natural Gas |
By Well Type
| Conventional |
| Unconventional |
By Service
| Exploration |
| Development and Production |
| Decomissioning |
| By Location of Deployment | Onshore |
| Offshore | |
| By Resource Type | Crude Oil |
| Natural Gas | |
| By Well Type | Conventional |
| Unconventional | |
| By Service | Exploration |
| Development and Production | |
| Decomissioning |


Key Questions Answered in the Report
How large will upstream spending in the US be by 2031?
The United States Oil And Gas Upstream Market size is projected to reach USD 138.08 billion by 2031, up from USD 108.97 billion in 2026.
Which segment is expanding the fastest?
Offshore projects in the Gulf of Mexico are set to grow at a 5.66% CAGR as deepwater hubs move into development.
What resource leads in growth terms?
Natural gas output is expected to rise at a 5.17% CAGR, supported by LNG-export capacity additions and power-generation demand.
Why is decommissioning a growth niche?
More than 2,700 offshore structures will require plug-and-abandon work this decade, driving a 6.74% CAGR in decommissioning services.
How are digital technologies influencing costs?
Real-time drilling analytics and autonomous systems already cut well costs by up to 15% and reduce drilling time by 20%.
What role do 45Q tax credits play?
Enhanced credits of USD 85 per ton encourage CO₂-EOR projects, adding a new revenue stream while boosting ultimate recovery 10-15%.
Page last updated on:


