
Office Partition Walls Market Size and Share
Market Overview
| Study Period | 2020 - 2031 |
|---|---|
| Market Size (2026) | USD 9.27 Billion |
| Market Size (2031) | USD 12.53 Billion |
| Growth Rate (2026 - 2031) | 6.23% CAGR |
| Fastest Growing Market | Asia-Pacific |
| Largest Market | North America |
| Market Concentration | Medium |
Major Players *Disclaimer: Major Players sorted in no particular order Image © Mordor Intelligence. Reuse requires attribution under CC BY 4.0. | |
Office Partition Walls Market Analysis by Mordor Intelligence
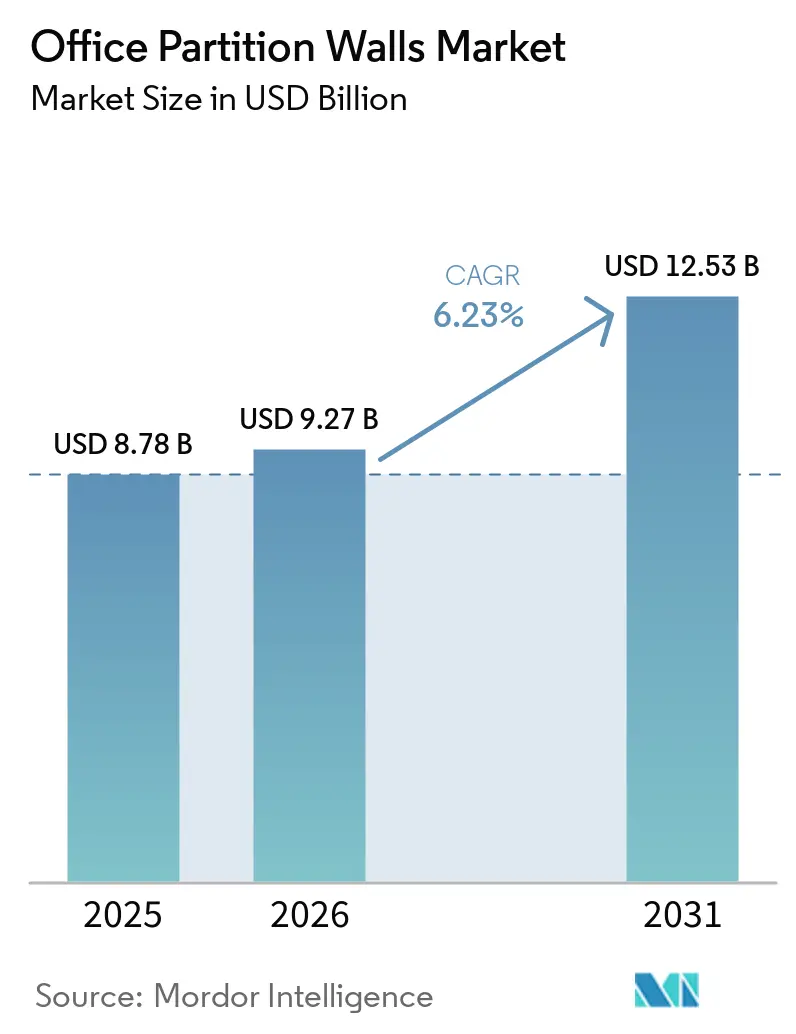
The office partition walls market size is projected to expand from USD 8.78 billion in 2025 and grow to USD 9.27 billion in 2026, and is projected to reach USD 12.53 billion by 2031, registering a CAGR of 6.23% between 2026 and 2031. Growth continues to reflect a broader shift in workplace planning, as companies now prefer interiors that can be adjusted within lease cycles rather than treated as fixed building fabric. Hybrid work has settled into a more durable operating model, raising demand for layouts that support enclosed focus areas, open collaboration zones, and meeting rooms within the same office footprint. Rising fit-out costs and stronger demand for integrated technology are also lifting the value mix toward higher-specification systems rather than basic interior solutions[1] JLL, “Global Office Fit-Out Costs Guide 2026,” JLL, jll.com. Competition remains moderate, but pricing pressure is increasing as global workspace brands and regional manufacturers compete for the same specification-led projects. Even amid raw material inflation and labor shortages that are putting pressure on margins, the office partition walls market continues to benefit from demand for reusable systems, acoustic performance, and smart workplace integration.
Key Report Takeaways
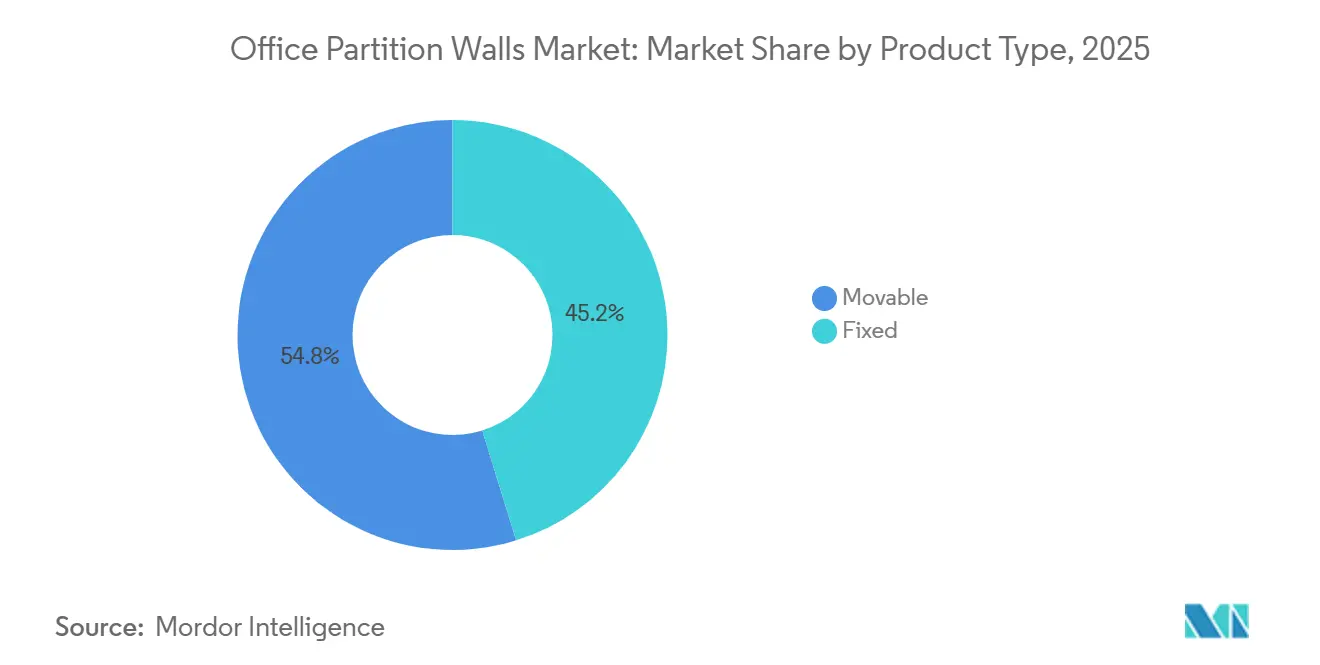
- By product type, fixed partitions held 45.25% of the office partition walls market share in 2025, while movable partitions are forecast to grow at a 7.82% CAGR through 2031.
- By material type, glass held 37.45% of the office partition walls market share in 2025, while hybrid and composite materials are projected to expand at a 7.32% CAGR through 2031.
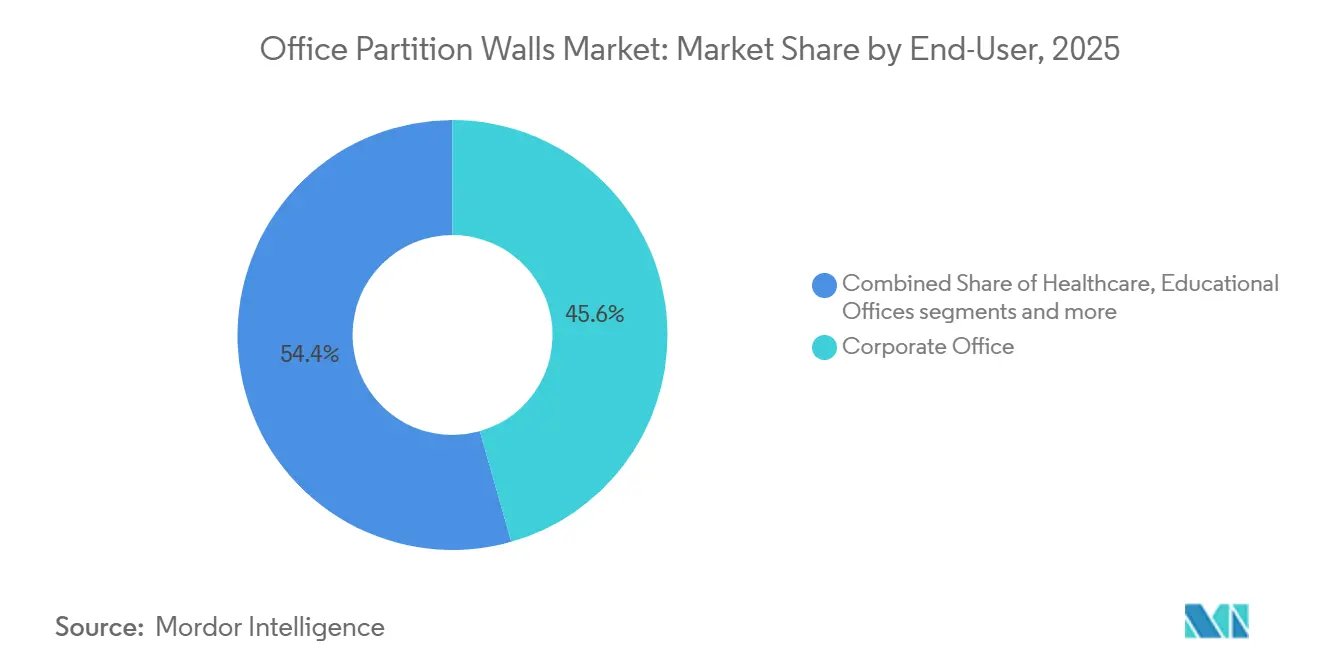
- By end user, corporate offices accounted for 45.68% of market value in 2025, while hospitality and retail back-offices are expected to grow at a 7.56% CAGR through 2031.
- By distribution channel, direct sales held a 68.81% of the office partition walls market share in 2025 and recorded the highest projected CAGR of 7.11% through 2031.
- By geography, North America held a 34.01% share in 2025, while Asia-Pacific is expected to record the fastest growth at a 7.68% CAGR through 2031.
Note: Market size and forecast figures in this report are generated using Mordor Intelligence’s proprietary estimation framework, updated with the latest available data and insights as of January 2026.
Global Office Partition Walls Market Trends and Insights
Drivers Impact Analysis*
| Driver | (~) % Impact on CAGR Forecast | Geographic Relevance | Impact Timeline |
|---|---|---|---|
| Hybrid Work and Space Reconfiguration Demand | 2.00% | Global, concentrated in North America, Western Europe, and core Asia-Pacific markets | Medium term (2-4 years) |
| Acoustic Privacy Requirements in Open Plan Offices | 1.20% | Global, with highest density in North America and Western Europe | Long term (≥ 4 years) |
| Sustainability and Circular Interior Fit-Out Adoption | 0.60% | Europe, Middle East and Africa, and Asia-Pacific, with spillover to North America | Long term (≥ 4 years) |
| Smart Office Integration and Occupancy Optimization | 0.80% | North America and Asia-Pacific, with early gains in Singapore, Tokyo, London, and Sydney | Medium term (2-4 years) |
| Retrofit Led Demand From Lease Renewal Cycles | 0.70% | North America, Western Europe, Japan, and Australia | Short term (≤ 2 years) |
| Growth in Corporate Interior Refurbishment Budgets | 0.50% | Global, with spillover to Middle East and Africa through Saudi Arabia and the United Arab Emirates | Medium term (2-4 years) |
| Source: Mordor Intelligence | |||
Hybrid Work and Space Reconfiguration Demand
Hybrid work is no longer a temporary office policy, and the office partition walls market is responding to a clear need for interiors that can be changed more often. Space planning cycles are becoming shorter, meaning companies are treating walls as movable assets rather than as one-time construction decisions. Steelcase reported in 2026 that 63% of employees lacked access to varied spaces that build community at work, while organizations that provide such spaces recorded 14% higher engagement and 8% higher productivity[2]Steelcase, “Steelcase Showcases Workplace Design Strategies That Support Wellbeing and Performance at Chicago Design Week 2026,” Steelcase Press Releases, steelcase.com. That demand pattern is important because hybrid offices need focus rooms, collaboration areas, and video-ready spaces within the same floorplate. Modular systems are gaining popularity because they accommodate layout complexity without the disruption of permanent drywall. The office partition walls market, therefore, benefits not only from new project demand, but also from repeat reconfiguration demand inside already occupied offices.
Acoustic Privacy Requirements in Open Plan Offices
Acoustic privacy is becoming a harder specification requirement in the office partition walls market, especially in offices that still rely on open-plan layouts. Buyers are placing greater emphasis on measured performance data, such as Sound Transmission Class and Noise Reduction Coefficient values, rather than relying solely on visual design. Morgan Lovell reported that 33% of workers could not find a quiet place to focus in their current office, and that a typical disturbance recurred every 11 minutes, with 23 minutes needed for recovery[3]Morgan Lovell, “Office Acoustics and the Future of Office Design,” Morgan Lovell, morganlovell.co.uk. That cost is pushing clients to avoid low-specification systems that may need replacement soon after installation. Manufacturers that provide certified acoustic data are in a stronger position during specification reviews because the performance case is easier to defend. The office partition walls market also benefits from this shift because acoustic performance now carries more weight in workplace investment decisions than it did in earlier fit-out cycles.
Smart Office Integration and Occupancy Optimization
The office partition walls market is also moving toward systems that do more than simply separate spaces, widening the role of walls in building operations. Partition systems are increasingly integrating with occupancy sensing, lighting controls, and localized climate management, turning the wall into part of the building management layer. In February 2026, PointGrab and Alif Semiconductor introduced CogniPoint 2 Flex, a battery-powered edge artificial intelligence-based occupancy-sensing solution designed to deliver real-time workplace data without the cabling burden often associated with glass-partitioned rooms. DIRTT reported that its 12-month forward pipeline rose 16% year on year to nearly USD 338 million at the start of the second quarter of 2026, suggesting sustained demand for technology-enabled interior construction solutions. Once clients adopt sensor-ready or software-linked systems, switching costs rise because the partition solution becomes tied to a broader workplace technology stack. This gives the office partition walls market a higher-value layer of competition that depends on system compatibility as much as physical product quality.
Retrofit Led Demand From Lease Renewal Cycles
Retrofit demand is becoming a significant driver of the office partition walls market, as renewal decisions often trigger interior redesign. Lease events push both tenants and landlords to improve workplace quality, whether the aim is staff retention, space efficiency, or better use of premium floor area. JLL noted in 2026 that 62% of premium office stock in Asia-Pacific was more than 10 years old, and that 81% of commercial real estate leaders in Singapore had shifted firmly toward asset renewal. That aging stock base creates a near-term pipeline for systems that can be installed with less disruption and reused in later layout changes. The office partition walls market is well placed in this environment because retrofit buyers place a premium on installation speed and future redeployment value. This driver is particularly relevant in mature office markets where existing buildings still carry good locations but need modernized interiors to stay competitive.
Restraints Impact Analysis*
| Restraint | (~) % Impact on CAGR Forecast | Geographic Relevance | Impact Timeline |
|---|---|---|---|
| High Upfront Cost Versus Conventional Drywall Systems | -1.50% | Global, most acute in cost-sensitive markets across South Asia, Southeast Asia, and Latin America | Medium term (2-4 years) |
| Installation Complexity and Skilled Labor Dependence | -0.80% | North America and Europe, Middle East and Africa, with stronger pressure in markets with unionized labor bases such as the Northeastern United States and Germany | Short term (≤ 2 years) |
| Fire, Acoustic, and Building Code Compliance Fragmentation | -0.50% | Global, with highest complexity in multi-jurisdiction markets across the European Union, Asia-Pacific, and Middle East and Africa | Long term (≥ 4 years) |
| Raw Material Price Volatility in Glass, Aluminum, and Steel | -1.00% | Global, with highest exposure in North America and Europe, Middle East and Africa because of tariff and trade effects | Short term (≤ 2 years) |
| Source: Mordor Intelligence | |||
High Upfront Cost Versus Conventional Drywall Systems
Higher initial cost remains one of the clearest restraints in the office partition walls market, especially in projects where budgets are tightened late in procurement. Premium modular glass or acoustic systems still cost more than conventional gypsum board drywall, making first-cost comparisons difficult in price-sensitive markets. JLL reported in 2026 that Builders' Works, which includes partitions, flooring, and joinery, accounted for 35% to 38% of total fit-out costs globally, while mechanical and electrical services accounted for another 25% to 31%. That cost structure leaves less room for premium partition selection unless suppliers can show a strong reuse or life-cycle case. PLP Architecture showed in 2025 that a circular fit-out in London reused 92% of materials, reduced costs by 68% compared with a conventional fit-out, and saved 175.78 tonnes of carbon dioxide, which gives the redevelopment value argument more credibility. The office partition walls market, therefore, faces a recurring challenge: long-term savings are real, but they do not always overcome short-term budget pressures at the time of specification.
Raw Material Price Volatility in Glass, Aluminum, and Steel
Raw material volatility continues to pressure the office partition walls market, as aluminum, steel, and glass remain embedded in frame systems, tracks, and connection hardware. The Associated General Contractors of America reported that aluminum prices increased 30.5% and steel prices increased 17% in 2025, which marked the steepest increases since 2022. Those changes are hard to offset quickly because many partition assemblies depend on material combinations that cannot be redesigned mid-project. DIRTT stated that rising aluminum costs contributed to gross margin pressure in the first quarter of 2026, and the company introduced a 1% tariff surcharge on orders placed after March 18, 2026. Companies with local production, stronger recycling loops, or better procurement discipline are better placed to limit the impact on pricing. The office partition walls market remains exposed as metal prices and trade measures rise, even as project budgets are already under strain.
*Our forecasts treat driver/restraint impacts as directional, not additive. The impact forecasts reflect baseline growth, mix effects, and variable interactions.
Segment Analysis
By Product Type: Fixed Volumes Support Baselines, Movable Systems Accelerate
Fixed partition systems held 45.25% of the office partition walls market share in 2025, indicating that permanent layouts still account for a large share of demand. This segment remains important in corporate headquarters, healthcare office buildings, and institutional projects where building codes or occupancy needs require stable room definition. Fixed systems also tend to carry higher average selling prices and longer design-to-delivery cycles, which more closely tie performance to capital approval timing. The January 2026 launch of Dividends Skyline by Knoll showed how established suppliers are refining fixed-looking systems to deliver stronger privacy, focus, and collaboration performance inside open-plan environments. That product direction matters because clients still want the visual stability of permanent architecture, even as they ask for more flexibility underneath. In the office partition walls industry, fixed systems therefore continue to provide the base volume that supports large project pipelines.
Movable partitions are forecast to grow at a 7.82% CAGR from 2026 to 2031, making them the fastest-growing segment of the office partition walls market. Demand is rising because many occupiers now manage office capacity as a flexible operating resource rather than a static space plan. Faster installation, reduced disruption, and better redeployment value are making movable systems more attractive in both retrofit and greenfield fit-outs. Steelcase's Everwall hybrid unitized wall system reflects that direction by combining shorter install times with design freedom and stronger acoustic performance expectations. Hospitality operators and co-working providers also add momentum because they need spaces that can shift between different use cases without calling in specialist trades each time. That repeat-use pattern gives movable systems a recurring procurement advantage that fixed products cannot match as easily. The office partition walls market is therefore seeing growth not only from more offices, but also from more frequent changes within existing offices.


By Material Type: Glass Anchors Specification, Composites Close the Performance Gap
Glass partitions held a 37.45% share in 2025, maintaining their position as the leading material for office partition walls. Corporate design teams continue to favor glass because it supports openness, daylight flow, and premium visual standards in modern workplaces. The material is especially visible in law firms, financial services offices, and pharmaceutical workplaces where enclosed rooms are needed without creating dark interiors. High-performance acoustic glass options are also becoming more common, with speech privacy treated as a compliance requirement rather than a design preference. Metal systems remain relevant in industrial and government applications; wood serves premium adaptive-use projects, and gypsum board still competes strongly where conventional construction costs remain lower. In the office partition walls industry, this leaves glass as the benchmark material against which other options are increasingly assessed.
Hybrid and composite materials are forecast to grow at a 7.32% CAGR through 2031, making them the fastest-rising material group in the office partition walls market. Their appeal lies in combining acoustic cores, metal framing, and low-emission finishes into a single integrated system. That combination helps solve a practical problem because clients increasingly want noise control, visual openness, and sustainability credentials in the same product package. Haworth announced a closed-loop manufacturing process in March 2025 with PADNOS and Royal Technologies, which signaled stronger movement toward circular content and material recovery across workspace products. Public procurement rules and broader sustainability frameworks are pushing manufacturers to provide stronger life-cycle and recycled-content documentation, which favors composite systems that are engineered around measurable performance. The office partition walls market size for hybrid and composite materials is therefore gaining support from more than just a design trend. It is also being supported by a procurement shift that asks suppliers to meet acoustic, environmental, and aesthetic tests at the same time. This helps explain why pure glass and pure fabric solutions are no longer enough for every project brief. Clients are increasingly willing to consider mixed-material systems when they reduce trade-offs across privacy, carbon, and visual quality.
By End-User: Corporate Offices Define the Base, Hospitality Creates the Growth Signal
In 2025, corporate offices dominated the market, accounting for 45.68% of the total value, or nearly USD 4.01 billion. Corporate real estate teams, the primary decision-makers in this segment, are now scrutinizing products more closely. Key considerations like acoustic performance, reconfiguration potential, and carbon content are gaining prominence, especially in major headquarters and regional office projects. While healthcare and educational offices contribute significantly, their procurement processes are typically slower and more regulated. Government and public office projects also play a crucial role, but stringent compliance requirements, especially concerning fire resistance and accessibility, render these projects more procedural. Thus, the corporate office sector remains the primary driver of demand in the office partition walls market.
Hospitality and retail back offices are forecast to grow at a 7.56% CAGR through 2031, making them the fastest-growing end-user category in the office partition walls market. This growth is noteworthy, especially since many suppliers still regard this segment as secondary. Yet, expectations for fit-out quality are on the rise, particularly among hotels and premium retail chains. For instance, hotel operators are now integrating acoustic glass systems in support spaces, allowing property teams to function in hybrid modes while maintaining operational separation. Similarly, premium retailers are transforming stockrooms and service areas into micro-offices, facilitating staff coordination and customer support. Highlighting the trend, JLL's 2026 fit-out guide for Europe, the Middle East, and Africa pointed out that medium-quality corporate office fit-outs averaged EUR 1,960 (USD 2,305.5) per square meter, indicating that the specification pressures in prime offices are influencing adjacent commercial sectors. In a notable 2025 refurbishment of Schneider Electric's Dubai office, managed by Summertown Interiors, 93% of materials, including glass partitions and aluminum frames, were diverted from landfills. This move underscored the sustainability argument for demountable systems in multi-site portfolios. Consequently, the office partition walls market in hospitality and retail back-office projects is buoyed by both refurbishment demands and heightened sustainability expectations. Furthermore, operators are increasingly favoring standardized systems that allow for consistency across locations with minimal design variations. Thus, a segment once perceived as niche is now emerging as a significant growth area in the office partition walls market.

By Distribution Channel: Direct Sales Consolidate Specification Authority
In 2025, direct sales commanded a dominant 68.81% share of the market and are projected to expand at a robust 7.11% CAGR. This trend underscores the channel's dual leadership in both scale and growth within the office partition walls market. This dominance signals a shift in the procurement model: manufacturers are now often engaged even before tender documents are finalized. Corporate real estate teams, designers, and integrated fit-out firms are proactively collaborating with suppliers during the design phase, rather than deferring to general contractors for product choices. Such early engagement not only fortifies manufacturers' margins, since early specifications are harder to alter later in the procurement process, but also benefits suppliers adept at aligning design intentions with technical insights, digital planning, and installation oversight. Today, in the office partition walls arena, direct sales have evolved from merely closing orders to becoming pivotal control points for high-value projects.
While distributors and dealers maintain their relevance, particularly in smaller projects, multi-site deployments, and regions with limited manufacturer presence, their influence is waning. They excel in projects under USD 500,000 and in locales where personal relationships overshadow the need for comprehensive system integration. However, as clients increasingly demand timely technical assistance and clearer accountability for performance, the pendulum of influence swings toward direct engagement. The introduced design-build support, estimating services, and self-performed installations enhance their partner network's capabilities. Such a hybrid model is crucial: it enables direct handling of large or intricate projects while leveraging external partners for broader geographic coverage. Regional players lacking direct capabilities risk relegation to low-margin dealer channels, especially as trends like Building Information Modeling integration and comprehensive design-to-installation services gain traction. The office partition walls market is thus gravitating towards suppliers who can influence specifications early and maintain involvement through to execution. While channel structure holds significance, the authority to dictate specifications has emerged as the prized asset, solidifying the continued prominence of direct sales in the coming years.
Geography Analysis
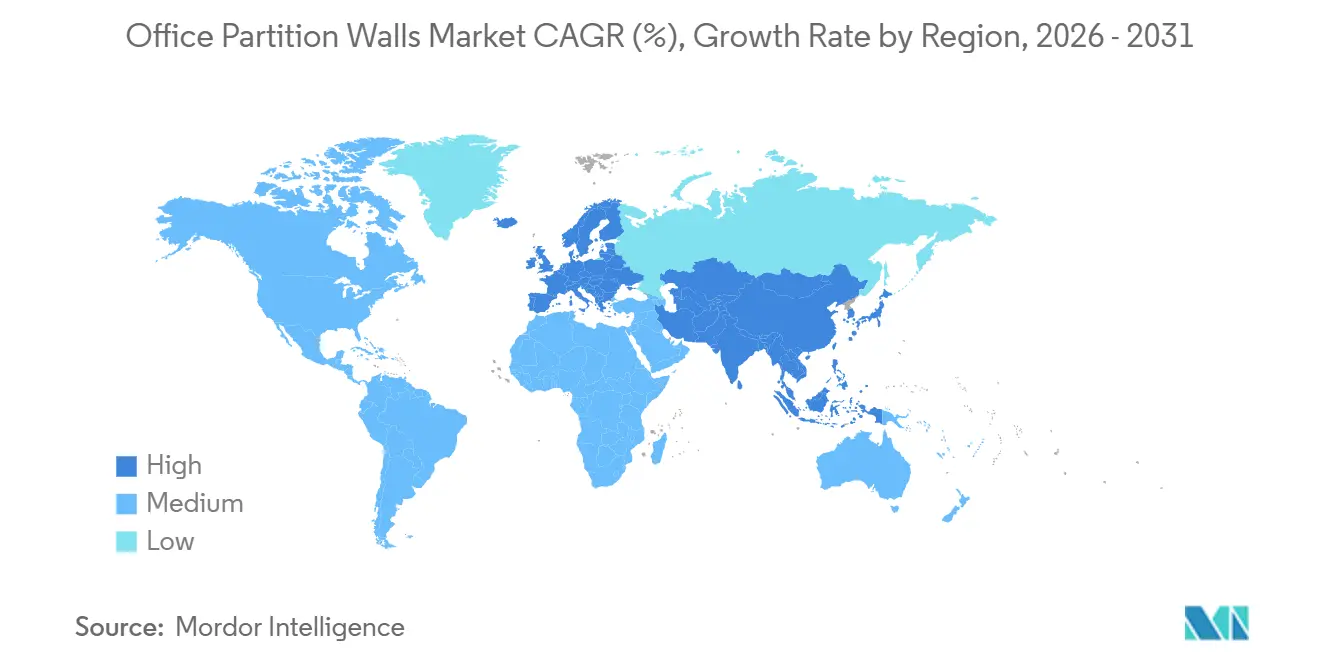
North America held a 34.01% share in 2025, making it the largest regional block in the office partition walls market and the strongest center for premium specification activity. In the United States, fit-out costs rose by nearly 5% year on year to USD 162 per square foot on average, while gateway markets averaged USD 196 per square foot, which improved the business case for higher-value partition systems in premium projects. Cushman & Wakefield also reported that 79% of general contractors expected labor and material costs to continue rising over the next six months, pointing to a persistent cost escalation environment. The Northeastern United States recorded the sharpest 7% year-on-year increase in fit-out costs, keeping New York and Boston among the most active premium submarkets for glass partition specification. Canada and Mexico add adjacent demand, while South America remained the most cost-competitive at USD 108 per square foot on average, with Brazil showing a 50% year-on-year rise in fit-out costs during 2025 as multinational occupiers increased investment in Class A space.
Europe remains a major installed base for the office partition walls market, and the region is supported by strong refurbishment demand as well as sustainability-led specification. JLL reported that medium-quality office fit-out costs across Europe, the Middle East and Africa averaged EUR 1,960 (USD 2,305.5) per square meter in 2026, slightly above the global average of EUR 1,840 (USD 2,164.4) per square meter, with annual cost growth of 5% to 7%. Germany remains one of the deepest European markets for demountable systems, and carbon-focused procurement rules are directing more attention toward recycled steel and aluminum-framed solutions. The United Kingdom, the Nordic countries, the Benelux countries, and Central and Eastern Europe also add meaningful volume as multinational occupiers continue to upgrade regional delivery centers and higher-grade office stock.
Asia-Pacific is projected to grow at 7.68% CAGR through 2031, which makes it the fastest-growing geography in the office partition walls market. Colliers reported that office leasing activity across Asia-Pacific reached 9.8 million square meters in 2025, up 11% year on year, with India, Mainland China, and Japan accounting for 90% of leasing growth. The same source reported that investment in Asia-Pacific office markets reached USD 58.6 billion in 2025, up 21% year on year, which reflected stronger investor confidence and more assets requiring immediate fit-out work. Cushman & Wakefield also noted that Grade A office stock in the region had nearly doubled over the past decade to 2.43 billion square feet, which shows the scale of the supply base now moving through fit-out and repositioning cycles. The Middle East and Africa add a smaller but rising opportunity, with JLL identifying Saudi Arabia and the United Arab Emirates as leading office fit-out investment markets and showing that Builders' Works accounted for 36% of total fit-out cost in the United Arab Emirates and 40% in Saudi Arabia.

Competitive Landscape
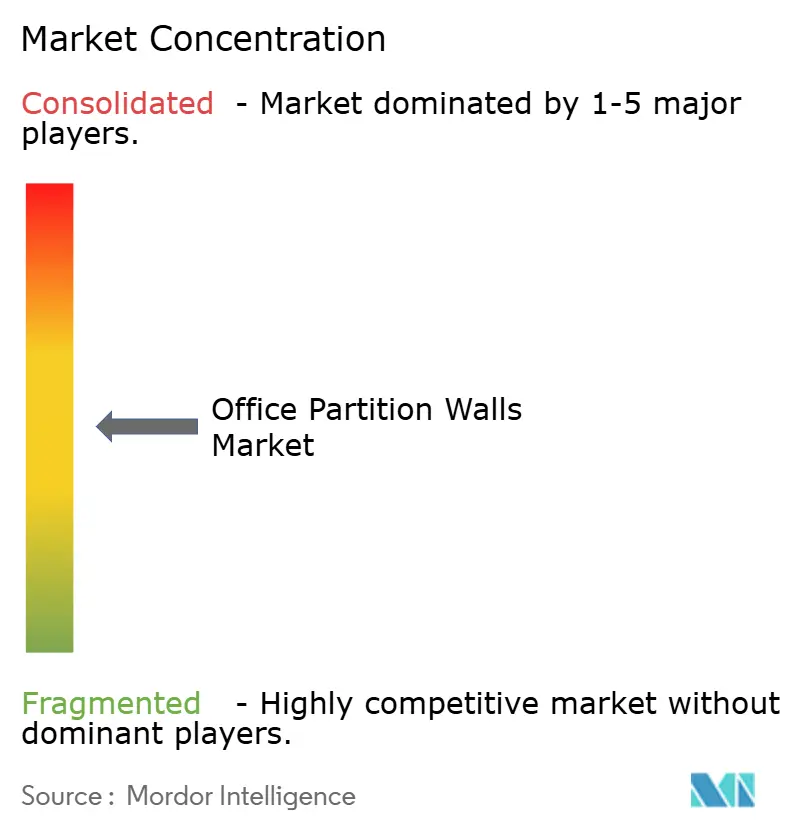
The office partition walls market is moderately fragmented globally, with leading workspace specialists competing alongside a broader group of regional wall-system manufacturers. Steelcase, Haworth, MillerKnoll, through Knoll, and DIRTT remain among the most visible international names. At the same time, Maars Living Walls, Hufcor, Lindner Group, Faram, and Teknion reinforce competition at the project and regional level. Competitive advantage is now built less on a single product feature and more on the ability to combine planning tools, acoustic certification, design support, and reconfiguration services. That shift matters because buyers increasingly want a single supplier to remain involved from concept development through installation and subsequent changes. The office partition walls market, therefore, rewards suppliers that can defend specification quality and service reliability at the same time as product performance.
Strategic moves in 2025 and 2026 indicate that scale players are broadening their portfolios and tightening control over the route to market in the office partition walls market. Haworth expanded its North American reach by acquiring a majority stake in Tayco and completing the acquisition of Heller Furniture. These steps followed record global sales of USD 2.7 billion in 2025, up 8%. DIRTT strengthened its market position by expanding DIRTT Construction Services, adding design-build support, targeted estimating, and self-performed installation to complement its partner network. Knoll also continued to sharpen its workplace systems portfolio with Dividends Skyline and Konzert, both aimed at private office and open-plan environments where privacy and flexibility need to work together. Smaller challengers such as NxtWall, IMT Modular Partitions, Komfort Partitioning, Movawall Systems, and Parthos are focusing on healthcare, education, and government niches where specialized needs can outweigh the advantage of global scale.
Technology and standards are shaping the next layer of competition in the office partition walls market. Smart systems that connect with occupancy analytics are pushing the category beyond passive room division and closer to workplace infrastructure. Suppliers that publish robust acoustic results and offer easier integration with digital design workflows are moving higher on specification shortlists. White-space opportunities remain strongest in sensor-enabled partitions, premium acoustic retrofit systems for occupied offices, and services that let clients reconfigure layouts without major disruption. That is why competition in the office partition walls market is rising even though the field remains fragmented, because value is shifting toward integrated system capability rather than simple panel supply.
Office Partition Walls Industry Leaders
Steelcase Inc.
Haworth Inc.
MillerKnoll Inc.
Hufcor, Inc.
Lindner Group KG
- *Disclaimer: Major Players sorted in no particular order

Recent Industry Developments
- June 2026: Steelcase showcased the Aisla open-plan panel system at Chicago Design Week 2026, featuring precision-crafted elements and integrated power designed to create a custom-built-in aesthetic in corporate interiors.
- June 2026: Haworth presented its Gallerie workstation platform alongside a newly engineered dual-circuit power system at NeoCon 2026, reducing copper and metal use by approximately 50% compared with traditional solutions while adding new connectivity capabilities for hybrid work environments.
- May 2026: Knoll (MillerKnoll) debuted the Konzert private office system designed by Paolo Dell'Elce at Clerkenwell Design Week 2026 in London.
- March 2026: Haworth acquired a majority stake in Tayco (Toronto-based office furniture manufacturer) and completed the acquisition of Heller Furniture (Westport, CT), expanding its North American manufacturing and product capabilities.


Global Office Partition Walls Market Report Scope
| Fixed |
| Movable |
| Glass |
| Metal |
| Wood |
| Gypsum Board |
| Hybrid and Composite Materials |
| Corporate Office |
| Healthcare Offices |
| Educational Offices |
| Government and Public Offices |
| Hospitality and Retail Back-Offices |
| Other End-Users |
| Direct Sales |
| Distributors and Dealers |
| North America | Canada |
| United States | |
| Mexico | |
| South America | Brazil |
| Peru | |
| Chile | |
| Argentina | |
| Rest of South America | |
| Europe | United Kingdom |
| Germany | |
| France | |
| Spain | |
| Italy | |
| BENELUX (Belgium, Netherlands, and Luxembourg) | |
| NORDICS (Denmark, Finland, Iceland, Norway, and Sweden) | |
| Rest of Europe | |
| Asia-Pacific | India |
| China | |
| Japan | |
| Australia | |
| South Korea | |
| South East Asia (Singapore, Malaysia, Thailand, Indonesia, Vietnam, and the Philippines) | |
| Rest of Asia-Pacific | |
| Middle East and Africa | United Arab Emirates |
| Saudi Arabia | |
| South Africa | |
| Nigeria | |
| Rest of the Middle East and Africa |
| By Product Type | Fixed | |
| Movable | ||
| By Material Type | Glass | |
| Metal | ||
| Wood | ||
| Gypsum Board | ||
| Hybrid and Composite Materials | ||
| By End-User | Corporate Office | |
| Healthcare Offices | ||
| Educational Offices | ||
| Government and Public Offices | ||
| Hospitality and Retail Back-Offices | ||
| Other End-Users | ||
| By Distribution Channel | Direct Sales | |
| Distributors and Dealers | ||
| By Geography | North America | Canada |
| United States | ||
| Mexico | ||
| South America | Brazil | |
| Peru | ||
| Chile | ||
| Argentina | ||
| Rest of South America | ||
| Europe | United Kingdom | |
| Germany | ||
| France | ||
| Spain | ||
| Italy | ||
| BENELUX (Belgium, Netherlands, and Luxembourg) | ||
| NORDICS (Denmark, Finland, Iceland, Norway, and Sweden) | ||
| Rest of Europe | ||
| Asia-Pacific | India | |
| China | ||
| Japan | ||
| Australia | ||
| South Korea | ||
| South East Asia (Singapore, Malaysia, Thailand, Indonesia, Vietnam, and the Philippines) | ||
| Rest of Asia-Pacific | ||
| Middle East and Africa | United Arab Emirates | |
| Saudi Arabia | ||
| South Africa | ||
| Nigeria | ||
| Rest of the Middle East and Africa | ||


Key Questions Answered in the Report
What is the current size and growth outlook for office partition walls?
The office partition walls market was valued at USD 8.78 billion in 2025, stands at USD 9.27 billion in 2026, and is forecast to reach USD 12.53 billion by 2031 at a 6.23% CAGR.
Which product category is leading demand?
Fixed partition systems led with 45.25% share in 2025, although movable systems are growing faster at a 7.82% CAGR through 2031.
Why are movable systems gaining traction in workplaces?
Buyers are prioritizing layouts that can be reconfigured more often, especially as hybrid work increases the need for focus rooms, collaboration zones, and faster retrofit cycles.
Which material is most widely specified today?
Glass remained the leading material with 37.45% share in 2025 because it supports openness, daylight penetration, and premium office design standards.
Which end-user group is driving the strongest expansion?
Corporate offices still form the base with 45.68% of 2025 value, while hospitality and retail back-offices are the fastest-growing category at a 7.56% CAGR.
Page last updated on:






