Market Overview
| Study Period | 2020 - 2031 |
|---|---|
| Forecast Data Period | 2026 - 2031 |
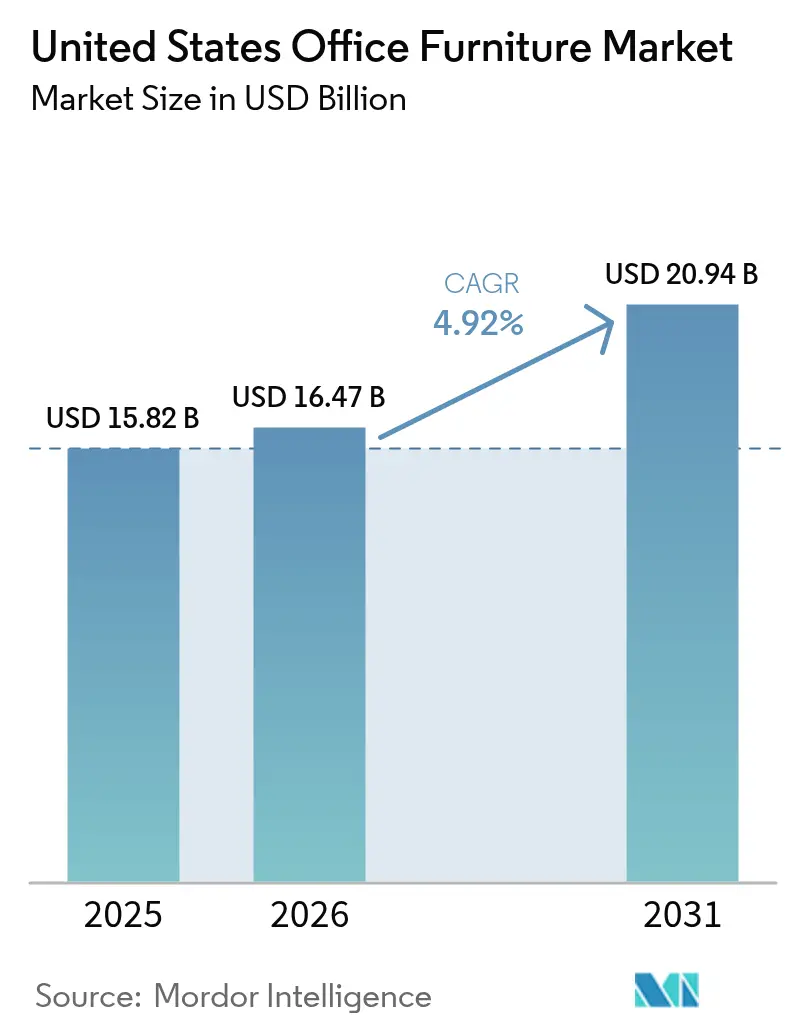
| Base Year Market Size (2025) | USD 15.82 Billion |
| Market Size (2026) | USD 16.47 Billion |
| Market Size (2031) | USD 20.94 Billion |
| Growth Rate (2026 - 2031) | 4.92% CAGR |
| Market Concentration | Medium |
Major Players *Disclaimer: Major Players sorted in no particular order Image © Mordor Intelligence. Reuse requires attribution under CC BY 4.0. | |
United States Office Furniture Market Analysis by Mordor Intelligence
The United States office furniture market size was USD 15.82 billion in 2025, is set to reach USD 16.47 billion in 2026, and is forecast to rise to USD 20.94 billion by 2031, reflecting a 4.92% CAGR during 2026-2031. Demand is recalibrating as employers reinforce hybrid attendance and return-to-office rules, which lifts retrofit spending and shifts procurement toward adaptive layouts and ergonomic upgrades that support variable headcounts. Office utilization improved to 53% in 2026, up from depressed 2023 levels, confirming that the United States office furniture market is now driven more by refresh cycles than by new construction starts. Section 179 expensing continues to motivate small- and mid-sized buyers to replace aging workstations without straining operating budgets, while tariff exposure on China-origin inputs and components sustains cost pressure that manufacturers manage through selective nearshoring and pass-through pricing. Regulatory scrutiny of chemicals and indoor air quality standards increases the strategic value of certified materials and documented emissions performance across core categories, which, in turn, guides specifications in public-sector and institutional tenders.
Key Report Takeaways
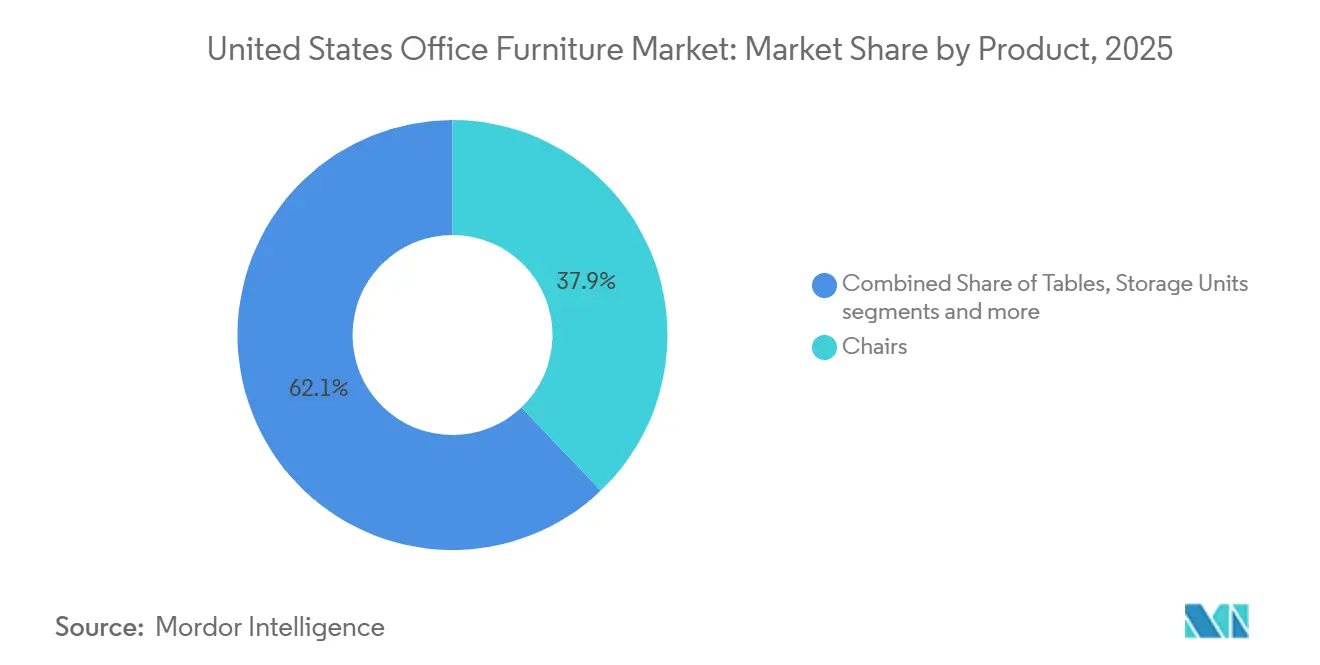
- By product, chairs led with 37.88% of the United States office furniture market share in 2025, while booths and office dividers are projected to expand at a 6.58% CAGR through 203.
- By material, wood held the top position with 41.26% of the United States office furniture market share in 2025, while plastic and polymer are forecast to grow at a 5.74% CAGR during 2026-2031.
- By price range, mid-range accounted for 46.83% of the United States office furniture market share in 2025, while premium is set to record the quickest expansion at a 6.21% CAGR through 2031.
- By end-user, corporate offices represented 48.92% of the United States office furniture market share in 2025, while healthcare offices are expected to post the highest growth at a 6.07% CAGR during 2026-2031.
- By distribution channel, B2B direct from manufacturers commanded 54.11% of the United States office furniture market share in 2025, while online within B2C retail is projected to advance at a 7.36% CAGR through 2031.
- By geography, the South captured 36.47% of the United States office furniture market share in 2025, while the West is forecast to expand at a 5.31% CAGR during 2026-2031.
Note: Market size and forecast figures in this report are generated using Mordor Intelligence’s proprietary estimation framework, updated with the latest available data and insights as of 2026.
United States Office Furniture Market Trends and Insights
Drivers Impact Analysis*
| Driver | (~) % Impact on CAGR Forecast | Geographic Relevance | Impact Timeline |
|---|---|---|---|
| Return-To-Office Refresh Cycles | +1.2% | National, with early gains in Manhattan, Miami, and Los Angeles | Medium term (2-4 years) |
| Hybrid Work Ergonomics Upgrade Demand | +1.5% | Global, strongest in corporate hubs (Northeast, West Coast) | Short term (≤ 2 years) |
| Digital Procurement and E-Commerce Penetration | +0.8% | National, accelerated in the South and West regions | Medium term (2-4 years) |
| Sustainability Certifications Shaping Buying (BIFMA LEVEL, GREENGUARD) | +0.6% | National, particularly California, the Northeast, and institutional buyers | Long term (≥ 4 years) |
| PFAS-Free and Low-VOC Materials Adoption Accelerates Product Refresh | +0.5% | State-specific with phased adoptions | Long term (≥ 4 years) |
| Tax-Advantaged Capex (Section 179) Supports SMB Furniture Purchases | +0.9% | National, with higher utilization in the Midwest and the South | Short term (≤ 2 years) |
| Source: Mordor Intelligence | |||
Return-to-Office Refresh Cycles Propel Replacement Demand
Office utilization reached 53% in 2026 as many large employers reinstated minimum on-site attendance to strengthen collaboration, which created a structural pivot toward continuous refresh cycles in the United States office furniture market. Procurement teams are updating open areas and focus zones with modular systems and ergonomic seating that can be reconfigured without disrupting daily operations, a shift that prioritizes agility over long fixed layouts as organizations fine-tune their hybrid models. Steelcase reported higher order activity in the Americas and a year-over-year backlog increase to USD 694 million in fiscal 2025, which signals that refresh spending has moved from deferral to planned programs that support talent engagement and workspace productivity[1]Steelcase Inc., “Form 10-K for the fiscal year ended February 28, 2025,” U.S. Securities and Exchange Commission, sec.gov . Competitive differentiation now hinges on product performance and service value rather than features alone, since most buyers require ergonomic baselines and look to installation speed, warranty terms, and post-sale service to decide among similar options in the United States office furniture market. Early adopters are piloting furniture with integrated sensors and device power to enhance comfort and utilization tracking, although adoption remains selective among cost-conscious mid-market buyers who prioritize proven designs and predictable lead times.
Hybrid Work Ergonomics Upgrade Demand Reshapes Product Mix
Hybrid remains the dominant pattern for remote-capable roles, and 52% of such employees worked in hybrid arrangements in 2025, which sustains twin demand for standardized office setups and high-quality home workstations in the United States office furniture market. Corporate buyers now favor plug-and-play stations with height-adjustable desks, lumbar-support chairs, and integrated power modules that maintain consistent ergonomic experiences across floors and sites, reflected in repeat orders for validated SKUs that meet durability benchmarks and certification thresholds. Home office purchases emphasize compact modular systems that deliver function in smaller footprints, which channels incremental volume into brands that can serve both B2B and direct-to-consumer fulfillment with fast shipping and simple assembly in the United States office furniture market. Extended warranties and part-replacement programs now influence selection criteria because buyers seek to extend lifecycle value and reduce unscheduled downtime for high-use seating and desks that support rotating teams. This ergonomic focus favors suppliers that can prove testing, safety, and emissions compliance during RFPs, especially where employee health and comfort are linked to retention goals and hybrid attendance targets in the United States office furniture market[2]BIFMA Secretariat, “Market Adoption — LEVEL by BIFMA,” BIFMA, bifma.org .
Digital Procurement and E-Commerce Penetration Accelerate B2B Transactions
Digital self-serve is reshaping how specification, pricing, and ordering flow through the dealer ecosystem, and more enterprise teams now expect real-time stock visibility, configuration previews, and rapid quote-to-order conversion in the United States office furniture market. Buyers are adopting augmented visualization and 3D configurators for custom finishes and fabrics, reducing change orders and speeding approvals for standardized programs and refresh rollouts across distributed portfolios. The shift benefits manufacturers that capture direct data on click paths, conversions, and product pairings, because those insights guide assortment rationalization and targeted promotions without raising headcount or extending lead times in the United States office furniture market[3]MillerKnoll Communications, “MillerKnoll Reports Q4 and Fiscal 2025 Results,” MillerKnoll Newsroom, news.millerknoll.com . SMB buyers are also broadening their vendor options as online channels dissolve geographic limits, which intensifies price competition among undifferentiated offerings and raises the premium on service wraps such as space planning and turnkey installation. As more mid-market orders move online, leading manufacturers refine hybrid go-to-market models that blend dealer-led projects with direct digital replenishment for standard SKUs across the United States office furniture market.
Sustainability Certifications Shape Buying as Baseline Requirements
LEVEL by BIFMA and GREENGUARD certifications have become baseline requirements across large institutional and public-sector programs, which makes documented materials safety and emissions performance a gating criterion rather than a post hoc differentiator in the United States office furniture market. Federalized composite wood rules under EPA TSCA Title VI align with longstanding CARB requirements for formaldehyde emissions, and many buyers now expect clear evidence of compliant substrates and finishes when they evaluate case goods and work surfaces. Several states have also advanced restrictions on targeted chemicals in upholstered goods, which encourage earlier reformulations of foams, textiles, and coatings to future-proof assortments and avoid mid-cycle disruptions in the United States office furniture market. For suppliers, certification investments are now integral to bids that score on ESG metrics, and they can support modest price premiums where procurement teams link environmental performance to long-term value and risk mitigation. As clients scale sustainability standards across broader portfolios, vendors that document recycled content, circular design, and verified indoor air performance can win a larger share of refresh cycles in the United States office furniture market.
Restraints Impact Analysis*
| Restraint | (~) % Impact on CAGR Forecast | Geographic Relevance | Impact Timeline |
|---|---|---|---|
| Elevated Office Vacancy and Footprint Densification | -1.8% | National, acute in selected large metros | Medium term (2-4 years) |
| Raw Material and Freight Cost Volatility | -0.7% | National, with tariff exposure concentrated on China-origin imports | Short term (≤ 2 years) |
| Compliance Costs from Chemical Restrictions (PFAS, Vocs) | -0.4% | State-specific, with phased implementation windows | Long term (≥ 4 years) |
| Import Tariff Persistence on China-Origin Inputs/Components | -0.9% | National, impacting wood and metal assemblies | Medium term (2-4 years) |
| Source: Mordor Intelligence | |||
Elevated Office Vacancy and Footprint Densification Compress Addressable Market
Vacancy rates remain elevated in many markets even as utilization improves, compressing the near-term runway for net new installations and signaling that refresh activity will dominate the United States office furniture market. Many firms are reducing square footage per employee and leaning into hoteling and touchdown concepts, so desks and storage units are refreshed for flexibility rather than expanded for headcount growth across multi-tenant buildings and campuses. This environment creates a two-speed cycle where class A properties invest to attract and retain tenants, while older buildings face longer approval cycles and deferrals that weigh on volume in the United States office furniture market. The installed base still exceeds current occupancy in many corridors, which moderates unit growth even as replacement demand lifts orders for task seating and reconfigurable partitions that support hybrid collaboration. Suppliers that focus on amenity-rich, experience-led spaces and on clients with stable capital plans are better positioned to offset the slow churn in underperforming buildings in the United States office furniture market.
Raw Material and Freight Cost Volatility Erodes Margin Predictability
Trade exposure and duty changes on key components continue to complicate pricing and quoting, and manufacturers report additive tariff costs that push up bill-of-materials costs in the United States office furniture market. MillerKnoll cited incremental tariff costs of USD 9-11 million in early fiscal 2026, which compressed quarterly earnings and underscored the challenge of hedging cost swings while maintaining service levels across national dealer networks. Supply chain shifts into North America reduce lead times and exposure for some items, but capital requirements and line transfer complexity slow the pace of diversification for large assortments in the United States office furniture market[4]HNI Corporation, “HNI Corporation Reports First Quarter 2025 Results,” HNI Investor Relations, hnicorp.com. Freight rate volatility adds another layer of uncertainty on landed costs and inventory planning, which drives higher safety stocks for fast-moving seating and desk SKUs and ties up working capital during peak cycles. Firms with nearshore capacity and simplified platforms gain structural advantages in cost and speed, but most of the United States office furniture market must still manage mixed-origin components, keeping price pass-through on the agenda for 2026.
*Our forecasts treat driver/restraint impacts as directional, not additive. The impact forecasts reflect baseline growth, mix effects, and variable interactions.
Segment Analysis
By Product: Chairs Dominate While Acoustic Solutions Surge
Chairs captured 37.88% of the United States office furniture market share in 2025, confirming their role as the most frequently replaced category and the ergonomic cornerstone of hybrid-ready workplaces. Task seating with adjustable lumbar support and breathable backs has become the baseline specification for enterprise buyers who want consistent comfort across rotating teams, helping keep replenishment cycles aligned with warranty life and health goals across large portfolios. Conference rooms and team areas are upgraded with meeting and guest chairs that balance mobility and durability, enabling space planners to increase throughput while preserving comfort standards in the United States office furniture market. The fastest-growing product grouping is booths and office dividers, which address acoustic privacy and on-demand video needs in open environments where hybrid collaboration increases noise sensitivity. The United States office furniture market for booths and office dividers is projected to expand at a 6.58% CAGR from 2026 to 2031, as buyers favor modular kits that install quickly without permits and support flexible reconfiguration as footprints evolve.
Tables and desks stabilize mid-portfolio demand as height-adjustable platforms penetrate deeper into corporate programs and into home workspaces that mirror in-office ergonomics in the United States office furniture market. Storage evolves as mobile pedestals and lockers replace legacy files in unassigned seating plans, which reinforces the shift toward lighter, more flexible fixtures that can be moved without disrupting IT or HVAC. Sofas and soft seating deliver hospitality cues in reception areas and team lounges, which support the push to make offices more attractive than home environments for high-impact collaboration moments in the United States office furniture industry. The remaining categories, including reception furniture and accessories, benefit from the emphasis on simple upgrades that elevate brand expression with faster lead times and lower risk during phased refresh plans. Across product types, certification and repairability are now table stakes rather than differentiators, as many buyers seek proof of emissions performance and part availability to extend service life in the United States office furniture market.


By Material: Wood Leads, Recycled Polymers Gain Momentum
Wood held 41.26% of the United States office furniture market share in 2025, supported by its durability, finish options, and alignment with premium executive and client-facing spaces where materials act as brand signals. Engineered composites serve cost-focused casegoods and storage, and many buyers now require evidence that substrates meet formaldehyde emission thresholds under federalized TSCA Title VI standards that reflect CARB’s long-standing framework. Metal continues to anchor seating frames, storage systems, and durable shelving, and its recyclability appeals to institutional purchasers that value lifecycle economics over initial price in the United States office furniture market. Buyers and suppliers are navigating duty exposure and input volatility by increasing regional sourcing and simplifying finish options to reduce complexity where possible across programmatic orders in the United States office furniture market. The combination of compliance requirements and cost focus steers many specifications toward verified panels and metals that support predictable schedules and post-install satisfaction in the United States office furniture market.
Plastics and polymers have the fastest trajectory, with a 5.74% CAGR during 2026-2031, as suppliers integrate higher recycled content and expand circular design programs that reduce carbon intensity without sacrificing performance. Haworth’s closed-loop manufacturing for the Fern chair family, which continuously recycles 14 plastic parts and reduces the product’s carbon footprint by 10%, demonstrates how operational innovation can scale circularity while preserving quality standards in the United States office furniture market. Lightweight polymer parts also reduce freight costs and installation labor, two areas of heightened focus as buyers push for faster turnarounds in phased refresh cycles spanning many floors and buildings. Other materials, including glass, acoustic textiles, and composite hybrids, are gaining share in collaboration zones as teams seek sound absorption without sacrificing openness in the United States office furniture market. State-level policies targeting select chemical classes are also shaping material roadmaps and timelines for reformulation across upholstered products and treated surfaces in the United States office furniture market.
By Price Range: Mid-Range Anchors, Premium Accelerates
Mid-range accounted for 46.83% of spending in 2025, and it remains the broadest strike zone for corporate and SMB buyers that want proven ergonomics, reliable warranties, and steady lead times without premium design pricing in the United States office furniture market. National manufacturers serving this tier lean on domestic assembly, vetted dealer networks, and tight SKU curation to deliver predictable outcomes on multi-site rollouts with minimal disruption to ongoing operations. Price transparency online enables cross-vendor benchmarking and compresses margins for look-alike offerings, pushing suppliers to compete through bundled services such as space planning, turnkey installation, and end-of-life asset programs in the United States office furniture market. Economy offerings continue to serve price-sensitive buyers and short-term use cases, often aligning with lease cycles and rapid headcount changes for growing teams. As facility teams standardize their core kits, they maintain flexibility to blend economy and mid-range items where utilization and wear patterns permit in the United States office furniture market.
Premium is the fastest-growing price band, with a 6.21% CAGR during 2026-2031, as firms position offices as talent magnets with hospitality-led finishes, refined textures, and integrated technology that create memorable client and employee experiences in the United States office furniture market. Showcases at major design events have highlighted layered materials, lounge-forward seating, and museum-grade veneers that elevate executive and client spaces while staying aligned to hybrid use and maintenance needs. Buyers in this tier seek provenance, brand heritage, and clear sustainability narratives, and they reward suppliers that publish content, certifications, and lifecycle data that validate premium positioning in the United States office furniture industry. Smart features such as integrated power and posture-sensing modules attract early adopters who want to fuse comfort and analytics, even if these features remain concentrated in flagship spaces rather than across entire floors. The blend of brand equity and performance differentiation gives premium assortments durability through cycles as teams continue to refine hybrid workplace models in the United States office furniture market.
By End-User: Corporate Dominates, Healthcare Surges
Corporate offices accounted for 48.92% in 2025, reflecting the scale of enterprise programs and the central role of standard kits and replenishment in sustaining large portfolios in the United States office furniture market. Large organizations favor suppliers that can execute multi-site projects with consistent QC, verified sustainability credentials, and robust post-install support across national dealer ecosystems. Mid-sized firms increasingly order through digital channels that offer transparent pricing and a curated set of finishes and sizes, which pairs well with fast shipping and simple assembly workflows across expanding teams in the United States office furniture market. Smaller businesses favor modular and expandable solutions that track headcount without waste, and they adopt stackable seating, extendable desking, and mobile storage to enable quick resets as work patterns change. Government, education, and public administration maintain compliance-heavy specifications that prioritize GREENGUARD and LEVEL certifications, domestic content, and durable materials suited for high throughputs in the United States office furniture market.
Healthcare offices are the fastest-growing end-user group, with a 6.07% CAGR during 2026-2031, as outpatient volumes expand and specialty clinics scale modern exam, imaging, and consult spaces that require durable, hygienic furniture solutions. Fit-outs emphasize infection-control features, seamless surfaces, and ADA-compliant access, encouraging premium specifications that deliver longer life and fewer service interruptions under heavy use. As more procedures shift outside acute care, medical office buildings and ambulatory centers invest in furnishings that support throughput, comfort, and brand consistency in multi-site networks in the United States office furniture market. Educational institutions are modernizing administrative suites and learning commons to facilitate hybrid learning and student services, which sustains steady demand for collaborative tables, task seating, and durable storage. Hospitality and retail back offices seek fast, value-oriented replacements tied to lease cycles, and they seek flexible packages that reduce downtime during store refreshes in the United States office furniture market.

By Distribution Channel: B2B Direct Leads, Online Surges
B2B direct from manufacturers accounted for 54.11% in 2025, reflecting decades of dealer-mediated project execution that combines specification, project management, installation, and aftercare under a single coordination umbrella in the United States office furniture market. The channel supports large projects such as corporate campuses and headquarters floorplates, and it allows national brands to scale consistent standards across regions while preserving local service through established dealer partners. Exclusive territories, co-op marketing, and showroom assets anchor these relationships, which in turn create durable moats for incumbents that maintain strong brand recognition and product coverage in the United States office furniture industry. As buyers increase direct replenishment of standardized SKUs, manufacturers are refining which orders route through dealers, and which move through self-serve portals to optimize speed and cost. This hybrid approach keeps complex multi-vendor buildouts under dealer leadership while enabling digital reorders for everyday items in the United States office furniture market.
Online within B2C retail is the fastest expanding route with a 7.36% CAGR during 2026-2031 as procurement professionals demand consumer-grade digital experiences, from inventory visibility to click-to-ship lead times that meet scheduled refresh windows in the United States office furniture market. Transaction sizes continue to rise online as confidence grows in product configurators, virtual previews, and transparent shipping commitments that help de-risk time-sensitive projects. Manufacturers value online channels for the direct data they provide on assortment performance and funnel drop-offs, which fuels continuous improvement in product curation and service SLAs in the United States office furniture market. Brick-and-mortar retail retains a role in immediate replacement and accessory purchases, but share continues to migrate toward digital, given the efficiency gains and planning tools now embedded in leading platforms. As buyers standardize on certified SKUs with proven field performance, digital fulfillment further supports repeatable national refresh programs in the United States office furniture market.
Geography Analysis
The South led with a 36.47% share in 2025, and the West is forecast to post the fastest expansion at a 5.31% CAGR during 2026-2031, placing both regions at the center of near-term growth in the United States office furniture market. Corporate relocations and expansions continue to favor Southern metros with competitive costs and a deepening professional services base, which sustains a broad mix of economy- and mid-range specifications with selective premium upgrades in flagship spaces. Institutional buyers in education, healthcare, and public administration maintain robust compliance filters that steadily increase adoption of GREENGUARD and LEVEL certifications across programmatic purchases in the South. While vacancy remains a factor in some submarkets, a gradual return to office routines and consistent refresh cycles for collaboration zones support measured growth in the United States office furniture market across the region. As national brands add headcount and services in Southern cities, dealer networks in these markets play an outsized role in designing, installing, and supporting standardized kits across many floors and buildings.
The West benefits from stabilization in previously oversupplied markets and from sustained investment in innovation-led economies where ESG preferences and premium design standards are widely adopted in the United States office furniture market. Los Angeles and Phoenix show steady interest in premium, sustainability-certified products, such as entertainment, aerospace, and technology tenants, who are reworking layouts to support hybrid collaboration and client-facing experiences. Bay Area tenants are rightsizing footprints while reinvesting in amenity-rich headquarters, which keeps demand focused on reconfigurable furnishings, acoustic solutions, and height-adjustable platforms that deliver flexible performance in the United States office furniture market. California-centric procurement practices that favor LEVEL and GREENGUARD credentials continue to influence the materials mix and vendor selection in the region. As early adopters pilot IoT-enabled desks and utilization analytics, Western buyers help set the next tier of features that will flow into broader national assortments in the United States office furniture market.
The Northeast remains a high-rent, high-standard region anchored by Manhattan and Boston, where finance, legal, and life sciences emphasize premium fit-outs that blend hospitality aesthetics with robust privacy and security features in the United States office furniture market. Law firms and advisory practices continue to refresh boardrooms and client suites, specifying materials and finishes that project brand stature while meeting stringent emissions thresholds and durability requirements. Philadelphia and several secondary Northeastern markets are still adapting to hybrid patterns that reduce permanent desk assignments, which encourages more lockers, touchdown areas, and huddle spaces in the United States office furniture market. The Midwest benefits from logistics advantages and manufacturers operating regional plants, which shorten lead times and support fast-turn refreshes for cost-focused tenants. As utilization rises nationally, refresh spending in all regions continues to concentrate on adaptable layouts that support in-person collaboration and on materials that document safety and sustainability in the United States office furniture market.
Competitive Landscape
The United States office furniture market is moderately concentrated, which leaves a large long tail contested by regional manufacturers and digital entrants. Scale and brand equity allow incumbents to reinforce dealer relationships, maintain robust warranties and service wraps, and invest in product development that satisfies ergonomic and certification baselines for large tenders in the United States office furniture market. The remaining share is distributed across independent specialists in acoustics and ergonomics, direct-to-consumer brands that target SMBs with quick-ship assortments, and niche players with strong regional footprints that thrive on responsive service and local relationships. This structure creates room for both consolidation and insurgency as buyers adopt hybrid models, elevate indoor air standards, and demand faster execution across phased refresh programs. Incumbents are also investing in omnichannel capability so that repeat orders for standardized SKUs can flow through digital self-serve without weakening dealer chemistry in the United States office furniture market.
Strategic moves by leaders show a pivot toward scale and channel flexibility. MillerKnoll recorded USD 92.3 million in goodwill impairments and USD 37.7 million in trade name write-downs in fiscal 2025 on selected retail and brand units, and the company advanced an omnichannel strategy that included new DWR and Herman Miller retail locations to strengthen direct engagement while it continued to streamline assortments in the United States office furniture market. The company also maintained disciplined capital returns through share repurchases, which it aligned with portfolio simplification and store rollouts to improve long-term profitability and brand clarity. In December 2025, HNI Corporation announced the acquisition of Steelcase for approximately USD 2.2 billion, combining complementary dealer networks and brands and targeting USD 120 million in annual run-rate synergies while planning to deliver toward historical targets through strong free cash flow. The transaction underscores the need for scale to navigate pricing power, procurement savings, and footprint optimization as hybrid work stabilizes in the United States office furniture market. Integration execution and dealer alignment will be central to realizing synergy goals while preserving service reliability on national projects.
Operational innovation and sustainability execution are now key levers for product and brand differentiation. Haworth’s closed-loop process for Fern demonstrates how continuous internal recycling of plastic parts can lower carbon footprints by 10% while maintaining quality and aesthetics, aligning with expanding ESG criteria in enterprise RFPs across the United States office furniture market. Leaders are embedding analytics and digital engagement into the buying journey so enterprise teams can standardize kits faster and reduce rework, which benefits both dealers and end users through fewer change orders and more reliable schedules. Specialized categories such as acoustic pods and modular privacy solutions are maturing from niche purchases into standard program elements, creating opportunities for both established manufacturers and focused specialists as open-plan environments continue to evolve in the United States office furniture market. As hybrid attendance solidifies and refresh cycles become institutionalized, the ability to combine service depth, certified materials, and digital convenience will define competitive momentum over the forecast horizon in the United States office furniture market.
United States Office Furniture Industry Leaders
MillerKnoll, Inc.
Steelcase Inc.
Haworth Inc.
HNI Corporation
Teknion Group
- *Disclaimer: Major Players sorted in no particular order


Recent Industry Developments
- February 2026: Haworth acquired Heller, the relaunched furniture brand founded by John Edelman in 2022, integrating it into Haworth's Lifestyle Design division alongside luxury brands Cappellini, Cassina, Poltrona Frau, and JANUS et Cie. Edelman will serve as Creative Director for Heller and President of North & South America for Haworth's luxury portfolio.
- December 2025: HNI Corporation completed its acquisition of Steelcase Inc. for approximately USD 2.2 billion, combining two of the industry's largest suppliers with complementary dealer networks and brand portfolios (HON, Allsteel, Kimball for HNI; Steelcase, Coalesse, AMQ, HALCON for Steelcase).
- June 2025: MillerKnoll showcased design and innovation at NeoCon 2025, highlighted new product launches that were projected to increase more than 100% versus Spring 2024, and opened new retail locations, including a DWR Studio in Palm Springs and a Herman Miller store in Fairfax, Virginia, during Q3 FY25 as part of its omnichannel strategy.
- December 2025: HNI Corporation completed its acquisition of Steelcase Inc. for approximately USD 2.2 billion, combining two of the industry's largest suppliers with complementary dealer networks and brand portfolios (HON, Allsteel, Kimball for HNI; Steelcase, Coalesse, AMQ, HALCON for Steelcase).


Research Methodology Framework and Report Scope
Market Definitions and Key Coverage
Our study defines the United States office furniture market as revenue generated from new chairs, desks, workstations, tables, storage units, soft seating, screens, and ancillary accessories that are installed in commercial, institutional, and co-working workplaces across all fifty states. Revenue from installation services is counted; yet resale, refurbished, rental, and household-only pieces are excluded to keep the scope consistent with corporate capital-expenditure budgets.
Scope Exclusion: Residential furniture that occasionally doubles as a home-office desk or chair is out of scope.
Segmentation Overview
- By Product
- Chairs
- Employee Chairs
- Meeting Chairs
- Guest Chairs
- Tables
- Conference Tables
- Desks
- Other Tables
- Storage Units
- Filing Cabinets
- Bookcases & Shelving
- Sofas/Soft Seating
- Booths and Office Dividers
- Other Office Furniture (Stools, Reception Area Furniture, Accessories, Others)
- Chairs
- By Material
- Wood
- Metal
- Plastic & Polymer
- Other Materials
- By Price Range
- Economy
- Mid-range
- Premium
- By End-user
- Corporate Offices
- Healthcare Offices
- Educational Institutions
- Government & Public Offices
- Hospitality & Retail Back-office
- Others
- By Distribution Channel
- B2C / Retail
- Home Centers
- Specialty Furniture Stores
- Online
- Other Distribution Channels
- B2B / Directly from Manufacturers
- B2C / Retail
- By Geography
- Northeast
- Midwest
- South
- West
Detailed Research Methodology and Data Validation
Primary Research
Our analysts interviewed workplace designers, facilities managers, regional dealers, and material suppliers across the Northeast, Midwest, Sun Belt, and Pacific clusters. These conversations validated utilization rates, average selling prices, and emerging preferences for height-adjustable systems; then filled data gaps left by public sources.
Desk Research
We began with federal data sets from the U.S. Census Bureau's Annual Survey of Manufactures, Bureau of Labor Statistics producer-price files, and the Energy Information Administration's Commercial Buildings Energy Consumption Survey. Trade flows were captured from U.S. International Trade Commission customs codes, while import partner splits were double-checked through Volza shipment logs. Industry viewpoints were drawn from BIFMA white papers, peer-reviewed ergonomics journals, and corporate 10-K filings. Subscription databases such as D&B Hoovers and Dow Jones Factiva enriched company revenue splits and plant capacities. The sources cited illustrate, not exhaust, the range mined for numbers and context.
A second sweep targeted regional construction permits, healthcare facility certifications, and state procurement portals, allowing us to benchmark furniture demand triggers that traditional statistics often miss. This layered reading ensured early anomaly detection before primary outreach began.
Market-Sizing & Forecasting
A top-down demand pool was built from corporate floorspace inventory and fit-out cycles, which are aligned with employment growth and vacancy trends. Select bottom-up checks, dealer sales roll-ups, and sampled ASP x volume for seating and benching refined the totals. Key model drivers include commercial starts, remote-work penetration, import share of metal frames, LEED-certified office completions, and BIFMA LEVEL certification uptake. Forecasts rely on multivariate regression mixed with scenario analysis so we can stress-test shifts in hybrid attendance or raw-material costs. Data gaps in sub-categories were bridged by ratio imputation anchored to verified company disclosures.
Data Validation & Update Cycle
Outputs pass two rounds of peer review; outlier flags trigger re-contact with experts, and every published figure is refreshed annually, with interim updates whenever material events alter the demand baseline.
Why Mordor's United States Office Furniture Baseline Commands Reliability
Published numbers vary because firms choose distinct product baskets, refresh cadences, and forecast horizons.
Key gap drivers include whether home-office goods are blended with corporate spend, if institutional segments such as education are folded in, the currency conversion year selected, and the cadence at which dealer price lists are refreshed.
Benchmark comparison
| Market Size | Anonymized source | Primary gap driver |
|---|---|---|
| USD 16.18 B (2025) | Mordor Intelligence | - |
| USD 16.64 B (2024) | Regional Consultancy A | Includes ready-to-assemble home desks and uses a one-year older price deck |
| USD 14.73 B (2023) | Industry Association B | Excludes soft seating and relies on shipment counts without ASP adjustment |
| USD 15.30 B (2024) | Global Consultancy C | Blends institutional furniture and applies constant 2022 exchange rates |
Differences shown above underline why clients trust the disciplined variable selection and annual refresh that Mordor Intelligence applies, giving decision-makers a balanced, transparent baseline they can retrace with ease.


Key Questions Answered in the Report
What is the current size and growth outlook for the United States office furniture market?
The United States office furniture market size was USD 15.82 billion in 2025, is expected to reach USD 16.47 billion in 2026, and is projected to reach USD 20.94 billion by 2031 at a 4.92% CAGR during 2026-2031.
Which product categories are leading, and which are growing fastest in the United States office furniture market?
Chairs led with a 37.88% share in 2025, while booths and office dividers are the fastest growing, with a 6.58% CAGR during 2026-2031, driven by retrofit needs for privacy and hybrid collaboration.
Which buyer segments will drive incremental demand through 2031 in the United States office furniture market?
Corporate offices remain the largest at 48.92% in 2025, and healthcare offices are the fastest growing with a 6.07% CAGR as outpatient care expands and medical offices invest in durable, compliant furnishings.
How is channel mix evolving in the United States office furniture market?
B2B direct from manufacturers accounted for 54.11% in 2025 through dealer-led projects, while online B2C retail is set to grow fastest at a 7.36% CAGR, driven by self-serve procurement and configuration tools.
Which regions contribute most to demand in the United States office furniture market?
The South led with 36.47% in 2025 on corporate expansion and institutional spending, while the West is the fastest-growing region at a 5.31% CAGR with strong sustainability preferences and premium adoption.
What themes define competitive strategy in the United States office furniture market?
Scale consolidation, omnichannel fulfillment, and verified sustainability credentials define the playbook, while product innovation in acoustics, ergonomics, and circular materials supports differentiation and margin resilience.
Page last updated on:


