Office Furniture For Hospitality Settings Market Size and Share
Market Overview
| Study Period | 2021 - 2031 |
|---|---|
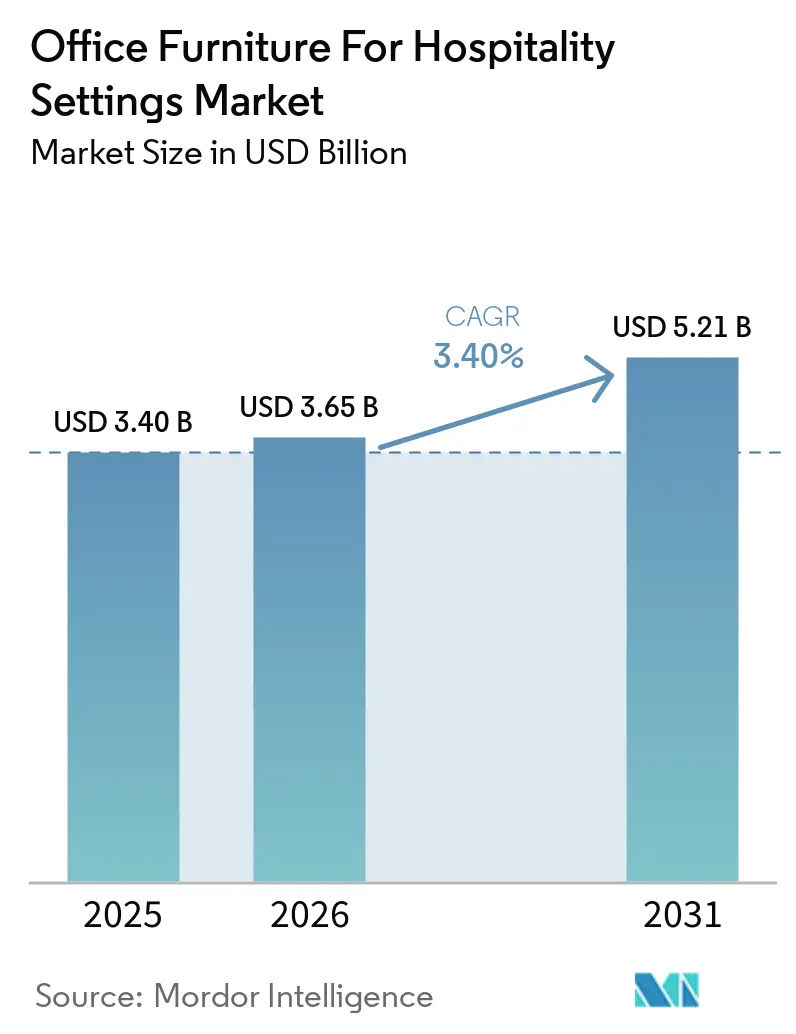
| Market Size (2026) | USD 3.65 Billion |
| Market Size (2031) | USD 5.21 Billion |
| Growth Rate (2026 - 2031) | 3.40% CAGR |
| Fastest Growing Market | Asia-Pacific |
| Largest Market | Europe |
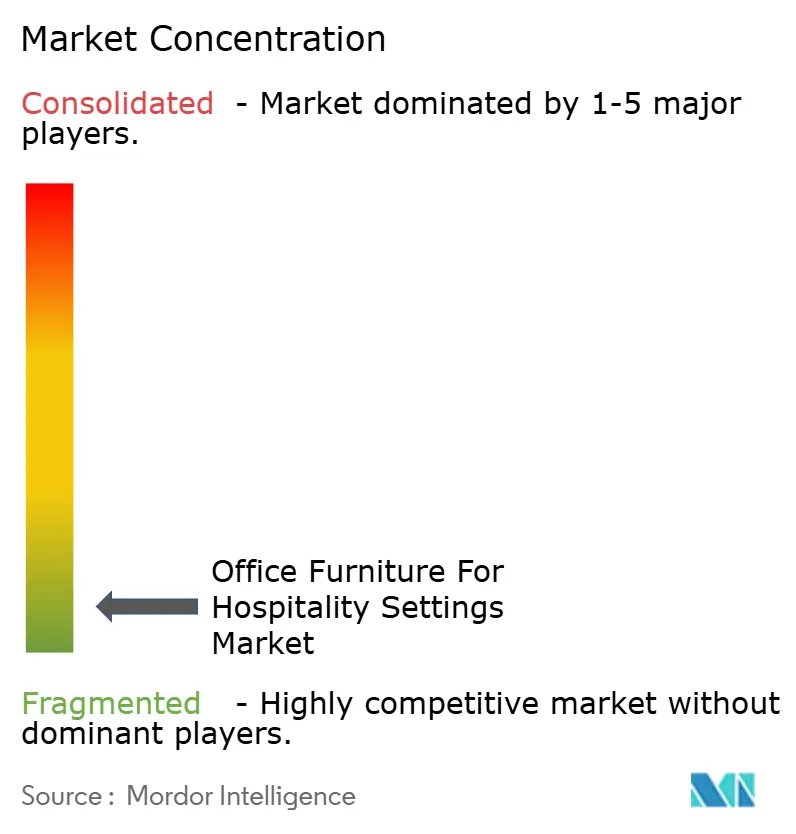
| Market Concentration | Low |
Major Players *Disclaimer: Major Players sorted in no particular order Image © Mordor Intelligence. Reuse requires attribution under CC BY 4.0. | |
Office Furniture For Hospitality Settings Market Analysis by Mordor Intelligence
The Office Furniture For Hospitality Settings Market size is expected to grow from USD 3.40 billion in 2025 to USD 3.65 billion in 2026 and is forecast to reach USD 5.21 billion by 2031 at 3.40% CAGR over 2026-2031.
Record-level construction and a high volume of property conversions are pushing forward front-of-house and back-of-house fit-outs, while faster renovation cycles are prioritizing modular and low-emission solutions to reduce downtime and maintain brand consistency across portfolios. Work-from-hotel and on-property co-working programs are reshaping lobby and in-room work zones, which drives demand for ergonomic seating, height-adjustable desks, and integrated power that align with ADA access rules and low-VOC specifications[1]U.S. Department of Justice, “2010 ADA Standards for Accessible Design,” ADA.gov, ada.gov.
Sustainability-led procurement centered on LEED v4.1, BIFMA Level, and GREENGUARD Gold is now a mainstream requirement across global chains. It is influencing materials, finishes, and supplier selection for the office furniture market in hospitality settings. Digital check-in and mobile keys reduce the need for large reception counters. However, ADA-compliant counters and inclusive reception redesigns continue to generate specification activity and offset part of the demand shift in the office furniture for hospitality settings market. E-commerce and catalog-based procurement with AR visualization are compressing lead times and enabling faster standardization for multi-property refreshes across the office furniture for hospitality settings market.
Key Report Takeaways
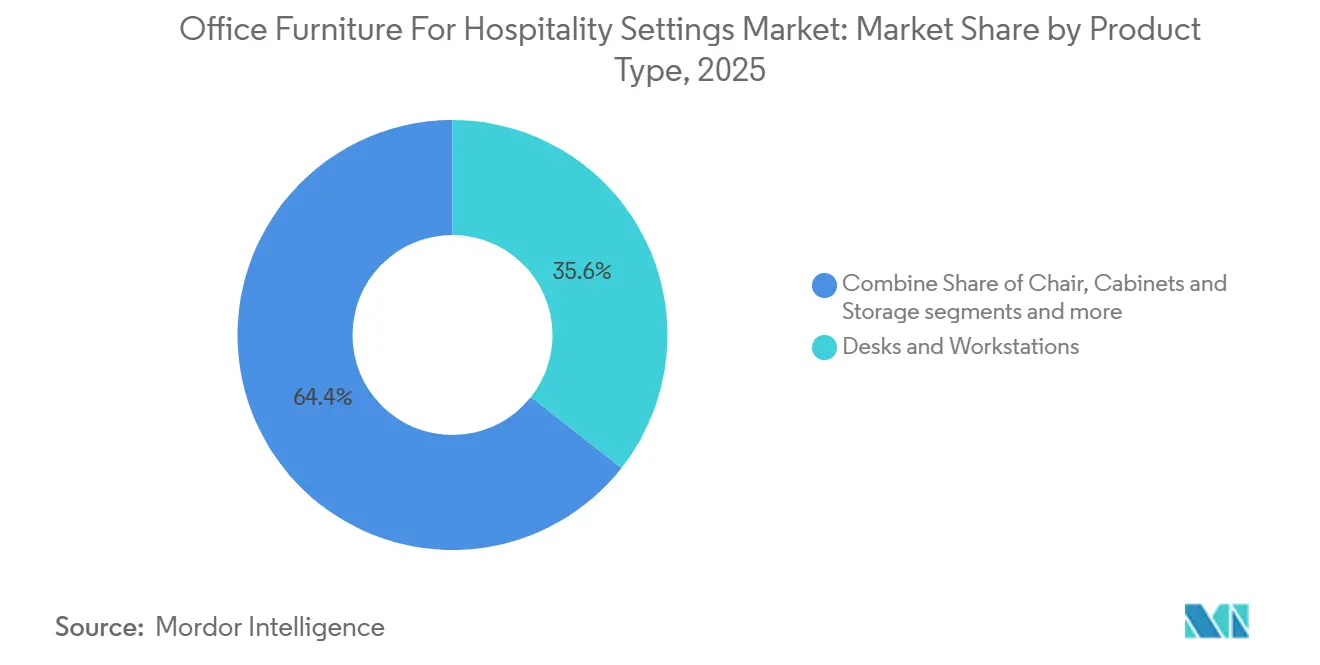
- By product category, desks and workstations led with a 35.62% revenue share in the office furniture for hospitality settings market in 2025, while ergonomic accessories are projected to expand at a 7.88% CAGR through 2031.
- By material type, wood accounted for 52.15% of the office furniture for hospitality settings market in 2025, and plastics and polymers recorded the highest projected growth at an 8.12% CAGR to 2031.
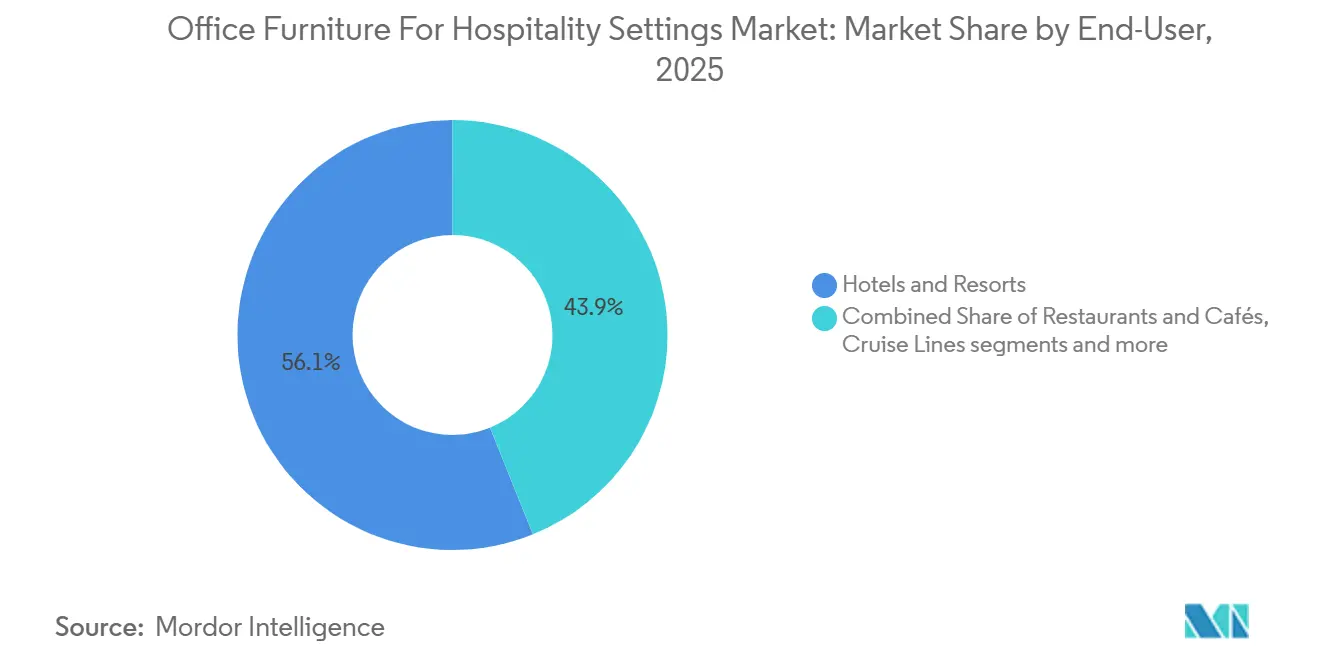
- By end user, hotels and resorts held a 56.11% share in 2025, while casinos and integrated resorts are the fastest-growing sub-segment at a 9.10% CAGR to 2031.
- By distribution channel, dealer and distributor sales retained a 44.81% share in the office furniture for hospitality settings market in 2025, while e-commerce and catalog sales are advancing at an 8.33% CAGR through 2031.
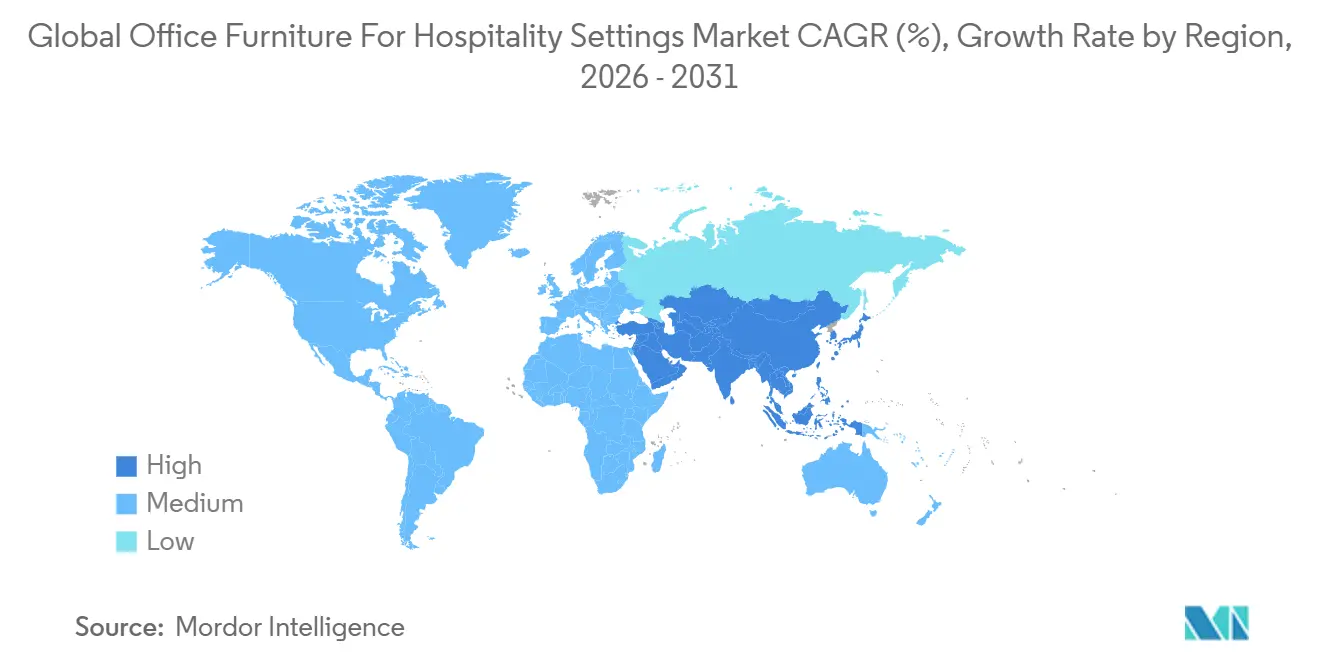
- By geography, Europe commanded a 32.15% share in 2025, and Asia-Pacific is the fastest-growing region at an 8.41% CAGR through 2031.
Note: Market size and forecast figures in this report are generated using Mordor Intelligence’s proprietary estimation framework, updated with the latest available data and insights as of January 2026.
Global Office Furniture For Hospitality Settings Market Trends and Insights
Drivers Impact Analysis*
| Driver | (~) % Impact on CAGR Forecast | Geographic Relevance | Impact Timeline |
|---|---|---|---|
| Record-High Hotel Construction, Conversions, and Early-Planning Pipelines Expanding FOH/BOH Fit-Outs | 1.8% | Global, with concentration in United States, China, India, Middle East | Medium term (2-4 years) |
| Renovation Cycles Favoring Business Centers, Meeting Spaces, Reception Upgrades | 1.5% | Europe, North America, Asia-Pacific core markets | Short term (≤ 2 years) |
| Co-Working And "Work-From-Hotel" Programs Creating on-Property Work Zones | 1.2% | Global metropolitan areas, with early gains in United States, Europe, UAE | Medium term (2-4 years) |
| Sustainability-Led Procurement (LEED/BIFMA Level) Reshaping Specifications | 1.3% | Global, strongest in North America, Europe, Asia-Pacif luxury tier | Long term (≥ 4 years) |
| ADA-Compliant Service Counters and Inclusive Design Driving Reception Redesign | 0.7% | Primarily North America, regulatory influence spreading to EU under EAA | Medium term (2-4 years) |
| GDPR-Compliant Visitor Management at Reception Areas | 0.4% | EU core, with compliance spillover into United Kingdom, UAE free zones | Short term (≤ 2 years) |
| Source: Mordor Intelligence | |||
Record-High Hotel Construction, Conversions, and Early-Planning Pipelines Expanding FOH/BOH Fit-Outs
A sustained wave of construction, conversions, and early planning is elevating demand for modular front-of-house and back-of-house furniture in lobbies, business centers, and operations offices, especially where brand standards require fast refresh cycles with minimal downtime[2]Steelcase Editorial Team, “Hospitality Solutions and Hybrid Work,” Steelcase, steelcase.com. Developers and operators are prioritizing solutions that ship on predictable lead times and meet documented sustainability and indoor air quality thresholds, such as BIFMA Level and GREENGUARD Gold, which simplifies multi-property deployment and compliance reviews across the office furniture for hospitality settings market.
Luxury-tier projects now specify adjustable desks and ergonomic seating for in-room work alcoves and guest lounges, blending hospitality aesthetics with contract-grade performance for extended use. Brownfield conversions and adaptive reuse programs compress procurement windows, favoring suppliers with ISO 14001-aligned environmental management and FSC chain-of-custody documentation ready for submittal at the RFP stage. As a result, the office furniture for hospitality settings market is benefiting from a cycle in which design flexibility, certifiable materials, and repeatable installation workflows outweigh bespoke one-offs across many property tiers.
Renovation Cycles Favoring Business Centers, Meeting Spaces, Reception Upgrades
Capital is focusing on high-impact guest-facing zones, such as reception, co-working lounges, and meeting spaces, where ergonomic seating, height-adjustable workstations, and integrated power deliver visible gains in satisfaction scores and space utilization. Fire safety, low emissions, and accessibility are being addressed together, with specifications referencing California TB 117-2013, GREENGUARD Gold thresholds under CDPH methods, and ADA 2010 counter and knee-clearance dimensions for front desks and service points. Modular systems that allow component swaps, reupholstering, and quick field replacement reduce room closures and align with lifecycle cost targets for chains that manage large property portfolios.
Lounge systems with privacy layers and mobile configurations help lobbies pivot from arrival peaks to daytime co-working, a shift that supports throughput and revenue on days with limited group business. These moves sustain momentum in the office furniture for hospitality settings market by pairing performance improvements with compliance-ready documentation for facility teams and owners.
Co-Working And "Work-From-Hotel" Programs Creating on-Property Work Zones
By 2026, on-property work programs will be a durable part of the operating mix, with hotels converting sections of lobbies and guestroom bands into revenue-generating micro-hubs that require contract-grade seating, adjustable desks, and acoustic elements[3]Marriott International Sustainability, “Responsible Sourcing and FF&E,” Marriott International, marriott.com.
Mobile and web-app flows are preferred by a large share of United States travelers, reducing check-in friction and freeing lobby space for flexible work seating plans and power-dense zones. Branded initiatives such as co-working passes and day-use programs standardize furniture specifications around posture support, integrated charging, and quick-clean finishes, which normalizes commercial ergonomics in hospitality settings.
Height-adjustable models, compact task chairs with lumbar support, and mobile tables with secure cable management are prevalent, supported by well-known contract brands and electric lift systems designed for extended duty cycles. This evolution keeps the office furniture for hospitality settings market-oriented toward workstation-grade performance in spaces that also serve social and F&B functions.
Sustainability-Led Procurement (LEED/BIFMA Level) Reshaping Specifications
Sustainability criteria have moved from optional to expected, with LEED v4.1 material credits, BIFMA LEVEL certification, and published health and environmental disclosures now present in a growing share of hospitality procurement templates. GREENGUARD Gold certification under CDPH methods helps chains meet indoor air quality goals while maintaining durability and cleanability, which is critical for 24-hour spaces such as reception and business centers. Brand initiatives like Marriott’s sustainable furniture requirements and supplier take-back programs are encouraging recycled content, ingredient transparency, and circular refurbishment pathways across the office furniture market for hospitality settings.
Operator case examples show that LEED-aligned projects can pair low-emission materials and surface reuse with energy and water savings that offset part of the upfront furniture premium over the lifecycle. Circular-ready furniture recognized by industry awards and registries is helping owners differentiate properties while retaining the capacity to refresh finishes and components without replacing core frames.
Restraints Impact Analysis*
| Restraint | Impact % | Geographic Relevance | Timeline |
|---|---|---|---|
| CapEx Tightness And Input Cost Inflation Deferring BOH Investments | -0.90% | Global, most acute in independent/mid-market operators | Medium term (2-4 years) |
| Mobile Check-In, Digital Keys, and Kiosks Reducing Large Front-Desk Footprints | -0.50% | Global branded chains, with North America leading adoption | Medium term (2-4 years) |
| High-Spec Sustainability/IAQ and Multi-Code Compliance Elevating Costs and Lead Times | -0.60% | Global, strongest impact in North America, Europe, regulated Asia-Pacific markets | Long term (≥ 4 years) |
| Preference for Bespoke Millwork at Luxury FOH Slows Modular Reception Adoption | -0.40% | Luxury/ultra-luxury tier globally, concentrated in Europe, Middle East | Medium term (2-4 years) |
| Source: Mordor Intelligence | |||
CapEx Tightness And Input Cost Inflation Deferring BOH Investments
Operators continue to balance required refreshes in guest-facing zones with back-of-house upgrades, and higher input costs can delay some BOH desks, storage, and task seating purchases in favor of items visible to guests. Sustainability and accessibility requirements add upfront steps for documentation and verification, which elevates the value of certified, modular solutions that simplify repeat purchases across property portfolios. To mitigate budget pressure, chains are prioritizing modular furniture with field-replaceable components and refurbishable finishes that extend lifecycles and reduce waste. E-commerce catalogs and configure-to-order workflows are also helping independents and mid-market owners keep projects on schedule, which stabilizes demand in the office furniture for hospitality settings market during tighter budget windows.
Mobile Check-In, Digital Keys, and Kiosks Reducing Large Front-Desk Footprints
As mobile check-in and digital keys become common, properties reduce oversized reception counters and shift some flows to kiosks or app-based processes, which tempers demand for large millwork in favor of smaller counters and multiuse concierge pods. ADA-compliant counter sections and inclusive service layouts remain mandatory, keeping a baseline of reception furniture demand even as overall footprints shrink. Operators are deploying digital wallet-compatible keys and encrypted access platforms, further reducing card issuance and underscoring the importance of seating clusters and privacy screens for guest interactions. The shift sustains activity in the office furniture for hospitality settings market while reallocating square footage to work zones, lounges, and F&B seating where ergonomic performance and durable finishes are prioritized.
*Our forecasts treat driver/restraint impacts as directional, not additive. The impact forecasts reflect baseline growth, mix effects, and variable interactions.
Segment Analysis
By Product Type: Ergonomic Accessories Surge as Wellness Reshapes Specifications
Desks and workstations commanded 35.62% of the 2025 share, and the office furniture for hospitality settings market size attached to this category remains anchored by hybrid-use guest rooms and co-working lounges that require contract-grade worksurfaces, height adjustability, and integrated power. Ergonomic accessories are advancing at a 7.88% CAGR through 2031, which reflects stronger expectations for posture support, cleanable materials, and standardized monitor arms in both guest and staff spaces for the office furniture for hospitality settings market. Chains now specify adjustable mechanisms, USB-C power delivery, and cable management to sustain uptime and minimize hazards in high-traffic lobbies and business centers. Contract seating with lumbar support and performance fabrics is displacing static chairs in back-office and in-room work alcoves, which aligns with ergonomic guidance referenced by enterprise programs. These changes raise the share of SKUs that carry environmental and ergonomic documentation at the time of purchase, supporting parallel compliance with IAQ and accessibility standards.
Task seating is the second-largest category by revenue, supported by business-center density and BOH requirements that demand adjustable arms, a seat depth range, and tilt controls for different user profiles throughout the day. Storage and tables maintain durable demand in BOH offices and meeting rooms, as fit-outs need fire-rated, low-emission finishes that withstand commercial cleaning cycles across multi-year lifetimes. In lobbies, modular lounge systems and mobile tables enable quick reconfiguration from arrival peaks to daytime co-working, reducing SKU load and delivering clear cost-of-ownership benefits for owners with frequent refresh requirements. Accessory growth is also tied to standardized monitor arms, keyboard trays, and footrests that allow standing or seated work to be tailored to different users without extensive setup, meeting ISO and BIFMA guidelines recognized by specifiers. As wellness features integrate into reception and guestrooms, the office furniture market for hospitality settings continues to align with extended-use ergonomics that enhance guest comfort and reduce staff fatigue.


By Material Type: Plastics Accelerate as Circular Economy and Antimicrobial Standards Converge
Wood held 52.15% of the 2025 share, which reflects luxury-tier preferences for FSC-certified species and warm finishes that are consistent with brand heritage and premium positioning in the office furniture for hospitality settings market. Plastics and polymers are posting an 8.12% CAGR through 2031, favored for antimicrobial performance, weight reduction, and circular take-back programs that align with BIFMA Level and LEED v4.1 material disclosures. In structural applications, metal frames meet durability and stability requirements while facilitating field serviceability, extending furniture lifetimes in high-use zones. Chain procurement teams continue to embed GREENGUARD Gold thresholds into FF&E packages so that table tops, case goods, and seating contribute to IAQ goals from day one. This set of criteria supports a measured yet clear shift toward office furniture for hospitality settings with documented emissions and recycling pathways.
Technical compliance is shaping choices even in decorative elements, as fire safety rules and formaldehyde limits under the United States TSCA inform material selection for veneers and composites. In select luxury applications, copper and certain alloys are used for their inherent antimicrobial properties. However, life-cycle cost comparisons favor powder-coated steel with approved topcoats in many back-office and guest-facing installations. Circular-ready programs highlighted by recognized manufacturers show how recycled content and take-back logistics can deliver credible environmental claims alongside service-level consistency. Boutique and luxury properties continue to specify premium woods and bespoke casework where brand identity requires tactile and visual distinctiveness. At the same time, standardized components dominate midscale deployments due to lead-time and budget discipline. Together, these threads sustain a dual-track approach in the office furniture for hospitality settings market where wood-led aesthetics coexist with polymer-led performance and circularity.
By End-User: Casinos and Integrated Resorts Lead Growth with Non-Gaming Infrastructure Spend
Hotels and resorts accounted for 56.11% of the 2025 end-user share, reflecting the segment’s property base and renovation intensity in the office furniture market for hospitality settings. Casinos and integrated resorts are the fastest-growing sub-segment, with a 9.10% CAGR to 2031, and fit-outs spanning reception, VIP lounges, and conference spaces that require BIFMA Level, FSC, and low-emission certifications. Regulatory frameworks in leading jurisdictions emphasize accessibility, fire resistance, seismic performance, and IAQ, which leads operators to prefer standardized, third-party-verified components that compress approval cycles and simplify multi-year refreshes. Seating, desks, and tables with documented performance and material profiles reduce scope risk during vendor onboarding and streamline maintenance across high-traffic floors. These dynamics reinforce pockets of high-specification demand, lifting growth at the premium end of the office furniture market for hospitality settings.
Restaurants and cafés represent a durable slice of demand due to the cleaning intensity and seat-turn expectations in dining spaces that reward hard-wearing laminates and commercial upholstery. Bars and nightlife formats continue to combine statement case goods with resilient seating, although procurement teams are applying greater scrutiny to lifecycle costs and cleanability. Cruise lines invest in height-adjustable desks and ergonomic seating for co-working areas on board as connectivity upgrades enable remote work at sea, expanding the use cases for workstation-grade furniture in mixed-use lounges. Convention and exhibition centers prioritize mobile, stackable, and interlocking seating and tables to support rapid reconfigurations between event formats. Wellness retreats favor low-emission, biophilic materials such as bamboo and reclaimed timber that align with branding and IAQ targets. Together, these end-user patterns keep the office furniture for hospitality settings market diversified across multiple operating models and refresh cadences.
By Distribution Channel: E-Commerce and Catalog Sales Compress Lead Times via AR Visualization and Direct Shipping
Dealer and distributor sales held 44.81% of the 2025 share, supported by white-glove delivery, on-site assembly, and warranty services that remain critical for full-property renovations in the office furniture for hospitality settings market. E-commerce and catalog channels are advancing at an 8.33% CAGR through 2031, aided by AR visualization, configure-to-order tools, and direct factory shipping, which compress timelines for standardized SKUs. Trade platforms now integrate with design and procurement software to centralize specifications, net pricing, and availability for hospitality designers and general contractors.
Direct tender structures still dominate large-scale projects where volume, customization, and phased delivery align with construction milestones and brand standards. In parallel, configure-to-order programs at regional distribution hubs balance speed and customization for mid-market owners who require showroom access and guaranteed service windows. Partnerships between manufacturers and design firms embed pricing, lead times, and sustainability attributes into BIM workflows, thereby shortening submittal cycles and supporting consistent documentation across portfolios. This omni-channel progression expands choice and reliability for buyers across the hospitality office furniture market.
Geography Analysis
Europe accounted for 32.15% of global share in 2025, with mature refurbishment cycles, robust sustainability mandates, and premium brands placing a premium on FSC wood, low-emission finishes, and dual-height reception counters that align with accessibility rules. Enforcement of the European Accessibility Act in 2025 increased emphasis on inclusive physical and digital front-of-house experiences, which influenced furniture sizing, approach clearances, and signage across lobbies and meeting zones. LEED v4.1 and GREENGUARD Gold credentials feature prominently in procurement templates to satisfy IAQ and material ingredient targets in premium segments that dominate renovation capex. As a result, the office furniture for hospitality settings market in Europe favors multi-certified products that balance aesthetics with documented performance and serviceability.
Asia-Pacific is the fastest-growing region, with a 8.41% CAGR through 2031, reflecting large development pipelines, integrated resort investments, and hybrid-use guest spaces that require ergonomic seating and height-adjustable desks in both rooms and lounges. Operators in leading hubs are standardizing sustainability and accessibility documentation to shorten approval cycles and reduce the scope of retrofits as requirements evolve. Programmatic adoption of LEED v4.1 and local standards pushes furniture toward low emissions, recycled content, and traceable supply chains that can be audited across submittals and vendor changes. Technical credentials and field serviceability increasingly determine vendor selection, especially when refurbishment windows are tight and phased handovers are required.
North America accounts for an estimated 26–28% of 2025 demand, with co-working and day-use programs encouraging ergonomic work points in lobbies and guestrooms, while ADA rules guide reception layouts and counter dimensions. Mobile check-in and digital keys reduce front-desk volumes but elevate the need for compliant, compact service counters and zoned lounge seating for concierge and digital support interactions. LEED v4.1 and BIFMA Level are now standard line items in many FF&E packages, and tax incentives for barrier removal provide partial offsets that support the deployment of accessible workstations and reception counters.the
The Middle East and Africa account for 8–10% of 2025 demand, with smart district requirements encouraging connected furniture, low-emission finishes, and documented supply chains that align with local rating systems. South America represents 5–7% of demand with increased focus on durable case goods and low-VOC finishes for boutique and business hotels, which feeds steady specification activity in the office furniture for hospitality settings market.

Competitive Landscape
The office furniture for hospitality settings market is fragmented, with no single vendor accounting for more than 10% of global revenue, reflecting a split between multinational contract brands and regional specialists that cater to price points and shorter delivery windows. Multinationals compete on sustainability credentials, ergonomic performance, and lifecycle programs, including take-back and refurbishment for frames and modules that remain in service across multiple refreshes. Regional manufacturers leverage local sourcing and configure-to-order capabilities to meet short lead times and hospitality-specific compliance requests in mid-market properties.
Portfolio depth and certification coverage enable cross-category packages for hotel programs. Steelcase reported USD 3.2 billion in FY2024 revenue, with hospitality penetration driven by modular lounges and task seating offered alongside documentation that streamlines owner approvals. MillerKnoll posted USD 3.7 billion in FY2025 revenue, bringing premium design brands and accessories into bundled offerings for lobbies, guest work points, and meeting rooms. Haworth recorded USD 2.7 billion in 2025 sales and highlighted circular-ready seating, which is recognized for its use of closed-loop plastics, aligning with hotel sustainability goals.
Strategic moves emphasize circularity, AR-aided specification, and integrated power management. Manufacturers are expanding GREENGUARD Gold coverage, publishing health and environmental disclosures, and listing products in the LEVEL registry to demonstrate conformance to material, energy, and social criteria. AR visualization tools and BIM-integrated pricing help designers and owners standardize room sets with photorealistic previews before purchase, reducing submittal time and sample freight. These steps reduce procurement friction and support repeatable deployment models that are well-suited to the office furniture for hospitality settings market.
Office Furniture For Hospitality Settings Industry Leaders
MillerKnoll, Inc.
Steelcase Inc.
Haworth Inc.
HNI Corporation
Teknion Corporation
- *Disclaimer: Major Players sorted in no particular order

Recent Industry Developments
- April 2026: Chancery Hotel Dublin launched its Urban Flex Desk package, featuring soundproofed co-working pods with ergonomic seating, personal secure-key lockers, and wellness-hub access, targeting hybrid-office hospitality users and generating early adoption among digital nomads seeking long-term workspace solutions in European urban centers.
- January 2026: Club Quarters Hotels completed rollout of digital wallet-compatible room keys (Apple Wallet, Google Wallet) across all United States and United Kingdom properties, eliminating plastic-card issuance and centralizing guest-data flows into Vingcard's Vostio Access Management cloud platform, advancing GDPR compliance and reducing front-desk transaction volumes by approximately 35%.
- September 2024: Herman Miller Gaming announced partnership with Hilton to introduce gaming chairs and ergonomic accessories at 60 Tru by Hilton, Home2 Suites, and Hilton Garden Inn properties across North America, enabling guests to book gaming-optimized rooms via Hilton Honors app and demonstrating 22% higher booking intent among Gen Z and Millennial travelers when ergonomic gaming amenities are listed in room descriptions.


Global Office Furniture For Hospitality Settings Market Report Scope
| Chair |
| Desks and Workstations |
| Cabinets and Storage |
| Table and Stools |
| Ergonomic Accessories |
| Others |
| Wood |
| Metal |
| Plastic & Polymers |
| Other Materials |
| Hotels & Resorts |
| Restaurants & Cafes |
| Bars & Nightlife Venues |
| Casinos & Integrated Resorts |
| Cruise Lines |
| Convention & Exhibition Centers |
| Spas & Wellness Retreats |
| Direct Tender / Institutional Sales |
| Dealer & Distributor Sales |
| E-commerce & Catalog Sales |
| North America | Canada |
| United States | |
| Mexico | |
| South America | Brazil |
| Peru | |
| Chile | |
| Argentina | |
| Rest of South America | |
| Europe | United Kingdom |
| Germany | |
| France | |
| Spain | |
| Italy | |
| BENELUX (Belgium, Netherlands, and Luxembourg) | |
| NORDICS (Denmark, Finland, Iceland, Norway, and Sweden) | |
| Rest of Europe | |
| Asia-Pacific | India |
| China | |
| Japan | |
| Australia | |
| South Korea | |
| South East Asia (Singapore, Malaysia, Thailand, Indonesia, Vietnam, and the Philippines) | |
| Rest of Asia-Pacific | |
| Middle East and Africa | United Arab Emirates |
| Saudi Arabia | |
| South Africa | |
| Nigeria | |
| Rest of the Middle East and Africa |
| By Product Type | Chair | |
| Desks and Workstations | ||
| Cabinets and Storage | ||
| Table and Stools | ||
| Ergonomic Accessories | ||
| Others | ||
| By Material Type | Wood | |
| Metal | ||
| Plastic & Polymers | ||
| Other Materials | ||
| By End User | Hotels & Resorts | |
| Restaurants & Cafes | ||
| Bars & Nightlife Venues | ||
| Casinos & Integrated Resorts | ||
| Cruise Lines | ||
| Convention & Exhibition Centers | ||
| Spas & Wellness Retreats | ||
| By Distribution Channel | Direct Tender / Institutional Sales | |
| Dealer & Distributor Sales | ||
| E-commerce & Catalog Sales | ||
| By Geography | North America | Canada |
| United States | ||
| Mexico | ||
| South America | Brazil | |
| Peru | ||
| Chile | ||
| Argentina | ||
| Rest of South America | ||
| Europe | United Kingdom | |
| Germany | ||
| France | ||
| Spain | ||
| Italy | ||
| BENELUX (Belgium, Netherlands, and Luxembourg) | ||
| NORDICS (Denmark, Finland, Iceland, Norway, and Sweden) | ||
| Rest of Europe | ||
| Asia-Pacific | India | |
| China | ||
| Japan | ||
| Australia | ||
| South Korea | ||
| South East Asia (Singapore, Malaysia, Thailand, Indonesia, Vietnam, and the Philippines) | ||
| Rest of Asia-Pacific | ||
| Middle East and Africa | United Arab Emirates | |
| Saudi Arabia | ||
| South Africa | ||
| Nigeria | ||
| Rest of the Middle East and Africa | ||


Key Questions Answered in the Report
What is the current size and growth outlook for the office furniture for hospitality settings domain?
The office furniture for hospitality settings market size was USD 3.40 billion in 2025 and is projected to reach USD 5.21 billion by 2031 at a 7.38% CAGR over 2026-2031.
Which product category leads and which is growing fastest in this space?
Desks and workstations led with a 35.62% share in 2025, while ergonomic accessories are the fastest-growing at a 7.88% CAGR through 2031.
Which region is expanding the quickest for hospitality-centric office furniture?
Asia-Pacific is the fastest-growing region with an 8.41% CAGR through 2031 for the office furniture for hospitality settings market.
How are accessibility and privacy regulations shaping specifications?
ADA 2010 Standards and the European Accessibility Act drive dual-height service counters and inclusive layouts, while GDPR requires data-minimizing reception workflows and supports digital check-in adoption.
Which distribution channels are gaining momentum for procurement?
E-commerce and catalog channels are advancing at an 8.33% CAGR through 2031, supported by AR visualization and direct shipping, while dealer networks retain a strong role for white-glove services.
Page last updated on:


