Nutrigenomics Testing Market Size and Share
Market Overview
| Study Period | 2019 - 2030 |
|---|---|
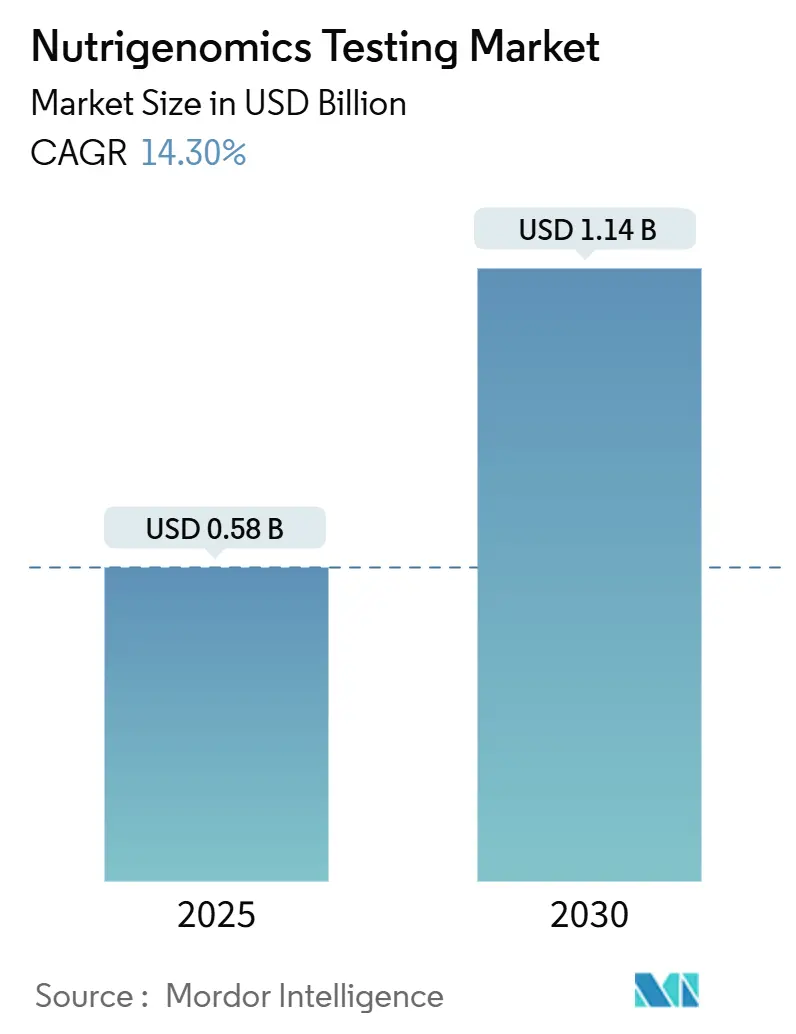
| Market Size (2025) | USD 0.58 Billion |
| Market Size (2030) | USD 1.14 Billion |
| Growth Rate (2025 - 2030) | 14.30% CAGR |
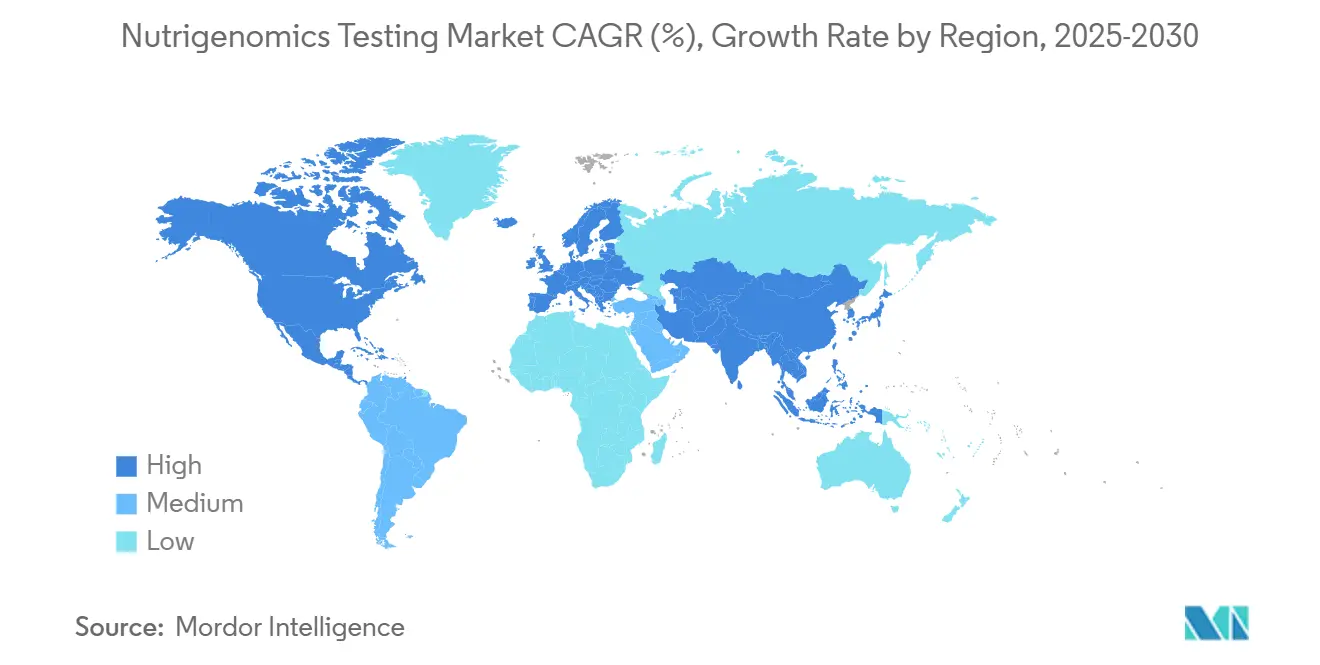
| Fastest Growing Market | Asia Pacific |
| Largest Market | North America |
| Market Concentration | Medium |
Major Players *Disclaimer: Major Players sorted in no particular order Image © Mordor Intelligence. Reuse requires attribution under CC BY 4.0. | |
Nutrigenomics Testing Market Analysis by Mordor Intelligence
The Nutrigenomics Testing Market size is estimated at USD 0.58 billion in 2025, and is expected to reach USD 1.14 billion by 2030, at a CAGR of 14.30% during the forecast period (2025-2030).
This trajectory reflects the rapid alignment of affordable sequencing technologies with consumer demand for food plans that address individual genetic risks. Declining genotyping costs, rising prevalence of obesity and diabetes, and wider clinical acceptance of DNA-guided meal planning are the primary tailwinds. Large employers now subsidize voluntary workplace genetic testing because early dietary intervention lowers downstream claims, while regulators are clarifying privacy rules that balance innovation and safety. Competitive rivalry is intensifying as service providers bundle genetic analysis with personalized coaching apps, meal-kit logistics, and corporate wellness dashboards that demonstrate tangible ROI.
Key Report Takeaways
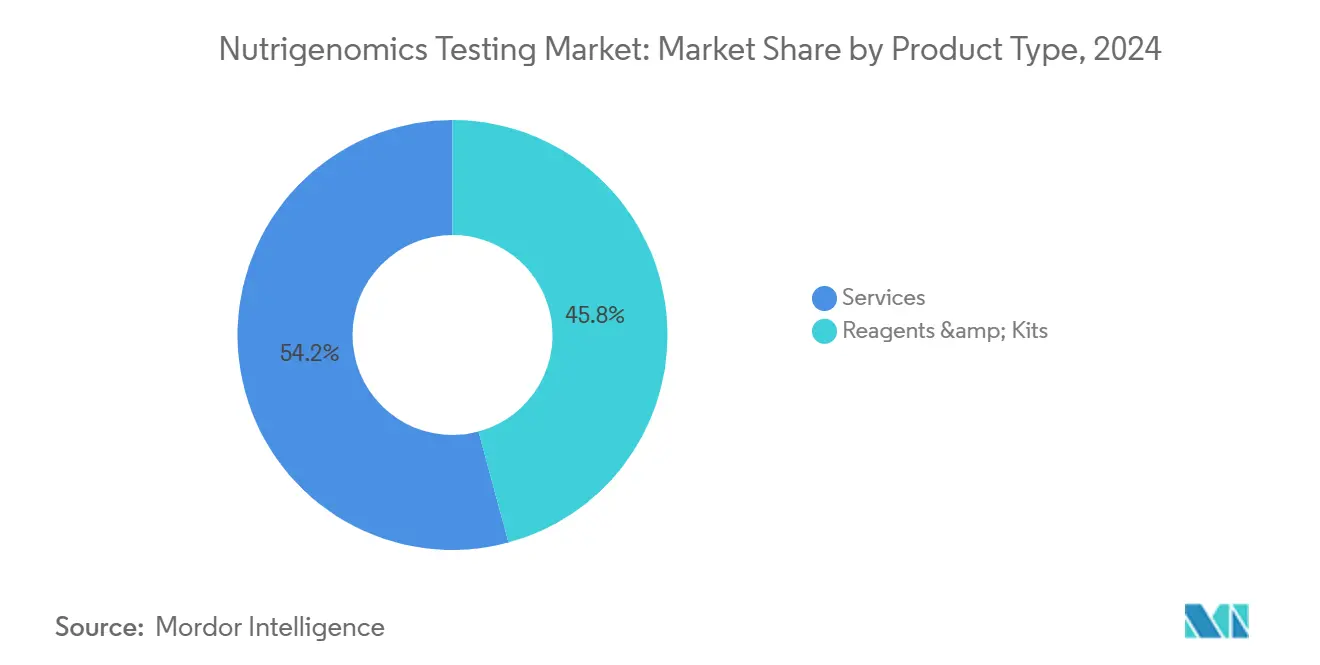
- By product type, the services segment held 54.2% of the nutrigenomics testing market share in 2024 and is projected to expand at a 12.7% CAGR through 2030.
- By sample type, saliva-based tests accounted for a 73.5% share of the nutrigenomics testing market size in 2024 and are expected to grow at a 11.3% CAGR to 2030.
- By technology, next-generation sequencing led with a 46.3% revenue share in 2024; microarray platforms are forecasted to record the fastest 13.2% CAGR through 2030.
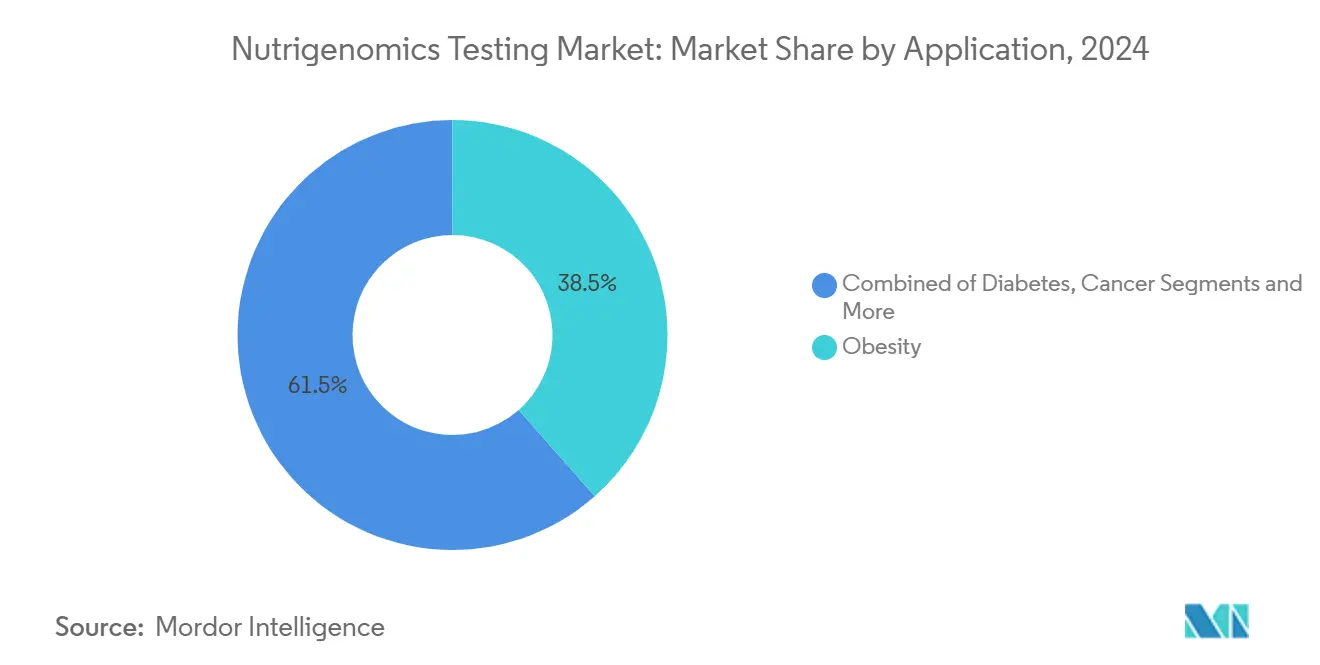
- By application, obesity management captured 38.5% of the nutrigenomics testing market share in 2024, whereas neurological health is poised to grow at a 12.0% CAGR through 2030.
- By distribution channel, direct-to-consumer services accounted for 62.6% of the nutrigenomics testing market size in 2024, while healthcare-provider channels are expected to exhibit a 11.3% CAGR to 2030.
- By geography, North America led with a 48.1% share of the target market in 2024, while Asia-Pacific is set to register the fastest growth at a 12.9% CAGR between 2025 and 2030.
Global Nutrigenomics Testing Market Trends and Insights
Drivers Impact Analysis*
| Driver | (~) % Impact on CAGR Forecast | Geographic Relevance | Impact Timeline |
|---|---|---|---|
| Rising Obesity & Diabetes Prevalence | 2.80% | Global, with concentration in North America & Europe | Medium term (2-4 years) |
| Shift Toward Preventive & Personalized Nutrition | 3.20% | North America & EU leading, APAC following | Long term (≥ 4 years) |
| Falling Genotyping Costs & NGS Adoption | 2.10% | Global, with faster adoption in developed markets | Short term (≤ 2 years) |
| Expanding DTC Genetic-Testing Distribution | 1.90% | North America & Europe core, expanding to APAC | Medium term (2-4 years) |
| Growth Of Corporate Wellness DNA Programs | 1.70% | North America leading, gradual EU adoption | Medium term (2-4 years) |
| Salivaomics Enabling At-Home Multi-Omics Panels | 1.50% | Global, with premium market focus initially | Long term (≥ 4 years) |
| Source: Mordor Intelligence | |||
Rising Obesity & Diabetes Prevalence
The escalating burden of metabolic disease is driving demand for precision nutrition programs that intervene before clinical onset. A multicenter trial led by Imperial College London showed that DNA-guided diets produced statistically significant improvements in 26-week glycemic control compared with standard dietary advice, underscoring clinical momentum toward genotype-matched meal plans.[1]Imperial College London, “DNA-Tailored Diets Improve Glycemic Control,” imperial.ac.uk Payers and hospital systems, therefore, view nutrigenomics as a cost-effective adjunct for populations genetically predisposed to insulin resistance. In 2024, the obesity application segment already contributed 38.5% to overall nutrigenomics testing market revenue, and provider-run weight-management clinics are embedding predictive gene panels into routine metabolic screening protocols.
Shift Toward Preventive & Personalized Nutrition
Consumers are abandoning one-size-fits-all diet fads in favor of DNA-informed recommendations that align with regional cuisines. Population-specific templates, such as the Genomex plan, tailored to Mexican dietary staples, demonstrate higher long-term adherence because they honor cultural food norms. Retail tie-ins are accelerating adoption: GenoPalate now embeds QR-coded recipe cards in Earth Fare grocery aisles so shoppers instantly retrieve allele-matched meal suggestions, converting abstract genetic data into a concrete buying guide. The nutrigenomics testing market, therefore, benefits from a virtuous loop in which cultural relevance boosts adherence, and adherence validates the genetic model.
Falling Genotyping Costs & NGS Adoption
Sequencing platforms such as Illumina NovaSeq X have cut library prep and run time, slashing per-sample expense below USD 100 in high-throughput labs.[3]Illumina Inc., “NovaSeq X Series: Shaping the Future of Multiomics,” illumina.com Lower cost unlocks large-scale preventive screening programs sponsored by insurers and public health agencies. Thermo Fisher’s Axiom PangenomiX microarray further complements NGS by delivering rapid population-wide pharmacogenomic panels at clinic-ready prices. As price drops, the nutrigenomics testing market expands beyond affluent early adopters into mainstream primary-care cohorts across Asia Pacific, which is already tracking a 12.9% regional CAGR.
Expanding DTC Genetic-Testing Distribution
Despite stricter consent rules, consumers still value convenience. The US Federal Trade Commission recently penalized several firms for overstated claims, yet reaffirmed that transparent, evidence-based reports remain permissible.[2]Federal Trade Commission, “FTC Takes Action Against Genetic-Testing Firms for Data-Security Failures,” ftc.gov Major providers responded by strengthening encryption and publishing peer-reviewed validation studies, which restored trust. Home-based saliva kits now bundle video genetic-counseling sessions, blurring the line between retail and clinical channels and helping direct-to-consumer sales preserve a 62.6% revenue share within the nutrigenomics testing market.
Restraints Impact Analysis*
| Restraint | (~) % Impact on CAGR Forecast | Geographic Relevance | Impact Timeline |
|---|---|---|---|
| Stringent Cross-Border Data-Privacy Regulations | -1.80% | EU leading, with global spillover effects | Short term (≤ 2 years) |
| Limited Reimbursement & High Out-Of-Pocket Costs | -2.30% | Global, with varying intensity by healthcare system | Medium term (2-4 years) |
| Low Clinician Confidence in Polygenic Diet Scores | -1.20% | North America & Europe primarily, emerging in APAC | Medium term (2-4 years) |
| Rising Counterfeit DNA-Kit Sales on E-Commerce | -0.90% | Global, with concentration in unregulated markets | Short term (≤ 2 years) |
| Source: Mordor Intelligence | |||
Stringent Cross-Border Data-Privacy Regulations
The European Health Data Space Regulation, published in March 2025, requires explicit consent and local storage for identifiable genomic data, raising compliance costs for firms that rely on centralized clouds Start-ups must now budget for sovereign data centers or seek third-party processors certified under the EU common security framework. Although the rules improve public trust, they slow multi-country trials and limit algorithm training on pan-European datasets, tempering the near-term growth rate of the nutrigenomics testing market in the region.
Limited Reimbursement & High Out-Of-Pocket Costs
Many insurers reimburse molecular tests only when linked to established therapeutic decisions. UnitedHealthcare’s 2025 update still classifies preventive nutrigenomic panels as investigational, shifting payment to consumers and capping uptake among lower-income groups. Providers, therefore, concentrate on employer-funded wellness programs where ROI is clearer, but broad clinical deployment awaits stronger cost-effectiveness studies and code-level coverage expansions.
*Our forecasts treat driver/restraint impacts as directional, not additive. The impact forecasts reflect baseline growth, mix effects, and variable interactions.
Segment Analysis
By Product Type: Services Drive Market Transformation
Services generated 54.2% of market share in 2024 because interpretation, coaching, and behavioral follow-up convert raw sequence data into measurable health outcomes. It underscores that value has migrated from kits to consultancy. As insurers demand outcome evidence, full-stack providers bundle dietitian chatbots, grocery integrations, and biometric feedback to retain users and expand lifetime value. Reagents and kits remain essential but commoditized; their unit prices fell by double digits in 2024 as automated library prep spread. Even so, reagent innovation continues—150-plus nutrition-relevant biomarkers are now validated under several newly issued patents, illustrating a pipeline that feeds the higher-margin services layer.
Second-tier providers attempt differentiation through specialized assay chemistry such as methylation profiling, but barriers rise because clinicians increasingly require clinical-grade ISO 15189 certification. Consequently, services revenue is forecast to advance at a 12.7% CAGR, roughly one percentage point ahead of the overall nutrigenomics testing market, whereas kit revenue will decelerate beyond 2027 as at-home devices saturate core demographics. The nutrigenomics industry therefore resembles broader diagnostics, where analytics and longitudinal engagement, not hardware, drive sustainable profit.


By Sample Type: Saliva Dominance Enables Innovation
Saliva tests accounted for 73.5% of 2024 revenue, thanks to painless mail-in collection, favorable stability, and consumer familiarity. That dominance supports a mature supply chain of bar-coded vials, cold-chain-free shipping, and automated extraction lines. Salivaomics platforms now layer metabolite and proteomic panels on top of genomic reads, allowing providers to upsell multi-omics bundles that enhance user retention. However, emerging physician-ordered blood panels are carving a clinical niche, particularly for high-risk cardiometabolic patients whose physicians prefer phlebotomy-grade accuracy. Blood testing accounted for 18% of the nutrigenomics testing market size for sample types in 2024, benefiting from seamless integration with existing laboratory information systems.
Buccal swab share hovers near single digits but remains popular in pediatrics and regions where exporting saliva samples faces customs barriers. Looking forward, hybrid protocols will combine saliva for genetic markers and dried-blood spots for dynamic biomarkers such as fatty-acid ratios, broadening analytical power without compromising convenience. As multi-omics adoption grows, saliva’s share may dilute modestly; yet, the absolute volume will continue to rise because first-time adopters will continue to favour the simplest kit.
By Technology: NGS Leadership Faces Microarray Challenge
Next-generation sequencing held 46.3% revenue share in 2024 due to comprehensive variant detection suitable for polygenic risk scoring. Advanced low-pass whole-genome protocols now generate 20× coverage in under 14 hours, compressing turnaround times to meet retail demand. Conversely, microarray systems have staged a comeback, clocking a 13.2% CAGR forecast, because targeted SNP panels meet many nutrigenomics use cases at lower prices. Thermo Fisher’s Axiom PangenomiX array, preconfigured with cardio-metabolic and nutritionally actionable loci, ships with an integrated AI caller that slashes analysis time to minutes.
PCR and single-tube SNP assays remain indispensable in sports-nutrition outlets that promote point-of-sale gene checks for lactase persistence or caffeine sensitivity. Yet their thin data yield constraints on upsell potential. Long term, cloud-based AI engines will blur the hardware battleground: algorithms that convert existing sequence files into diet recommendations become the main differentiator. Accordingly, intellectual-property battles are shifting from wet-lab chemistry toward proprietary recommendation models and phenotype-validated scoring matrices.
By Application: Obesity Focus Drives Clinical Validation
Obesity management monopolized 38.5% of the 2024 nutrigenomics testing market revenue because weight control delivers measurable, near-term ROI across payers, employers, and individuals. Gene-based diet frameworks target lipid metabolism, satiety signaling, and energy expenditure genotypes, providing individuals with personalized macronutrient ratios that achieve clinically significant fat loss without drastic calorie restriction. Diabetes prevention follows closely; polygenic risk stratification now guides carbohydrate periodization and fibre prescriptions that demonstrably flatten post-prandial glucose excursions.
Beyond metabolism, neuroscience laboratories are mapping nutrient-gene interactions that modulate neurotransmitter pathways, propelling neurological applications at a 12.0% CAGR. Early evidence suggests that personalized omega-3 dosing may lead to improved cognitive scores in APOE-ε4 carriers, indicating a potential pipeline of brain-health offerings. In oncology, research teams explore nutrigenomic adjuncts that optimize micronutrient status during chemotherapy; however, commercial traction remains nascent because clinical endpoints require long horizons. Cardiovascular use cases, including tailored sodium and phytosterol plans for hypertensive genotypes, gain traction in cardiac-rehabilitation clinics that integrate diet and pharmacogenomics into unified care plans.
By Distribution Channel: DTC Resilience Despite Challenges
Direct-to-consumer portals retained 62.6% of 2024 turnover because they meet millennials’ self-service expectations and cut physician wait times. Companies now couple raw genotype files with grocery-delivery vouchers and wearable-data integration, illustrating how digital ecosystems reinforce customer lock-in. Rising state privacy statutes require opt-in consent and granular data deletion options, but transparent players convert tighter rules into trust signals.
Clinical adoption is accelerating as hospital networks embed nutrigenomic consults into annual wellness checks. The healthcare-provider channel, though smaller, is on an 11.3% CAGR—faster than the nutrigenomics testing market average—because payers reimburse when interventions demonstrably curb metabolic costs. Corporate wellness programs form a hybrid path: employees mail saliva kits, receive diet plans through mobile dashboards, then share anonymized aggregate risk metrics with benefit managers seeking to reduce absenteeism. These blended routes enhance overall market liquidity and cushion regulatory shocks to any single channel.
Geography Analysis
North America captured 48.1% of 2024 global revenue through a combination of entrenched DTC pioneers, venture financing, and employer-funded wellness testing. The United States housed most high-throughput sequencing capacity, letting providers maintain 2-day kit-to-report cycles that sustain user engagement. Canada, while smaller, benefits from national nutrition programs exploring genome-informed dietary guidance, yet stringent data-sovereignty rules require domestic cloud hosting, adding cost layers. Mexico’s expanding middle class is adopting affordable microarray kits, though out-of-pocket payment patterns temper rapid penetration.
Asia Pacific remains the fastest-growing region with 12.9% CAGR. China’s national precision-medicine plan bankrolls genomics parks and state laboratories, accelerating clinician acceptance of nutrigenomic screening amid a rising diabetes epidemic. Japan capitalizes on an aging population predisposed to sarcopenia; enterprises market amino-acid-balanced diets adjusted for polymorphisms in muscle-protein-synthesis genes. India, armed with a robust IT workforce, rolls out affordable tele-nutrition packages based on locally validated gene panels that incorporate spice tolerance and vegetarian macro-distribution. South Korea, despite early DTC regulation, leverages advanced smartphone penetration to deliver AI-driven diet feedback, forging a template for digital integration.
Europe’s growth is moderate yet stable due to stringent but harmonized rules under the Health Data Space Regulation, which encourages cross-border research once firms clear consent hurdles. Germany invests in the Center for Medical Data Usability and Translation to route de-identified genomic datasets into public health projects, while France and Italy pilot supermarket loyalty cards linked to genotype-matched shopping suggestions. The United Kingdom, now outside EU law, experiments with sandbox approvals that let start-ups trial combined nutrigenomics and gut-microbiome panels inside the National Health Service innovation accelerator. Outside the top three regions, the Middle East, Africa, and Latin America present long-tail opportunities as sequencing costs fall and mobile payment systems mature, enabling leapfrog adoption of smartphone-based nutrition apps tethered to cloud genomics.

Competitive Landscape
The nutrigenomics testing market is moderately fragmented. Legacy DTC firms such as 23andMe remain household names but are diversifying into subscription-based meal planning to offset kit saturation. Mid-sized specialists like Nutrigenomix partner with academic labs to publish outcome studies that sway clinicians, while start-ups embed AI engines into smartphone apps delivering real-time grocery advice via barcode scans. Horizontal integration is rising: sequencing giants Illumina and BGI now license nutrition-specific variant panels to third-party service firms, capturing upstream revenue while avoiding direct-to-consumer regulatory exposure.
Competitive advantage increasingly hinges on data security. Firms that earn ISO/IEC 27001 certification advertise zero-knowledge encryption to reassure consumers after several high-profile breaches. Product pipelines are converging toward multi-omics: players integrate microbiome, metabolome, and continuous glucose monitoring streams for holistic advice, raising switching costs for users. Intellectual-property filings trend toward algorithmic recommendation patents rather than laboratory chemistries, signalling a shift in value capture. M&A activity is expected to intensify as incumbents acquire AI start-ups that specialize in nutrient-gene interaction modeling, accelerating time-to-market for next-gen coaching platforms.
Strategic moves over the past 18 months highlight this evolution. Illumina’s NovaSeq X launch slashed per-gigabase costs, enabling partners to drop retail kit prices without margin erosion. Thermo Fisher’s PangenomiX array targets national biobank contracts supporting nutrition-outcome studies. GenoPalate’s retail partnership with Earth Fare illustrates channel diversification beyond e-commerce into brick-and-mortar grocery. Genetic Technologies’ roll-out across 42 countries via telehealth aligns with cross-border care pathways now legitimized by the EU’s digital health passport. These actions reflect a playing field where technology prowess, regulatory fluency, and lifestyle-app integration jointly determine market position.
Nutrigenomics Testing Industry Leaders
Nutrigenomix
Gene by Gene
23andMe
Viome
GX Sciences
- *Disclaimer: Major Players sorted in no particular order


Recent Industry Developments
- May 2025: Rousselot unveiled Nextida GC collagen peptides targeting GLP-1 modulation for glucose control at Vitafoods Europe 2025, expanding functional-ingredient options for nutrigenomics programs.
- March 2025: The European Health Data Space Regulation entered into force, setting continent-wide rules for genomic data sharing and consent management.
- January 2025: UnitedHealthcare revised its Medicare Advantage molecular-pathology policy, broadening NGS coverage yet continuing to exclude routine preventive nutrigenomics panels.
- August 2024: Illumina announced a multi-omics growth strategy and introduced the NovaSeq X system, projecting an 18% CAGR addressable market expansion this decade.
- August 2024: Genetic Technologies launched the geneType risk-assessment portfolio on the EasyDNA platform across 42 countries, using telehealth to streamline clinician oversight.


Research Methodology Framework and Report Scope
Market Definitions and Key Coverage
Our study defines the nutrigenomics testing market as all laboratory-developed or at-home genetic assays distributed through clinical settings or direct-to-consumer kits that detect diet-responsive gene variants and translate them into personalized nutrition guidance for individuals.
Scope Exclusion: The valuation removes revenues from standalone dietary supplements, functional foods, and mobile diet-tracking apps that operate without a genetic test component.
Segmentation Overview
- By Product Type
- Reagents & Kits
- Services
- By Sample Type
- Saliva
- Buccal Swab
- Blood
- By Technology
- NGS-Based Testing
- Microarray
- PCR & SNP Genotyping
- By Application
- Obesity
- Diabetes
- Cancer
- Cardiovascular Disease
- Others
- By Distribution Channel
- Direct-to-Consumer
- Healthcare Providers
- Others
- By Geography
- North America
- United States
- Canada
- Mexico
- Europe
- Germany
- United Kingdom
- France
- Italy
- Spain
- Rest of Europe
- Asia Pacific
- China
- Japan
- India
- South Korea
- Australia
- Rest of Asia Pacific
- Middle East and Africa
- GCC
- South Africa
- Rest of Middle East and Africa
- South America
- Brazil
- Argentina
- Rest of South America
- North America
Detailed Research Methodology and Data Validation
Primary Research
Mordor analysts interviewed laboratory directors, nutrigenomics start-ups, registered dietitians, and corporate wellness managers across North America, Europe, and Asia-Pacific to confirm market penetration rates, average selling prices, and regulatory timelines. Follow-up surveys with genetic counselors refined test-repeat rates and consumer churn assumptions.
Desk Research
We began with publicly available health datasets such as WHO NCD Profiles, CDC NHANES, Eurostat disease-burden tables, and OECD Health Statistics, which outline obesity, diabetes, and diet-related prevalence shaping demand. Mordor analysts next reviewed portals from the Global Alliance for Genomics and Health and the Personalized Nutrition Coalition to obtain adoption metrics for next-generation sequencing and price curves.
To benchmark test volumes and price ranges across forty nations, our team mined company filings, investor presentations, trade-press releases, and patent abstracts using D&B Hoovers and Dow Jones Factiva. The sources cited are illustrative; numerous additional reputable references were consulted for data collection, validation, and clarification.
Market-Sizing & Forecasting
A top-down prevalence-to-demand model converts adult obesity, prediabetes, and performance-nutrition cohorts into an addressable test pool. It then applies region-specific uptake ratios validated in interviews. Select bottom-up checks, sampled kit shipments and averaged ASP × volumes, adjust totals where gaps emerge. Key inputs include sequencing cost per megabase, consumer DNA-testing awareness scores, employer wellness program coverage, and yearly regulatory approvals. Multivariate regression, informed by these variables, drives the 2025-2030 forecast; conservative penetration caps temper areas with sparse primary evidence.
Data Validation & Update Cycle
Outputs undergo variance checks against independent indicators, and anomalies trigger re-analysis before senior sign-off. Reports refresh annually, with interim updates for material events. Our team performs a final pass before delivery so clients receive the latest view.
Why Mordor's Nutrigenomics Testing Baseline Earns Global Decision Confidence
Published estimates often vary because some studies bundle microbiome or food-sensitivity panels, lock exchange rates, or apply uniform growth curves.
Mordor's disciplined scope selection, annual FX updates, and region-weighted uptake modeling reduce such distortions.
Benchmark comparison
| Market Size | Anonymized source | Primary gap driver |
|---|---|---|
| USD 585.6 million (2025) | Mordor Intelligence | |
| USD 519.9 million (2024) | Global Consultancy A | Broader scope includes microbiome kits; limited primary validation |
| USD 521.6 million (2024) | Regional Consultancy B | Uniform 17 % CAGR applied globally without obesity weighting |
| USD 650 million (2024) | Trade Journal C | Excludes clinical lab revenue; relies on self-reported DTC sales |
The comparison shows that Mordor Intelligence provides a balanced, transparent baseline tied to publicly traceable variables and disciplined refresh triggers, giving decision-makers a dependable figure for strategic planning.


Key Questions Answered in the Report
What is the current nutrigenomics testing market size in 2025?
The nutrigenomics testing market size reached USD 585.55 million in 2025 and is on course for USD 1.14 billion by 2030.
Which segment holds the largest nutrigenomics testing market share?
Services lead with 54.2% share because interpretation and counseling convert genetic data into actionable nutrition programs.
Why is saliva the dominant sample type for nutrigenomic testing?
Saliva kits capture 73.5% of revenue due to painless collection, stable transport, and compatibility with automated laboratory workflows.
How fast is the nutrigenomics testing market growing in Asia Pacific?
Asia Pacific posts the fastest regional CAGR at 12.9% through 2030, driven by public-sector genomics initiatives and rising chronic-disease awareness.
What regulatory change most impacts the nutrigenomics industry in 2025?
The European Health Data Space Regulation introduces strict consent and localization rules, raising compliance costs but unlocking cross-border research collaboration.
Page last updated on:


