Genomics Market Size and Share
Market Overview
| Study Period | 2020 - 2031 |
|---|---|
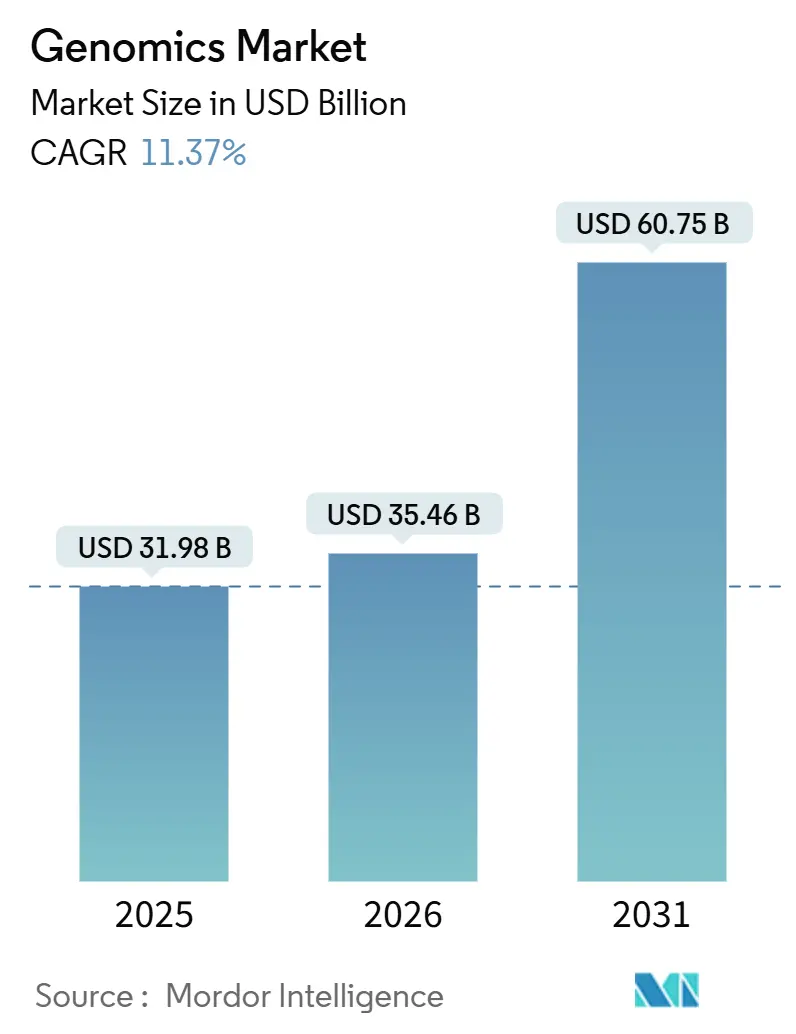
| Market Size (2026) | USD 35.46 Billion |
| Market Size (2031) | USD 60.75 Billion |
| Growth Rate (2026 - 2031) | 11.37% CAGR |
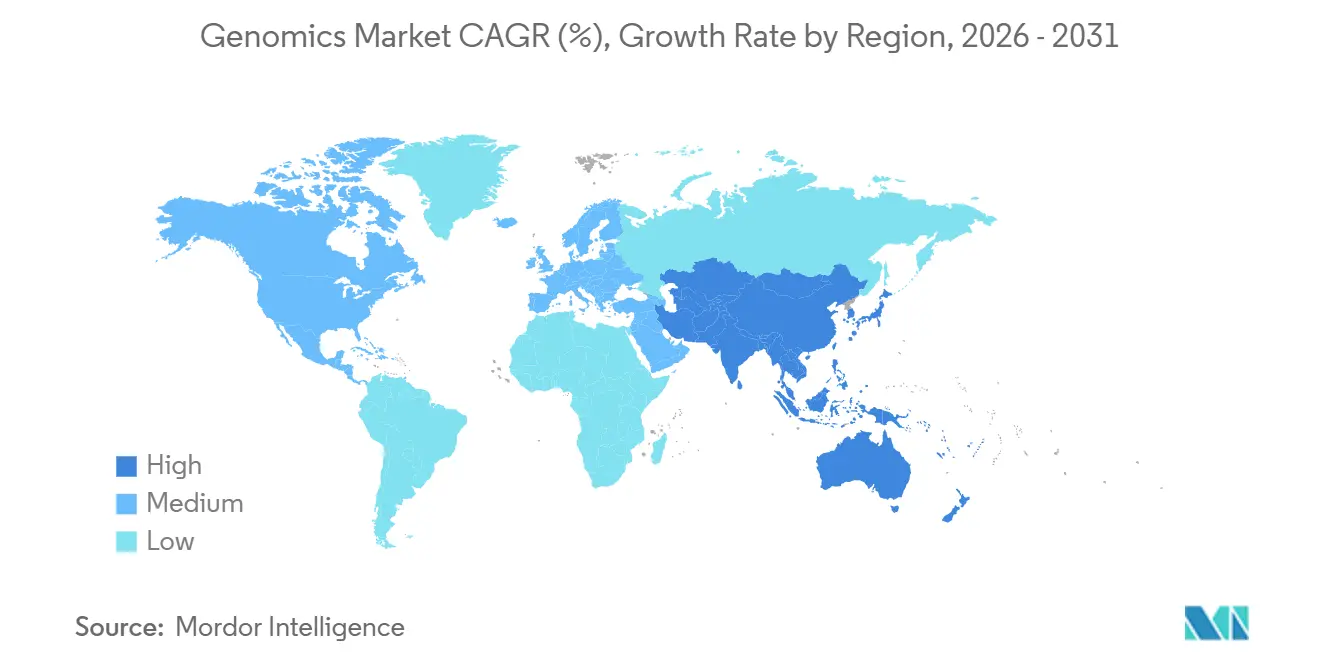
| Fastest Growing Market | Asia Pacific |
| Largest Market | North America |
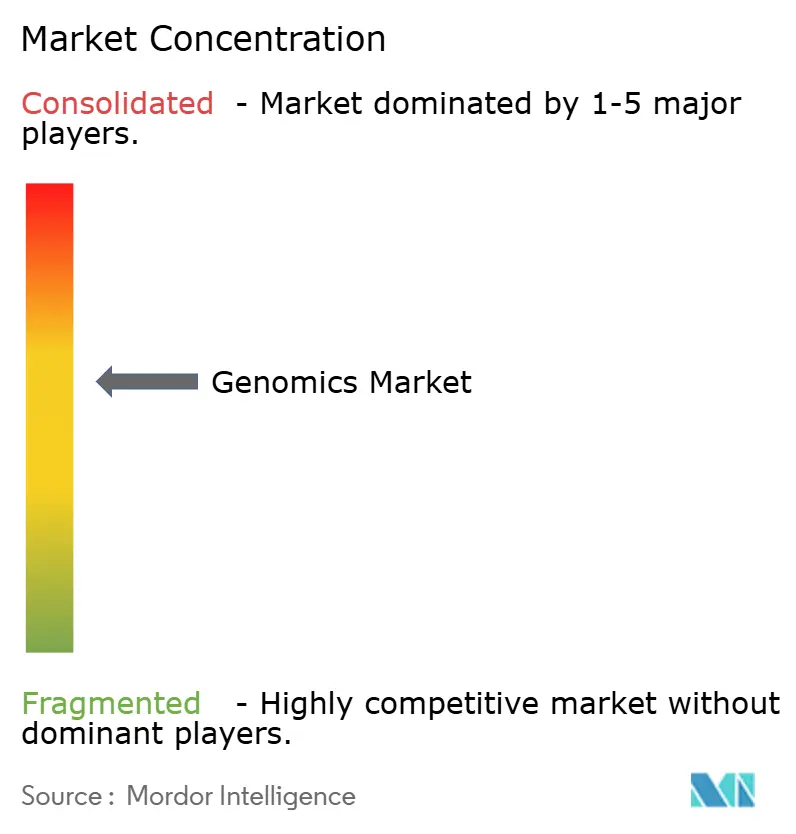
| Market Concentration | Medium |
Major Players *Disclaimer: Major Players sorted in no particular order Image © Mordor Intelligence. Reuse requires attribution under CC BY 4.0. | |
Genomics Market Analysis by Mordor Intelligence
The Genomics Market size is projected to be USD 31.98 billion in 2025, USD 35.46 billion in 2026, and reach USD 60.75 billion by 2031, growing at a CAGR of 11.37% from 2026 to 2031.
Demand accelerates because hospitals must install on-premises sequencers to comply with data-residency laws, a shift that increases instrument sales but fragments bioinformatics workflows[1]National Genomics Data Center, “China National Genomics Data Center,” ngdc.cncb.ac.cn. Falling per-genome costs, national mega-genome programs, and wider reimbursement for comprehensive genomic profiling strengthen purchasing intent across clinical and research settings[2]National Human Genome Research Institute, “DNA Sequencing Costs Data,” genome.gov . Long-read accuracy surpassing 99% unlocks complex structural-variant detection, enticing pharmaceutical companies that use these insights to de-risk gene-therapy pipelines. Meanwhile, artificial-intelligence initiatives convert multi-omic data into preventive digital-twin care models, nudging payers toward risk-based reimbursement. The genomics market also benefits from livestock breeders and public health agencies adopting low-pass sequencing for large-scale screening, further broadening the total addressable market.
Key Report Takeaways
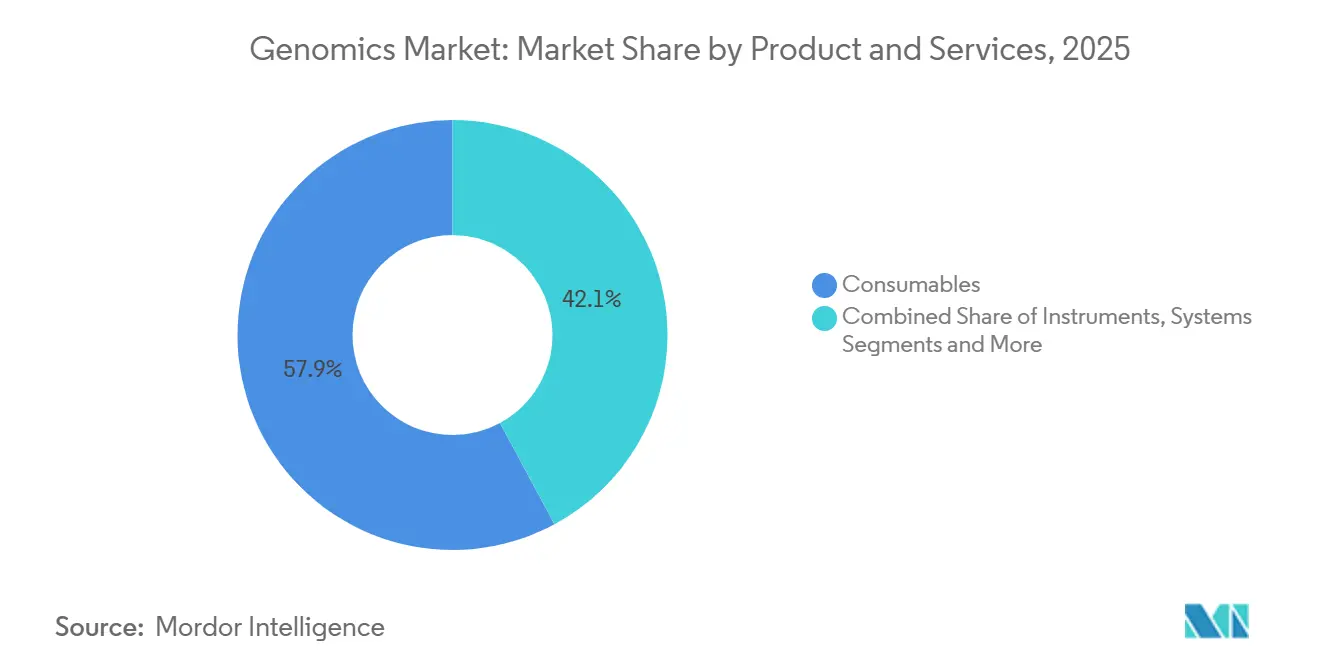
- By product & services, consumables led with 57.87% of the genomics market share in 2025. The instruments & systems segment is forecast to record the fastest growth, with a 12.05% CAGR through 2031.
- By technology, sequencing platforms accounted for 34.27% of the genomics market size in 2025. Long-read and single-molecule systems are projected to advance at a 13.78% CAGR to 2031.
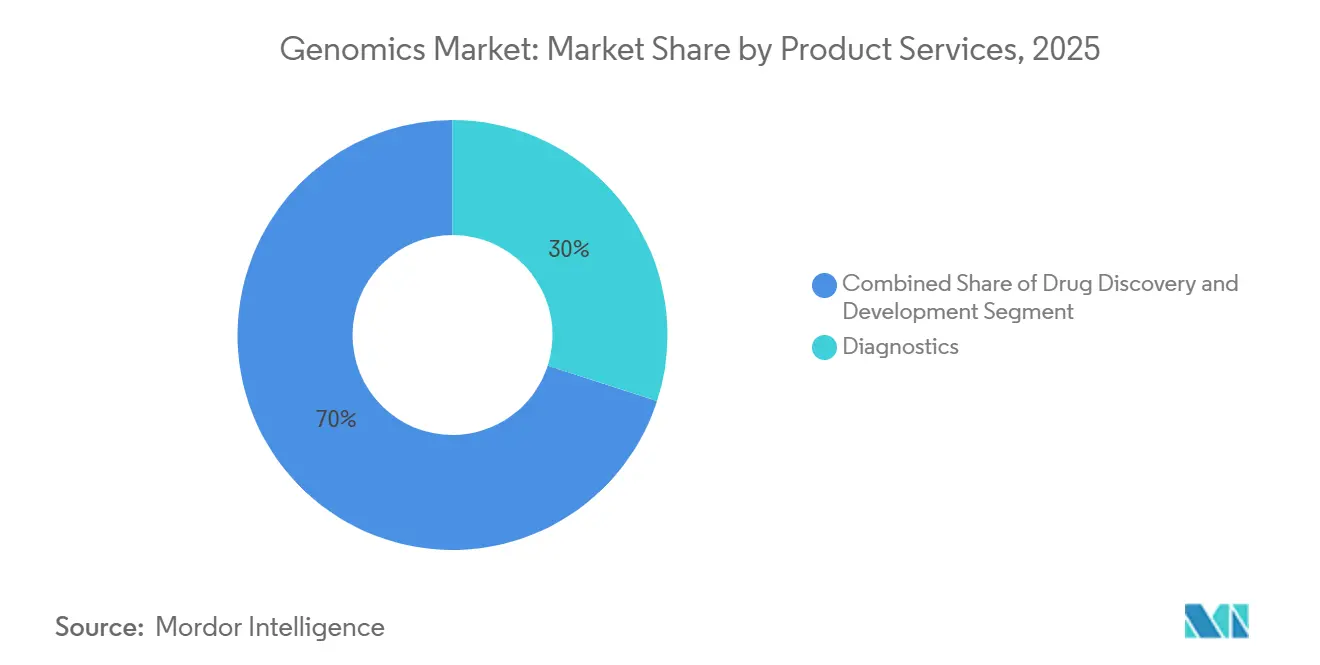
- By application, diagnostics accounted for 29.97% of revenue in 2025. Precision and personalized medicine are expected to post the highest CAGR at 12.26% through 2031.
- By end user, diagnostic and reference laboratories accounted for 34.41% of revenue in 2025. Pharmaceutical and biotechnology companies are anticipated to expand at a 10.86% CAGR over 2026-2031.
- North America dominated with a 41.45% stake in 2025, while Asia-Pacific is set to grow at a 12.14% CAGR through 2031.
Note: Market size and forecast figures in this report are generated using Mordor Intelligence’s proprietary estimation framework, updated with the latest available data and insights as of January 2026.
Global Genomics Market Trends and Insights
Drivers Impact Analysis
| Driver | (~) % Impact on CAGR Forecast | Geographic Relevance | Impact Timeline |
|---|---|---|---|
| Falling NGS Cost Curve Sustains Wider Adoption | +3.2% | Global, faster in APAC and Latin America | Medium term (2-4 years) |
| Government Mega-Genome Initiatives Scale Demand | +2.8% | North America, Europe, China, India, Japan | Long term (≥ 4 years) |
| AI-Ready Genomic Data Fuels Preventive Digital-Twin Care | +2.5% | North America, EU, pilots in Singapore and UAE | Medium term (2-4 years) |
| Long-Read and Linked-Read Platforms Unlock Hidden Variants | +2.1% | Global, concentrated in research institutes and pharma R&D | Short term (≤ 2 years) |
| Low-Pass WGS Plus Imputation Enables Population Screening | +1.6% | Core APAC, spill-over to MEA and South America | Medium term (2-4 years) |
| Clinical Oncology and Rare-Disease Reimbursement Expands | +2.4% | North America, Western Europe, Japan, Australia | Short term (≤ 2 years) |
| Source: Mordor Intelligence | |||
Falling NGS Cost Curve Sustains Wider Adoption
Sequencing a 30× whole genome costs less than USD 600 in 2025, 40% below 2022 levels, after manufacturers doubled flow-cell density to 48 samples per run. Indian and Brazilian hospitals now operate benchtop sequencers for carrier screening, shrinking turnaround from 21 days to 72 hours. Consumable vendors respond by selling reagents a la carte rather than proprietary cartridges. Lower costs also enable non-clinical projects; for example, New Zealand dairy breeders sequence 50,000 cattle genomes annually to optimize milk-protein yields.
Government Mega-Genome Initiatives Scale Demand
More than 8 million citizens had been enrolled in national genome projects by end-2025. The All of Us Research Program shifted 245,000 participants to long-read sequencing for superior haplotype phasing. Canada earmarked CAD 400 million for 500,000 genomes, insisting the data reside on domestic servers. Europe’s 1+ Million Genomes Initiative surpassed 1.2 million sequences, but GDPR Article 9 consent requirements slowed cross-border analytics. China has archived 3.2 million genomes while forbidding raw-file exports, spurring multinationals to mirror compute clusters locally. Japan budgeted JPY 30 billion in 2025 to feed tumor genomes into its cancer registry, priming real-world evidence pipelines.
AI-Ready Genomic Data Fuels Preventive Digital-Twin Care
The U.S. HHS set aside USD 150 million for the MAGen consortium, which pairs NIH datasets with pharmaceutical in-silico platforms[3]U.S. Department of Health and Human Services, “HHS Artificial Intelligence Strategic Plan 2024,” hhs.gov. Kaiser Permanente leveraged polygenic risk scores in 2025 to preemptively treat 12,000 members, slashing myocardial infarction incidence by 18%. Draft FDA guidance classifies AI-driven scores as regulated software and requires ancestry-stratified validation. Europe’s AI Act, effective January 2026, labels genomic digital twins high-risk, delaying EU launches by roughly 18 months.
Long-Read & Linked-Read Platforms Unlock Previously Hidden Variants
Oxford Nanopore’s Q20+ chemistry achieved 99.5% modal accuracy in 2025, matching short-read fidelity while preserving epigenetic marks. PacBio’s Revio system now processes 24 genomes per run at 15× coverage for USD 400 each, making structural-variant detection affordable for large studies. The Undiagnosed Diseases Network diagnosed 340 repeat-expansion cases by applying single-molecule reads. Pharmaceutical sponsors use long-read assays to map CRISPR off-target edits; the FDA now requires such validation in all genome-editing IND filings.
Restraints Impact Analysis
| Restraint | (~) % Impact on CAGR Forecast | Geographic Relevance | Impact Timeline |
|---|---|---|---|
| Genomic Data-Sovereignty Laws Constrain Cross-Border Workflows | -1.8% | China, Russia, EU, emerging in India and Brazil | Long term (≥ 4 years) |
| Skilled Bioinformatician & Genetic-Counselor Shortfall | -1.5% | Global, acute in North America and Western Europe | Medium term (2-4 years) |
| High Up-Front Sequencer & Reagent Capital Outlay | -1.2% | APAC, Latin America, MEA, rural hospital systems in developed markets | Short term (≤ 2 years) |
| Growing Scrutiny of Labs’ Plastic and Chemical Footprint | -0.9% | EU, California, early discussions in Japan and South Korea | Long term (≥ 4 years) |
| Source: Mordor Intelligence | |||
Genomic Data-Sovereignty Laws Constrain Cross-Border Workflows
China’s Personal Information Protection Law, effective November 2024, requires raw data to remain on mainland servers, compelling vendors to duplicate cloud clusters in Shanghai. Under GDPR Article 9, EU data may be transferred only to jurisdictions that are deemed adequate; the United States currently lacks that status. India’s draft Digital Personal Data Protection Act mirrors these restrictions, potentially stranding Genome India Project data in Bengaluru. A 2025 ISCB survey showed 62% of genomics startups shelved multi-country trials because localization costs exceeded USD 2 million per territory.
Skilled Bioinformatician & Genetic-Counselor Shortfall
NIH tallied 15,000 vacant bioinformatics posts in the United States and 8,000 in Europe at the end of 2025[4]National Institutes of Health, “Genomic Data Science Workforce Development,” genome.gov. Its USD 50 million workforce initiative will train 2,000 specialists by 2029, yet demand outpaces supply. Only 4,200 U.S. genetic counselors were certified in 2025 against a need for 7,500. Hospitals deploy chatbots for pre-screening, but German and French insurers still reject pharmacogenomics claims due to a shortage of counselors.
Segment Analysis
By Product & Services: Reagent Lock-In Sustains Consumables Dominance
Consumables captured a 57.87% slice of the genomics market in 2025 through proprietary reagent chemistries that secure recurring revenue. Services, however, are pacing at an 11.89% CAGR as drug developers outsource annotation and interpretation workloads. Illumina’s DRAGEN v4.3 cut variant-calling from 8 hours to 45 minutes, enabling labs to process 500 genomes daily on a single NovaSeq X. Instruments remain capital-intensive, yet Oxford Nanopore moved 340 PromethION 2 Solo units within Q1 2025 at USD 225,000 each.
Margins shift toward software as regulators require algorithmic transparency. FDA guidance issued in 2025 requires variant-interpretation engines to disclose the provenance of their training data and the accuracy stratified by ancestry. Hospitals embed LIMS links to electronic records, paring transcription errors that caused 120 adverse events in 2024. Sequencing-as-a-service flourishes in Asia-Pacific, where BGI’s pay-per-sample menu undercut Western bids by 30%, winning 18% of diagnostics volumes in 2025.
Note: Segment shares of all individual segments available upon report purchase
By Technology: Long-Read Sequencing Disrupts Short-Read Incumbency
Sequencing platforms accounted for 34.27% of the genomics market in 2025, but long-read chemistries are expanding at a 13.78% CAGR. Short-read stalwarts persist for targeted oncology panels, yet the inability to resolve copy-number and repeat expansions limits future relevance. Low-pass WGS now replaces arrays for polygenic risk at equivalent cost. Oxford Nanopore’s Q20+ chemistry matched 99.5% accuracy, bringing clinical compliance within reach, while PacBio’s Revio hit USD 400 per genome at 15× depth. Linked-read barcoding from 10x Genomics phases megabase haplotypes for USD 150 per sample, filling a budget gap. Extraction automation from QIAGEN trims hands-on time by 70%, though USD 80,000 system prices confine uptake to central labs.
By Application: Precision Medicine Outpaces Diagnostics Growth
Diagnostics accounted for 29.97% of revenue in 2025, propelled by NIPT and liquid biopsies. Precision and personalized medicine now lead growth, with a 12.26% CAGR, after CMS began paying USD 3,200 for comprehensive profiling, elevating FoundationOne CDx orders by 35% in 2025. Guardant360 CDx, cleared for 14 tumor types, trims treatment initiation by 12 days and extends median progression-free survival by 2.3 months in metastatic colorectal cancer. Drug developers rely on genomic endpoints; 42% of oncology Phase II trials filed in 2025 stratified by tumor-mutation burden. Agricultural applications also grow: USDA sequenced 120,000 cattle genomes in 2025 to reduce methane emissions by 15% per kilogram of milk.
By End User: Pharmaceutical R&D Drives Fastest Adoption
Diagnostic and reference laboratories accounted for 34.41% of 2025 revenue and pharmaceutical and biotech companies are growing at a 10.86% CAGR. Hospitals hesitate because capital budgets remain tight and Medicare coverage is uneven; 38% deferred new sequencers in 2025. AstraZeneca and Illumina’s 50,000-patient tumor genome project identified 14 drug targets in 2025. Eurofins processed outsourced annotation for 12 sponsors, slashing per-sample costs to USD 85.
Geography Analysis
North America commanded 41.45% of 2025 revenue as NIH funding, FDA clarity, and Medicare reimbursement converged. The United States processed 1.8 million clinical genomes in 2025, up 22% year-on-year, buoyed by NIPT and liquid-biopsy uptake. Canada invests CAD 400 million toward half a million genomes, enforcing domestic storage to satisfy federal privacy rules. Mexico remains constrained because only 12% of private insurers covered testing in 2025.
Europe sequenced 1.1 million clinical genomes through the 1+ Million Genomes Initiative, yet GDPR consent hurdles slow multi-country analytics. The NHS Genomic Medicine Service tested 85,000 cancer patients in 2025, cutting time-to-targeted therapy by 16 days. France reimburses BRCA1/2 testing but not polygenic scores, and German payers cover only 8 pharmacogenomic drug panels.
Asia-Pacific is forecast to outpace every region at a 12.14% CAGR. China stores 3.2 million genomes but prohibits the export of raw data, forcing multinationals to duplicate computing clusters. BGI’s DNBSEQ-T20×2 runs 40 genomes for USD 300 each, seizing 32% of China’s diagnostics segment in 2025. India cataloged 10,000 genomes, revealing variants absent in Western panels and informing newborn screening from 2026. Japan allocated JPY 30 billion to integrate tumor genomes with clinical outcomes, opening real-world evidence studies. South Korea and Australia broadened rare-disease coverage, dropping diagnostic odysseys to 18 months.
Competitive Landscape
The genomics market skews moderately concentrated. Illumina shipped more than 1,200 NovaSeq X units by late 2025, yet Oxford Nanopore and PacBio siphon structural-variant demand through improvements in long-read accuracy. Illumina acquired Complete Genomics’ linked-read patents in early 2025 to blunt 10x-Genomics’ Chromium advance. Thermo Fisher now bundles Ion Torrent sequencers with Applied Biosystems prep kits, promoting end-to-end lock-in.
White-space opportunities surface in low-pass WGS priced under USD 100, which could enable tuberculosis surveillance; CDC pilots portable sequencers in 12 state labs. Spatial-omics platforms add a new layer: 10x Genomics’ Visium HD maps gene expression at sub-cellular resolution, helping pharma visualize resistance niches. Software players such as SOPHiA GENETICS harness federated learning across 300 hospitals without moving raw data, skirting GDPR bottlenecks.
Compliance frameworks harden. ISO 15189 accreditation and the EU In Vitro Diagnostic Regulation, effective May 2025, impose documentation burdens that favor incumbents with mature quality systems. Vendors differentiate on throughput-accuracy curves and file-format openness; proprietary formats impede cross-platform analytics, nudging buyers toward open-standard adopters.
Genomics Industry Leaders
Agilent Technologies
F. Hoffmann-La Roche Ltd
PerkinElmer Inc.
QIAGEN N.V.
Thermo Fisher Scientific Inc.
- *Disclaimer: Major Players sorted in no particular order
Recent Industry Developments
- November 2025: PacBio and Berry Genomics obtained Class III Medical Device Registration for the Sequel II CNDx system from China’s NMPA.
- October 2025: Genomics Plc unveiled Mystra, an AI-enabled human-genetics platform designed to accelerate target discovery.
Research Methodology Framework and Report Scope
Market Definitions and Key Coverage
Our study defines the genomics market as the total revenue generated worldwide from consumables, instruments, software, and associated laboratory or analytical services used to sequence, map, edit, or interpret complete genomes across human, animal, plant, and microbial samples. We treat ancillary bioinformatics modules only when they are bundled with a genomic analysis workflow.
Scope Exclusion: we do not include standalone genetic counseling fees or purely cloud-based data-storage subscriptions that are sold without sequencing or wet-lab analysis components.
Segmentation Overview
- By Product & Services
- Consumables
- Reagents
- Kits
- Microplates
- Instruments & Systems
- NGS Platforms
- PCR Machines
- Microarray Scanners
- Software & Informatics
- Analysis Suites
- Laboratory Information Management Systems (LIMS)
- AI-Driven Decision Support
- Services
- Sequencing-as-a-Service
- Data Analysis
- Consulting
- Consumables
- By Technology
- Polymerase Chain Reaction (PCR)
- Sequencing (Short-Read NGS)
- Long-Read / Single-Molecule Sequencing
- Microarray
- Nucleic Acid Extraction & Purification
- Other Techniques
- By Application
- Diagnostics
- Drug Discovery & Development
- Precision / Personalized Medicine
- Agriculture & Animal Genomics
- Forensics & Ancestry
- Other Applications
- By End User
- Hospitals & Clinics
- Diagnostic & Reference Labs
- Research Institutes & Centers
- Pharmaceutical & Biotechnology Companies
- Other End Users
- By Geography
- North America
- United States
- Canada
- Mexico
- Europe
- Germany
- United Kingdom
- France
- Italy
- Spain
- Rest of Europe
- Asia-Pacific
- China
- India
- Japan
- Australia
- South Korea
- Rest of Asia-Pacific
- Middle East and Africa
- GCC
- South Africa
- Rest of Middle East and Africa
- South America
- Brazil
- Argentina
- Rest of South America
- North America
Detailed Research Methodology and Data Validation
Primary Research
We interviewed clinical geneticists, sequencing-platform product managers, lab procurement heads, and reimbursement specialists across North America, Europe, Asia-Pacific, and the Gulf region. These discussions helped us validate average run capacities, reagent refill cycles, service pricing spreads, and, crucially, future purchasing intentions that are not visible in public disclosures.
Desk Research
We begin with tier-one public datasets such as the National Human Genome Research Institute funding tracker, World Health Organization cancer registries, OECD Health Statistics, and customs shipment codes that flag next-generation sequencers; these establish baseline demand signals. We also mine patent families through Questel, review device clearances posted by the US FDA and the European Medicines Agency, and screen peer-reviewed studies archived on PubMed for technology adoption curves.
Our analysts then cross-check trade association updates (Genome Canada, European Biotechnology Association), company 10-Ks accessed via D&B Hoovers, and news flows aggregated in Dow Jones Factiva to sense check pricing shifts and expansion announcements before numbers reach the model. This list is illustrative; many other open and paid sources guided evidence gathering, validation, and clarification.
Market-Sizing & Forecasting
We rebuild the market top-down, starting with installed sequencer counts, reported run throughput (gigabases), and average price per human whole-genome equivalent, which are then multiplied to derive a demand pool; results are corroborated with supplier roll-ups of sampled ASP × volume and channel checks. Key variables include the number of reimbursed genomic tests per 1,000 population, government program spending on large-scale sequencing, average consumable cost per gigabase, share of clinical versus research runs, and annual launches of high-throughput platforms. A multivariate regression on these drivers produces the base forecast, while scenario analysis adjusts for regulatory or reimbursement shocks. Any bottom-up gaps, such as private lab volumes in emerging economies, are bridged with weighted regional proxies agreed during expert calls.
Data Validation & Update Cycle
We pass every quarterly refresh through variance and anomaly screens, compare outputs with external shipment tallies and funding releases, and then route the workbook for a two-step peer review before sign-off. Reports refresh once a year, with an interim update triggered by material events like a disruptive platform launch or a new national genome initiative.
Why Mordor's Genomics Baseline Inspires Confidence
We recognize that published estimates often diverge because firms frame genomics differently, pick varying base years, or lock in currency assumptions at dissimilar dates.
Key gap drivers include narrower product-only scopes, optimistic ASP inflation, or slower refresh cadences. Mordor's model captures services alongside products, refreshes annually, and converts revenues at contemporaneous exchange rates, so clients receive a balanced and current baseline.
Benchmark comparison
| Market Size | Anonymized source | Primary gap driver |
|---|---|---|
| USD 59.28 B (2025) | Mordor Intelligence | - |
| USD 37.89 B (2024) | Global Consultancy A | Excludes services and relies mainly on public company filings |
| USD 42.60 B (2024) | Market Data Firm B | Counts products only and applies one uniform price uplift across regions |
| USD 30.75 B (2024) | Industry Analyst C | Uses prior-year currency averages and omits new diagnostic uptake rates |
We believe the comparison shows that our disciplined scope choices, multi-source variable set, and timely updates deliver the most dependable baseline for strategic planning.
Key Questions Answered in the Report
What CAGR is forecast for the genomics market between 2026 and 2031?
The genomics market is expected to grow at a 11.37% CAGR over 2026-2031.
Which region will grow fastest through 2031?
Asia-Pacific is projected to register the highest regional CAGR at 12.14% on the back of national genome programs and local data-residency rules.
Why are long-read sequencing platforms gaining momentum?
Accuracy now exceeds 99%, enabling reliable structural-variant detection for gene-therapy trials and rare-disease diagnostics.
How large is the consumables segment today?
Consumables generated 57.87% of 2025 revenue, reflecting reagent lock-in on installed sequencers.
What is the key restraint on cross-border genomic data exchange?
Data-sovereignty laws in China, the EU, and several emerging markets prevent raw-data transfers, forcing redundant infrastructure investments.
Which end-user group is growing the quickest?
Pharmaceutical and biotechnology companies are advancing at a 10.86% CAGR as they embed genomics into clinical-trial design and drug discovery.


