Nuclear Magnetic Resonance Spectroscopy Market Size and Share
Market Overview
| Study Period | 2019 - 2030 |
|---|---|
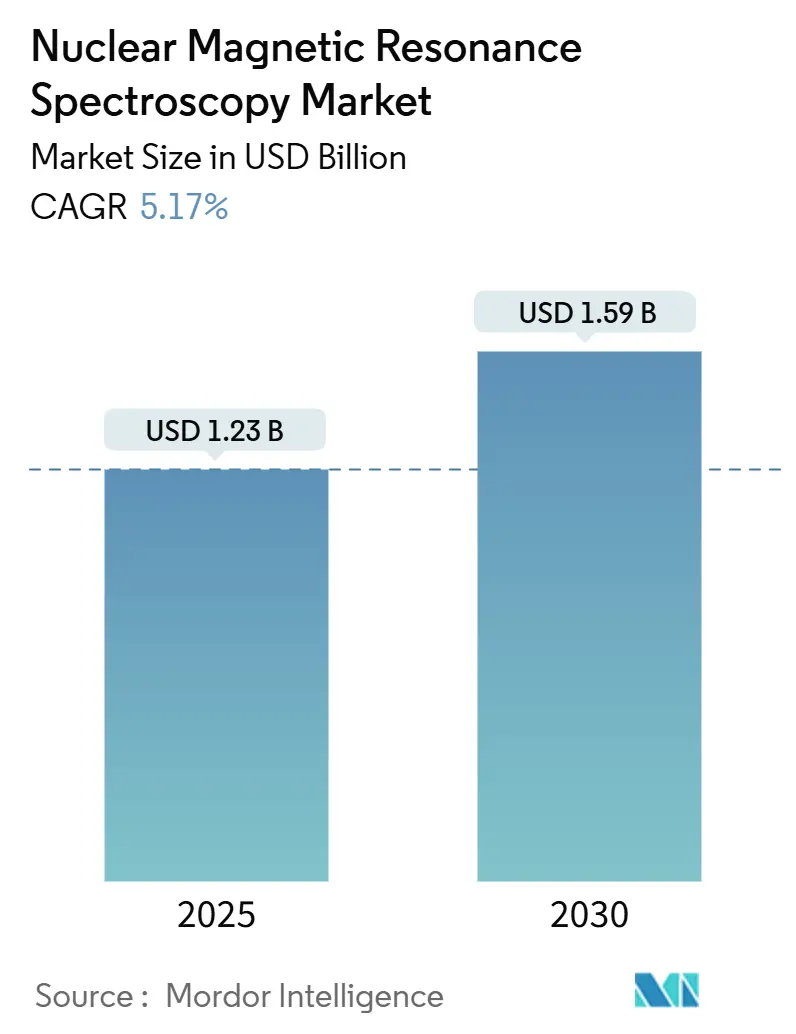
| Market Size (2025) | USD 1.23 Billion |
| Market Size (2030) | USD 1.59 Billion |
| Growth Rate (2025 - 2030) | 5.17% CAGR |
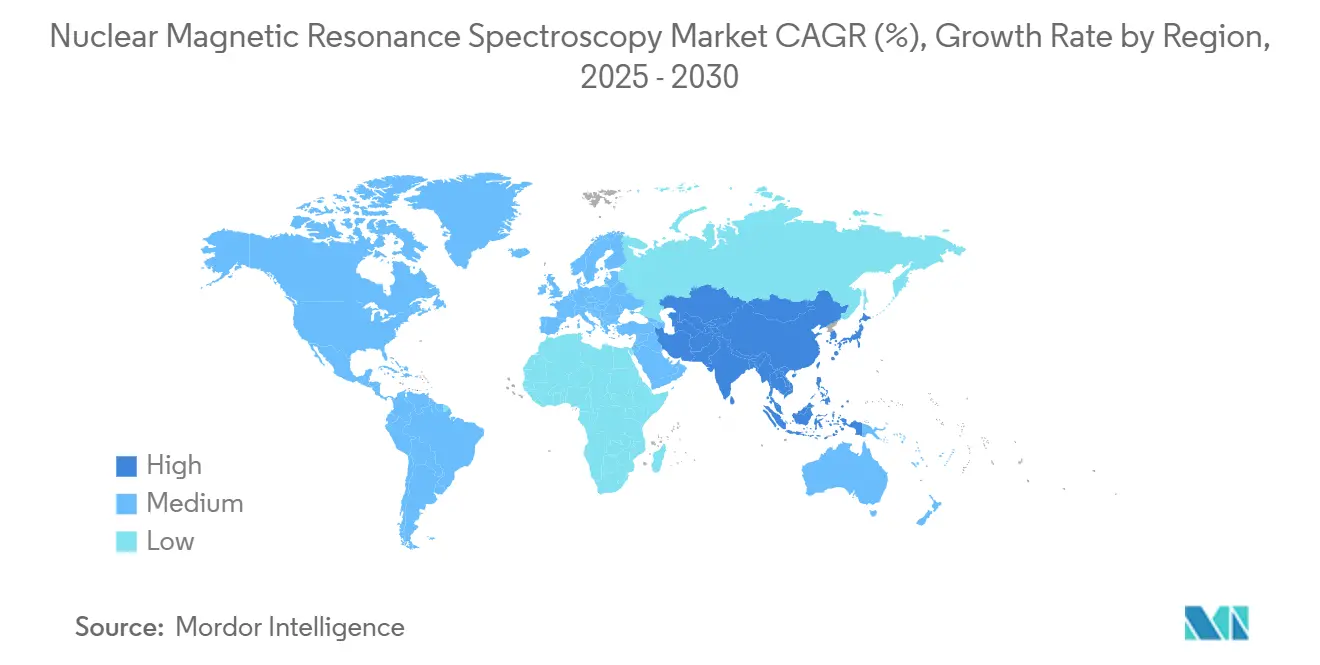
| Fastest Growing Market | Asia Pacific |
| Largest Market | North America |
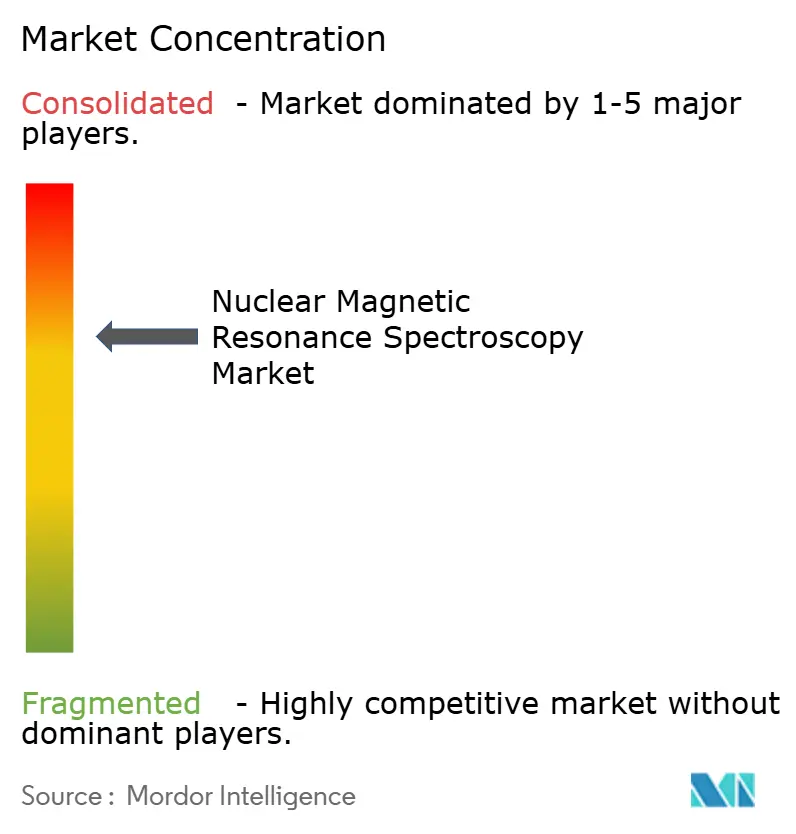
| Market Concentration | Medium |
Major Players
*Disclaimer: Major Players sorted in no particular order Image © Mordor Intelligence. Reuse requires attribution under CC BY 4.0. |
|
Nuclear Magnetic Resonance Spectroscopy Market Analysis by Mordor Intelligence
The nuclear magnetic resonance (NMR) spectroscopy market size stands at USD 1.23 billion in 2025 and is forecast to expand to USD 1.59 billion by 2030, translating to a 5.17% CAGR over the period. Continued pharmaceutical research spending, rapid growth in benchtop platforms, and rising demand for energy-storage analytics underpin this momentum. Major vendors now prioritize helium-free magnet designs, which shrink running costs and ease supply-chain risks. Artificial-intelligence software that automates peak picking and structure elucidation is driving laboratory productivity gains, while multi-nuclear probe innovations widen use cases in metabolomics, flow chemistry, and battery electrolyte monitoring. Collectively, these shifts redefine performance benchmarks, intensify software-centric competition, and open new customer pools in cost-sensitive settings.
Key Report Takeaways
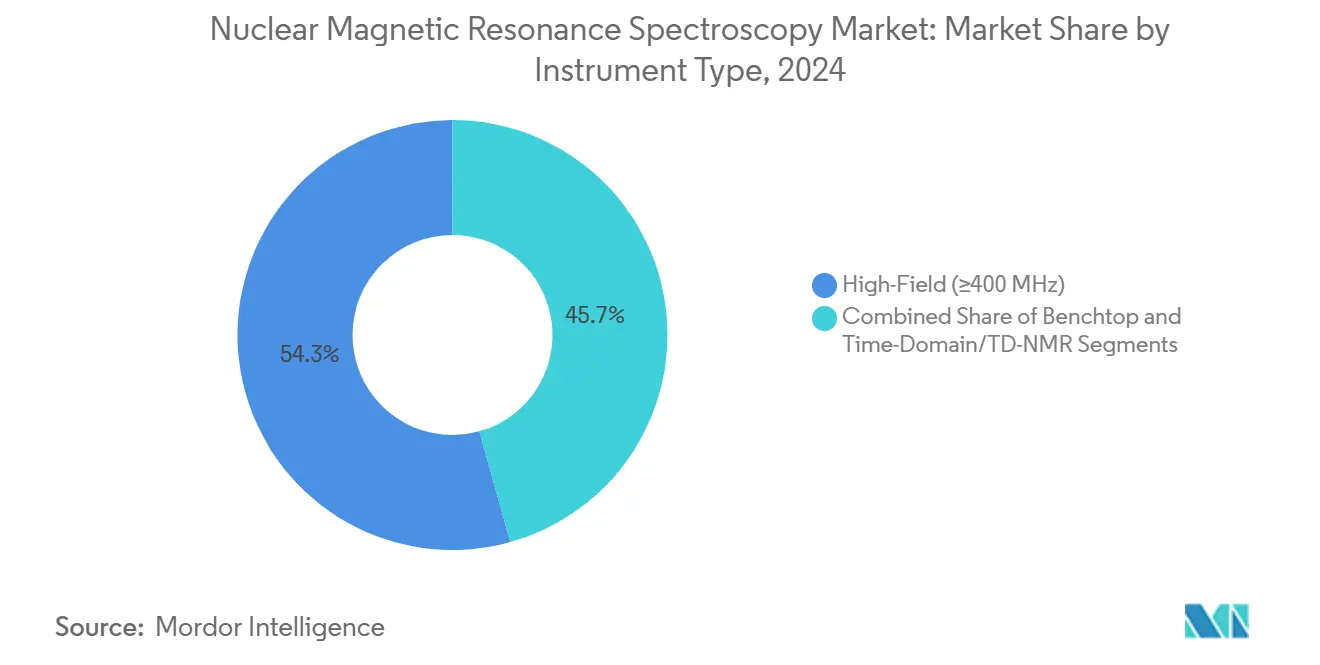
- High-field instruments (≥400 MHz) led with 54.33% of nuclear magnetic resonance (NMR) spectroscopy market share in 2024, while benchtop systems (<200 MHz) are on track for the fastest expansion at an 8.37% CAGR through 2030.
- Within the frequency spectrum, 400–600 MHz units commanded 42.34% revenue share in 2024; ultra-high-field 800 MHz–1.2 GHz systems are advancing at a 7.89% CAGR to 2030.
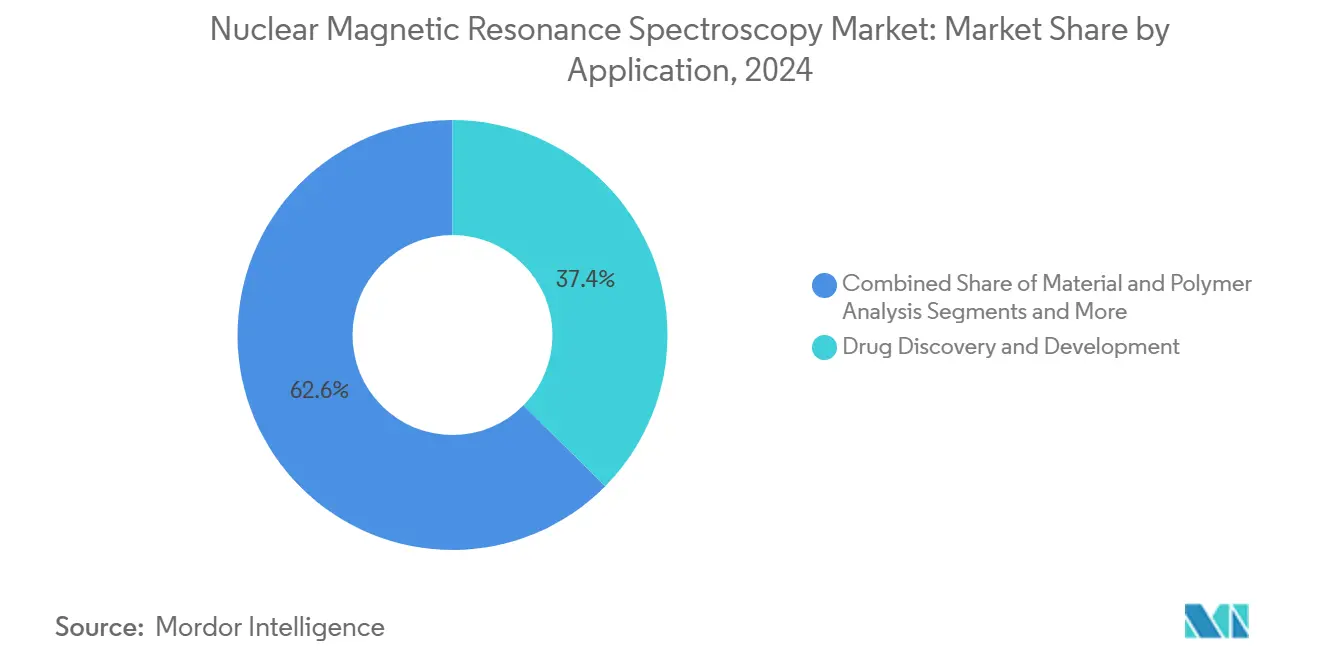
- By application, drug discovery and development held 37.42% of the nuclear magnetic resonance (NMR) spectroscopy market size in 2024, whereas energy and battery-electrolyte studies are projected to climb at a 9.24% CAGR over the same horizon.
- Pharmaceutical and biotechnology companies accounted for 44.38% of 2024 end-user revenue and represent the quickest-growing customer group with an 8.68% CAGR expected through 2030.
- Geographically, North America contributed 36.71% of 2024 sales, yet Asia-Pacific is poised for the sharpest upturn at an 8.37% CAGR by 2030.
Global Nuclear Magnetic Resonance Spectroscopy Market Trends and Insights
Drivers Impact Analysis*
| Driver | (~) % Impact on CAGR Forecast | Geographic Relevance | Impact Timeline |
|---|---|---|---|
| Technological advances in high-field & benchtop systems | +1.2% | North America & Europe | Medium term (2-4 years) |
| Expanding pharma-biotech R&D spend | +0.8% | North America, Europe, Asia-Pacific | Long term (≥ 4 years) |
| Surge in metabolomics & precision-medicine programs | +0.9% | Developed markets | Medium term (2-4 years) |
| AI-driven automation of data interpretation | +0.7% | Global tech-forward regions | Short term (≤ 2 years) |
| Helium-free magnets & gas recycling | +0.6% | Helium-scarce regions | Medium term (2-4 years) |
| Real-time process monitoring for flow chemistry & batteries | +0.5% | Asia-Pacific, North America | Short term (≤ 2 years) |
| Source: Mordor Intelligence | |||
Technological Advances in High-Field & Benchtop Systems
Revolutionary magnet architectures eliminate cryogens, trimming operating costs by up to 60% compared with legacy superconducting units.[1]Sandeep Kumar, “Exploring Magnetocaloric Materials for Sustainable Refrigeration near Hydrogen Gas Liquefaction Temperature,” Advanced Functional Materials, wiley.com Benchtop models now reach 100 MHz with permanent magnets, letting teaching labs, pilot plants, and QC suites perform routine assays that once required specialist facilities. Cryogen-free cooling alleviates helium scarcity, while compact footprints fit standard fume hoods. These gains widen access without sacrificing spectral fidelity, particularly for small-molecule analysis and polymer QC.
Expanding Pharma-Biotech R&D and Drug-Discovery Spend
Resilient research budgets keep the nuclear magnetic resonance (NMR) spectroscopy market on a steady growth path. Quantitative NMR methods validated by pharmacopeias allow direct potency and impurity testing without external standards. Protein-folding studies and formulation screens rely on the technique’s non-destructive nature, supporting biologics innovation even when macroeconomic conditions tighten. Long development cycles further lock NMR into discovery pipelines.
Surge in Metabolomics & Precision-Medicine Programs
Global biomarker initiatives require fast, reproducible profiling of complex biofluids. High-throughput NMR workstations process hundreds of samples daily, aided by vast reference-shift libraries holding more than 11 million entries.[2]Jeffrey Hoch, “Biological Magnetic Resonance Data Bank,” Oxford Academic, oxfordacademic.comHospitals and academic centers invest in dedicated metabolomics cores to stratify patients and monitor therapeutic response, anchoring long-term equipment demand.
AI-Driven Automation Lowering the Skill Barrier
Deep-learning models such as DeepSAT extract atom-level structures from 2D spectra faster than manual analysis.[3]Hyun Woo Kim, “DeepSAT: Learning Molecular Structures,” springeropen.comTraining datasets exceeding 143,000 spectra boost accuracy, enabling laboratories with limited expertise to obtain publication-grade results in minutes. Automation addresses the spectroscopist shortage and elevates throughput, cementing AI as a core differentiator among instrument vendors.
Restraints Impact Analysis*
| Restraint | (~) % Impact on CAGR Forecast | Geographic Relevance | Impact Timeline |
|---|---|---|---|
| High upfront & maintenance costs of superconducting NMR | -0.4% | Emerging markets | Long term (≥ 4 years) |
| Shortage of trained spectroscopists | -0.3% | Developing regions | Medium term (2-4 years) |
| Rare-earth & HTS-wire supply-chain risks | -0.2% | Non-producing regions | Short term (≤ 2 years) |
| Data-format non-standardization | -0.1% | Research institutions | Short term (≤ 2 years) |
| Source: Mordor Intelligence | |||
High Upfront & Maintenance Costs of Superconducting NMR
Capital investments remain a hurdle for universities and small enterprises. Helium price swings add operating uncertainty, while aging fleets need costly service contracts. Shared-facility models and benchtop adoption partially mitigate, yet performance trade-offs persist for complex structure elucidation.
Shortage of Trained NMR Spectroscopists
Retirement of senior experts and limited hands-on exposure in curricula constrain talent supply. Salary escalation and retention issues affect industrial labs, whereas academia forms user groups to pool knowledge. AI aids routine work, but method development still needs expert oversight.
*Our forecasts treat driver/restraint impacts as directional, not additive. The impact forecasts reflect baseline growth, mix effects, and variable interactions.
Segment Analysis
By Instrument Type: Benchtop Units Redefine Accessibility
High-field systems (≥400 MHz) kept 54.33% of the nuclear magnetic resonance (NMR) spectroscopy market share in 2024, underscoring their role in structural-biology and high-resolution small-molecule work. Benchtop platforms running on permanent magnets are scaling at an 8.37% CAGR to 2030, eroding the install-base dominance once enjoyed by superconducting instruments. The nuclear magnetic resonance (NMR) spectroscopy market size tied to benchtop sales is widening as price points dip below USD 100,000, allowing quality-control labs and teaching facilities to bring spectroscopy in-house. Time-domain NMR occupies a smaller but stable niche, prized for rapid moisture and polymer assessments where speed outweighs ultra-high resolution.
Permanent-magnet advances now deliver 100 MHz field strength without cryogens, cutting operating costs and sidestepping helium supply shocks. Vendors bundle AI-driven spectral analysis to flatten learning curves for first-time users, while modular probe designs let operators swap nuclei in minutes. Shared research centers continue to buy high-field units for cutting-edge methods, yet they increasingly pair them with benchtop companions for routine assays. Collectively, these trends tilt procurement toward mixed fleets that balance performance, throughput, and lifecycle cost.


By Frequency Range: Mid-Field Remains the Workhorse
Systems in the 400–600 MHz band captured 42.34% of 2024 revenue because they offer the best mix of sensitivity, resolution, and serviceability. Ultra-high-field 800 MHz–1.2 GHz models are accelerating at a 7.89% CAGR, driven by difficult protein-complex projects and metabolomics that need maximal dispersion. The 300–400 MHz class appeals to budget-conscious labs upgrading from benchtop gear, while 600–800 MHz units cater to specialized natural-product and carbohydrate analyses.
Manufacturers have shifted R&D toward coil stability and chilled probe technology rather than ever-higher field strengths, signaling maturation in premium tiers. Multi-nuclear probes covering ¹H, ¹⁹F, ¹³C, and ²H in a single housing broaden experimental menus without extra hardware. That versatility helps preserve the nuclear magnetic resonance (NMR) spectroscopy market size in the mid-field category even as ultra-high-field installations grow. Meanwhile, dry-magnet options in the 300–400 MHz window give smaller labs a route to higher resolution without cryogenic upkeep.
By Application: Energy-Storage Analytics Gains Speed
Drug-discovery and development retained 37.42% of nuclear magnetic resonance (NMR) spectroscopy market size in 2024, cementing its place as the largest revenue contributor. Operando electrolyte studies for lithium-ion-battery R&D are the fastest climber at a 9.24% CAGR, reflecting global urgency around energy storage. Metabolomics platforms serve precision-medicine programs that rely on standardized, high-throughput profiling of serum and urine. Material and polymer R&D uses relaxation-time data and diffusion coefficients to optimize mechanical traits, while food-authenticity checks leverage quick ¹H scans to flag adulteration.
Flow-chemistry integration is turning NMR into an inline process-control sensor that verifies reaction conversions in real time, shrinking batch times and waste. Automated quantitation modules enable impurity tracking in active pharmaceutical ingredients without external references. These advances expand the nuclear magnetic resonance (NMR) spectroscopy market share of non-pharma applications and diversify vendor revenue streams. Laboratory managers now see one instrument spanning small-molecule, material, and biofluid tasks, boosting utilization rates and shortening payback periods.
By End-User: Pharma–Biotech Leads, Academia Holds Depth
Pharmaceutical and biotechnology companies held 44.38% of 2024 spending and are advancing at an 8.68% CAGR through 2030, underpinning the largest slice of nuclear magnetic resonance (NMR) spectroscopy market share. Their demand centers on structure–activity studies, impurity profiling, and biologics formulation, all of which mandate reproducible, high-field data. Academic and research institutes remain the backbone for methodological innovation, often running multi-console suites that include 600 MHz or higher magnets.
Chemical and petrochemical firms deploy NMR for polymer verification and catalyst monitoring, valuing its non-destructive insights into chain length and branching. Food-and-beverage processors increasingly choose benchtop units for authenticity and contamination checks, attracted by low maintenance and rapid turnaround. Regulatory harmonization in China and ICH markets is compelling both drug makers and universities to modernize legacy equipment, sustaining the nuclear magnetic resonance (NMR) spectroscopy market size across user groups. The mix of frontline discovery, routine QC, and academic exploration creates a balanced customer portfolio that buffers vendors against single-sector downturns.
Geography Analysis
North America controlled 36.71% of 2024 revenue thanks to dense biotech clusters and mature academic infrastructure. Nonetheless, helium supply shifts set the stage for dry-magnet acceleration. Canada’s exploration efforts may diversify future supply, yet commercialization timelines remain uncertain.
Asia-Pacific is the fastest-growing territory at 8.37% CAGR through 2030. China’s 2025 Pharmacopoeia and broader ICH alignment drive mandatory analytical upgrades. Semiconductor expansion in South Korea and battery-research surges across Japan add demand for specialized materials characterization. India’s cost-sensitive pharma manufacturers favor benchtop options, broadening the nuclear magnetic resonance (NMR) spectroscopy market footprint regionally.
Europe balances long-standing pharma hubs with food-safety applications prompted by stringent regulations. Sustainability mandates spur helium-free adoption while Germany’s chemicals sector relies on in-line NMR for process QA. The UK’s university network safeguards high-field investment even amid funding transitions.

Competitive Landscape
The market shows moderate concentration as multinationals like Bruker, JEOL, and Thermo Fisher integrate AI software and service portfolios to lock customers into ecosystems. Bruker’s EUR 870 million ELITech acquisition extends diagnostics reach, while its helium-free HelioSmart system responds to cost and supply concerns. Smaller innovators such as Magritek and Nanalysis carve niches in benchtop segments with compact, application-tuned hardware. Software-centric differentiation intensifies as vendors embed cloud-based analysis suites and automated peak-assignment engines.
Service quality emerges as a battlefield amid legacy-system maintenance hurdles. Third-party refurbishers capitalize on OEM spare-part discontinuation, creating parallel support networks that can sway purchasing decisions. Intellectual-property filings around specialized applications like clotting-time monitoring reflect expanding vertical opportunities.
Nuclear Magnetic Resonance Spectroscopy Industry Leaders
-
Bruker Corporation
-
JEOL Ltd.
-
Thermo Fisher Scientific Inc.
-
Oxford Instruments plc
-
Nanalysis Scientific Corp.
- *Disclaimer: Major Players sorted in no particular order

Recent Industry Developments
- July 2025: Nanalysis Scientific published the first pharmacopeial-certified benchtop NMR assay for hydroxypropyl betadex.
- April 2025: Bruker introduced the Fourier 80 “Multi-Talent” benchtop FT-NMR spectrometer, adding multinuclear capability to permanent-magnet platforms.
- March 2025: Nanalysis released a 60 MHz benchtop unit built on its next-generation architecture at Pittcon 2025.


Global Nuclear Magnetic Resonance Spectroscopy Market Report Scope
| High-Field (≥400 MHz) |
| Benchtop (<200 MHz) |
| Time-Domain/TD-NMR |
| 300–400 MHz |
| 400–600 MHz |
| 600–800 MHz |
| 800–1.2 GHz |
| Drug Discovery & Development |
| Metabolomics & Biomarker Research |
| Material & Polymer Analysis |
| Food & Agriculture QA/QC |
| Energy & Battery Electrolytes |
| Pharmaceutical & Biotechnology Companies |
| Academic & Research Institutes |
| Chemical & Petrochemical Industry |
| Food & Beverage Industry |
| North America | United States |
| Canada | |
| Mexico | |
| Europe | Germany |
| United Kingdom | |
| France | |
| Italy | |
| Spain | |
| Rest of Europe | |
| Asia-Pacific | China |
| Japan | |
| India | |
| Australia | |
| South Korea | |
| Rest of Asia-Pacific | |
| Middle East and Africa | GCC |
| South Africa | |
| Rest of Middle East and Africa | |
| South America | Brazil |
| Argentina | |
| Rest of South America |
| By Instrument Type | High-Field (≥400 MHz) | |
| Benchtop (<200 MHz) | ||
| Time-Domain/TD-NMR | ||
| By Frequency Range | 300–400 MHz | |
| 400–600 MHz | ||
| 600–800 MHz | ||
| 800–1.2 GHz | ||
| By Application | Drug Discovery & Development | |
| Metabolomics & Biomarker Research | ||
| Material & Polymer Analysis | ||
| Food & Agriculture QA/QC | ||
| Energy & Battery Electrolytes | ||
| By End-user | Pharmaceutical & Biotechnology Companies | |
| Academic & Research Institutes | ||
| Chemical & Petrochemical Industry | ||
| Food & Beverage Industry | ||
| By Geography | North America | United States |
| Canada | ||
| Mexico | ||
| Europe | Germany | |
| United Kingdom | ||
| France | ||
| Italy | ||
| Spain | ||
| Rest of Europe | ||
| Asia-Pacific | China | |
| Japan | ||
| India | ||
| Australia | ||
| South Korea | ||
| Rest of Asia-Pacific | ||
| Middle East and Africa | GCC | |
| South Africa | ||
| Rest of Middle East and Africa | ||
| South America | Brazil | |
| Argentina | ||
| Rest of South America | ||


Key Questions Answered in the Report
How large is the nuclear magnetic resonance (NMR) spectroscopy space in 2025?
The nuclear magnetic resonance (NMR) spectroscopy market size is valued at USD 1.23 billion in 2025.
What is the expected growth rate to 2030?
The market is forecast to register a 5.17% CAGR, reaching USD 1.59 billion by 2030.
Which instrument class is growing fastest?
Benchtop systems are expanding at an 8.37% CAGR thanks to helium-free permanent magnets and lower infrastructure demands.
Which application is emerging most rapidly?
Energy and battery electrolyte analysis is the fastest-growing segment, advancing at a 9.24% CAGR through 2030.
Why are helium-free magnets important?
They eliminate volatile helium costs and supply risks, cutting operating expenses by up to 60% and improving sustainability.
Which region offers the highest expansion potential?
Asia-Pacific leads with an 8.37% CAGR, propelled by China’s regulatory reforms and booming semiconductor manufacturing.
Page last updated on:


