
NTRK Fusion Gene Positive Advanced Solid Tumor Market Size and Share
Market Overview
| Study Period | 2020 - 2031 |
|---|---|
| Market Size (2026) | USD 460.82 Million |
| Market Size (2031) | USD 597.73 Million |
| Growth Rate (2026 - 2031) | 5.34 % |
| Fastest Growing Market | Asia Pacific |
| Largest Market | North America |
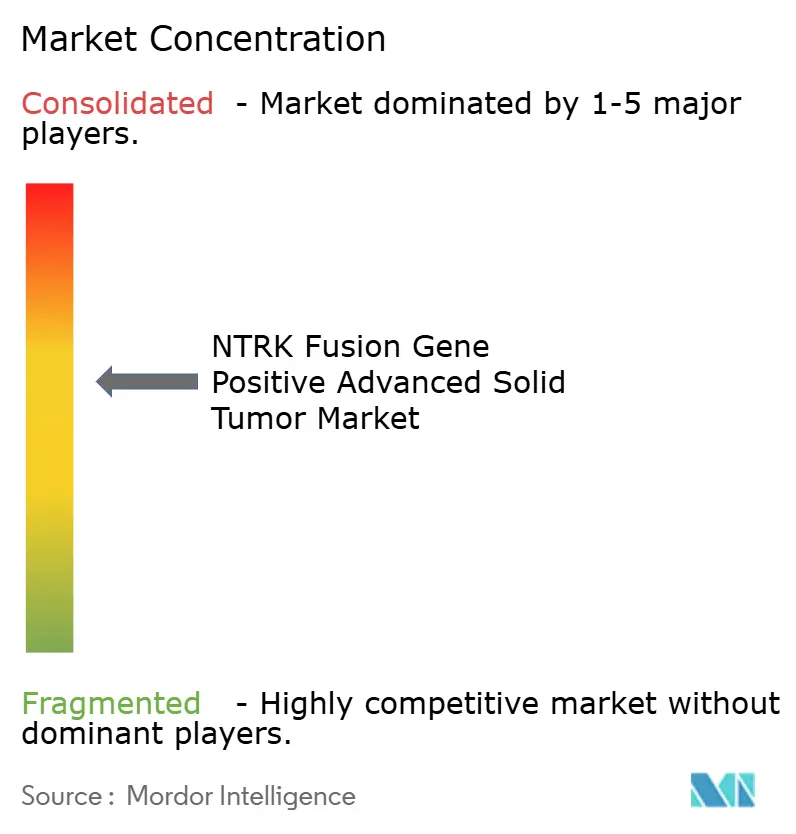
| Market Concentration | Medium |
Major Players *Disclaimer: Major Players sorted in no particular order Image © Mordor Intelligence. Reuse requires attribution under CC BY 4.0. | |
NTRK Fusion Gene Positive Advanced Solid Tumor Market Analysis by Mordor Intelligence
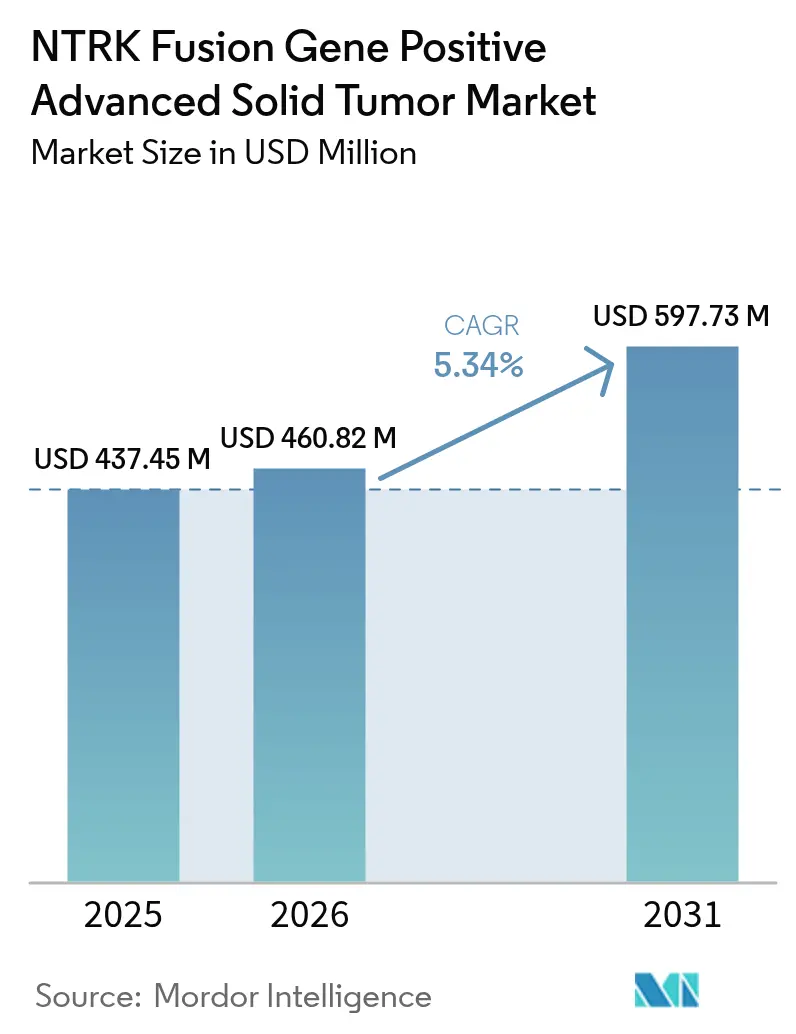
The NTRK fusion gene positive advanced solid tumor market size is expected to grow from USD 437.45 million in 2025 to USD 460.82 million in 2026 and is forecast to reach USD 597.73 million by 2031 at 5.34% CAGR over 2026-2031. Therapeutics command most revenue because payors continue to reimburse targeted drugs that lengthen progression-free survival, while diagnostic innovation broadens testing reach. First-generation TRK inhibitors created a clear regulatory path and now stimulate follow-on investment in next-generation compounds that address resistance in the central nervous system (CNS). Uptake, however, remains constrained by the underlying rarity of NTRK fusions, which occur in fewer than 1% of most solid tumors. Regional growth hinges on reimbursement for next-generation sequencing (NGS) and on government-sponsored genomic screening programs that shorten the time from biopsy to therapy.
Key Report Takeaways
- By product type, therapeutics held 83.96% of the NTRK fusion gene positive advanced solid tumor market share in 2025, while the same segment is advancing at a 15.55% CAGR through 2031.
- By tumor origin, lung cancer led with 40.02% revenue share in 2025; colorectal cancer is projected to expand at a 15.20% CAGR to 2031.
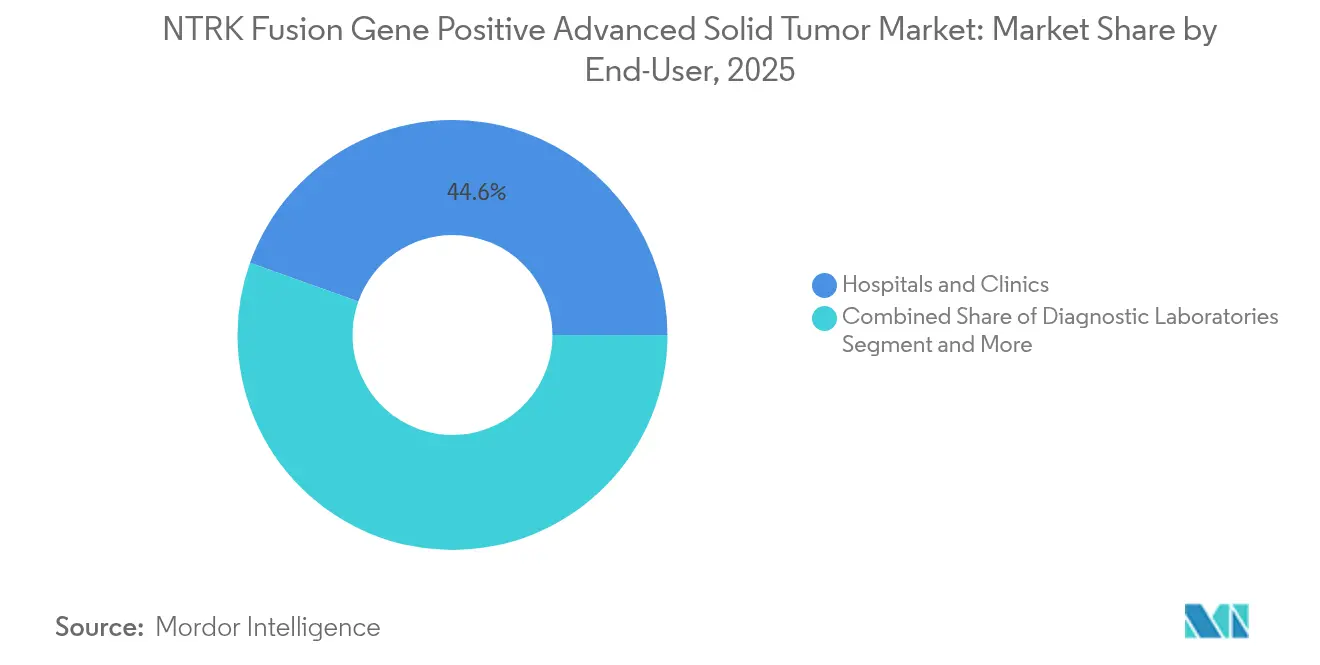
- By end-user, hospitals and clinics accounted for 44.55% share of the NTRK fusion gene positive advanced solid tumor market size in 2025, whereas diagnostic laboratories record the fastest 17.05% CAGR through 2031.
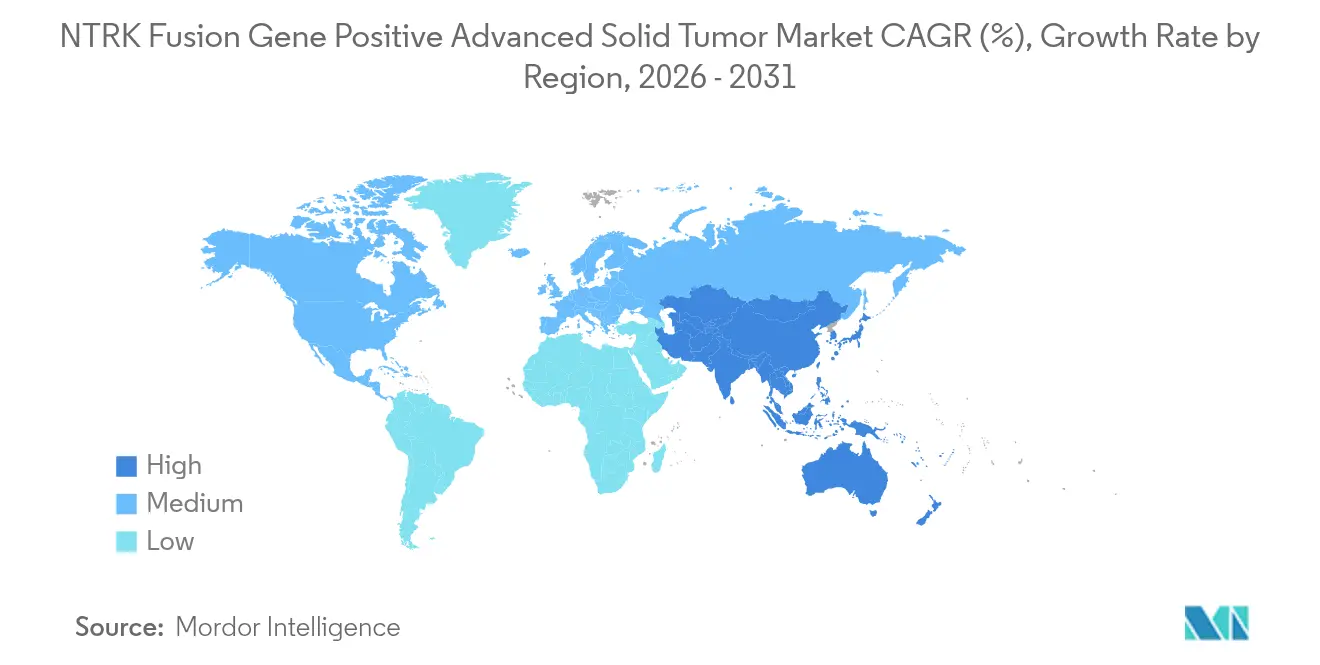
- By geography, North America held 41.90% of revenue in 2025 and Asia-Pacific is forecast to climb at a 15.05% CAGR over the outlook period.
Note: Market size and forecast figures in this report are generated using Mordor Intelligence’s proprietary estimation framework, updated with the latest available data and insights as of 2026.
Market Trends and Insights
Drivers Impact Analysis of NTRK Fusion Gene Positive Advanced Solid Tumor Market*
| Driver | (~) % Impact on CAGR Forecast | Geographic Relevance | Impact Timeline |
|---|---|---|---|
| Surging Global Cancer Incidence & Earlier-Stage Molecular Testing | +1.2% | Global, with accelerated adoption in North America & EU | Medium term (2-4 years) |
| Accelerated FDA/EMA Tissue-Agnostic Approvals For TRK Inhibitors | +0.8% | North America & EU core, regulatory spillover to APAC | Short term (≤ 2 years) |
| Investment Spike In CNS-Penetrant Next-Gen TRK Inhibitors | +0.6% | Global, with early clinical benefits in US & EU | Long term (≥ 4 years) |
| Rapid Adoption Of NGS-Based Comprehensive Genomic Profiling | +1.0% | APAC core, expansion to MEA and Latin America | Medium term (2-4 years) |
| Breakthroughs In Liquid-Biopsy TRK Fusion Assays | +0.4% | North America & EU, gradual APAC adoption | Medium term (2-4 years) |
| Pharma–Diagnostics Codevelopment Rebates In Select Payor Contracts | +0.3% | North America primarily, selective EU markets | Short term (≤ 2 years) |
| Source: Mordor Intelligence | |||
Surging Global Cancer Incidence & Earlier-Stage Molecular Testing
Cancer prevalence is rising, and oncologists are moving molecular profiling to earlier treatment lines, which lifts the identification rate of NTRK fusions across tumor groups. Guidelines now recommend up-front NGS rather than sequential single-gene tests, lengthening the therapeutic window for tissue-agnostic agents. Platforms such as TruSight Oncology Comprehensive allow the simultaneous detection of multiple biomarkers from limited tissue, which cuts diagnostic turnaround and speeds therapy selection[1]Illumina, “TruSight Oncology Comprehensive,” illumina.com. Earlier detection aligns with physician comfort in prescribing TRK inhibitors outside traditional tumor labels, so prescription volumes rise even though fusion rates remain low. Countries with mature reimbursement for broad NGS, notably the US and Germany, show the fastest conversion from positive test to drug initiation. Over the medium term, the driver lifts the NTRK fusion gene positive advanced solid tumor market by an estimated 1.2 percentage points of CAGR.
Accelerated FDA/EMA Tissue-Agnostic Approvals for TRK Inhibitors
Regulators have endorsed the principle that a genomic alteration, not tumor site, can define a drug label. The initial approvals of larotrectinib and entrectinib set the precedent, and more approvals under this pathway shorten clinical development timelines. Pharmaceutical firms now pursue a single basket study across multiple histologies, which lowers trial cost and speeds global launch. The EMA’s synchronised reviews remove regional sequencing barriers, enabling nearly simultaneous access across major markets. Repotrectinib’s 2024 clearance for ROS1-positive NSCLC shows the expanding regulatory appetite for biomarker-centric drugs[2]FDA, “FDA Approves Repotrectinib for ROS1-Positive NSCLC,” fda.gov. The approach raises investor confidence, resulting in more pipelines targeting rare fusions and reinforcing market growth in the near term.
Investment Spike in CNS-Penetrant Next-Gen TRK Inhibitors
First-generation TRK inhibitors penetrate the blood–brain barrier only modestly. Pharmaceutical developers are therefore directing R&D budgets toward molecules such as zurletrectinib and selitrectinib that retain potency in the CNS. These programs aim to extend median progression-free survival for patients with brain metastases, a key clinical gap. Blueprint Medicines, among others, views CNS activity as a point of competitive differentiation, dedicating sizeable portions of its oncology budget to preclinical brain-penetrant chemistry. Evidence of intracranial responses generates momentum for label expansion into primary brain tumors harbouring NTRK fusions. Because CNS involvement grows over the disease course, therapies that prove durable in the brain may command premium pricing and longer treatment duration, adding roughly 0.6 percentage points to CAGR over the long term.
Rapid Adoption of NGS-Based Comprehensive Genomic Profiling
The cost of sequencing fell by 42% between 2021 and 2024, bringing comprehensive panels within the budget of many public systems. Asia-Pacific is at the forefront, with China embedding NGS into standard oncology-drug reimbursement pathways, while Japan rolled out a national screen that identifies actionable fusions pre-treatment. Health ministries favour broad panels because they conserve tissue and reduce the frequency of non-actionable tests. Commercial labs exploit economies of scale to deliver 5-day turnaround in urban centres, a service level that community hospitals could not achieve alone. Artificial intelligence platforms now sort sequencing variants and flag clinically relevant fusions, lowering pathologist workload. Together these trends accelerate testing volumes and add an estimated 1.0 percentage point to market CAGR during the medium term.
Restraints Impact Analysis of NTRK Fusion Gene Positive Advanced Solid Tumor Market*
| Restraint | (~) % Impact on CAGR Forecast | Geographic Relevance | Impact Timeline |
|---|---|---|---|
| High Cost & Patchy Reimbursement For TRK Testing/Therapies | -0.9% | Global, most severe in emerging markets and US commercial payers | Short term (≤ 2 years) |
| Limited Molecular Pathology Capacity In Emerging Markets | -0.7% | APAC emerging, Latin America, MEA | Long term (≥ 4 years) |
| Low Oncologist Awareness Causing Sub-Optimal Clinical Uptake | -0.4% | Global, particularly community oncology settings | Medium term (2-4 years) |
| On-Target Resistance Mutations Shortening Therapy Duration | -0.3% | Global, clinical impact varies by tumor type | Long term (≥ 4 years) |
| Source: Mordor Intelligence | |||
High Cost & Patchy Reimbursement for TRK Testing / Therapies
NGS panels may cost USD 3,000–5,000, an outlay that strains payer budgets when fusion prevalence is low. Private insurers often approve narrower panels, compelling clinicians to order second tests if initial screens miss an NTRK fusion. Patient assistance programs offer temporary relief but do not fix systemic reimbursement gaps. The Large Urology Group Practice Association continues to lobby for universal coverage on the grounds that precise therapy reduces later-line spending[3]LUGPA, “Expanding Coverage of Biomarker Testing in 2025,” lugpa.org. Until reimbursement stabilises, uneven access is likely to subtract 0.9 percentage points from the global CAGR.
Limited Molecular Pathology Capacity in Emerging Markets
Emerging economies face a 46% shortfall in trained pathologists, and the gap is wider in subspecialised molecular roles. Accreditation takes time, and many regional hospitals lack high-throughput sequencers. Centralised laboratories exist in major cities, but courier delays compromise specimen integrity in rural areas. Digital pathology promises remote sign-out, yet regulatory approval for cross-border diagnostics moves slowly. Over the long term, this infrastructure deficit may depress CAGR by 0.7 percentage points, unless governments make targeted capital investments.
*Our forecasts treat driver/restraint impacts as directional, not additive. The impact forecasts reflect baseline growth, mix effects, and variable interactions.
NTRK Fusion Gene Positive Advanced Solid Tumor Market Segment Analysis
By Product Type:
Therapeutics Drive Premium Market ValueTherapeutics captured 83.96% of revenue in 2025, reflecting the willingness of payors to reimburse drugs that improve progression-free survival in biomarker-selected patients. First-generation agents created the initial revenue base, and the pipeline of CNS-penetrant molecules positions the segment for steady share retention. The NTRK fusion gene positive advanced solid tumor market benefited from surge pricing linked to orphan drug status in major markets. Combination strategies that include radioligand or immune-checkpoint blockers promise additional life-cycle options, so the therapeutic segment’s 15.55% CAGR remains credible. Diagnostics, while representing 16.04% of revenue, contribute indirect value because broader testing widens the funnel of treatable patients and thus bolsters drug demand. Integrated companies that sell both a therapy and its companion test are gaining scale efficiencies and can bundle offerings under value-based contracts, reinforcing the premium attached to their therapeutic portfolios.
Diagnostic innovation continues to lower sequencing costs and raise sensitivity, creating a positive feedback loop for therapeutic prescribing. NGS panels dominate current diagnostic revenue because they assess multiple alterations within a single workflow. IHC and FISH remain for confirmation and for sites that cannot finance high-throughput sequencers. Liquid biopsy tests, still early in their adoption curve, show strong potential in monitoring for resistance mutations and may gradually cannibalise repeat tissue biopsies. As evidence of clinical utility accumulates, payors will likely align reimbursement with these less-invasive assays, further supporting diagnostic growth and indirectly raising therapy volumes.




By Tumor Origin:
Lung Cancer Leadership Faces Colorectal ChallengeLung cancer held 40.02% of the NTRK fusion gene positive advanced solid tumor market in 2025 because of the large overall incidence of non-small-cell lung cancer and the routine use of broad NGS panels at diagnosis. Secretory carcinoma and certain inflammatory myofibroblastic lung tumours carry higher fusion rates, so oncologists test aggressively and adopt TRK inhibitors promptly. Colorectal cancer exhibits the fastest 15.20% CAGR thanks to rising institutional compliance with guidelines that call for molecular profiling before first-line therapy. Microsatellite-stable tumours, once considered less amenable to precision therapy, are now screened for fusions.
Thyroid and salivary gland cancers sustain smaller but steady volumes, while paediatric sarcomas represent a niche yet high-value group because fusion rates are comparatively high. Differential testing access remains a barrier in colorectal cancer, with only 28.8% of metastatic cases receiving comprehensive profiling in a 2024 JAMA study. As outreach programmes and bundled test-drug contracts expand, colorectal’s share will continue to climb, challenging lung cancer dominance late in the forecast. The tissue-agnostic drug labels foster momentum across less common tumours, creating a wider mosaic of indications that collectively reinforce revenue diversification.
By End-User:
Hospital Dominance Shifts Toward Laboratory CentralizationHospitals and clinics produced 44.55% of revenue in 2025 because most biopsies and initial treatment decisions occur in these settings. Cancer centres, which include large academic and NCI-designated institutions, accounted for 32.65% and offer integrated tumour boards that interpret complex genomic profiles. Yet the fastest growth resides in diagnostic laboratories, which are scaling at a 17.05% CAGR as health systems centralise high-complexity testing. The NTRK fusion gene positive advanced solid tumor market increasingly relies on these central labs for high-throughput NGS, which reduces per-sample cost and standardises quality.
Laboratory centralisation coincides with advances in digital pathology that allow slides to be scanned locally and reviewed remotely by subspecialists. This workflow is attractive to smaller hospitals that face shortages of molecular pathologists. Commercial lab networks such as Foundation Medicine and NeoGenomics negotiate national payor contracts that bundle sequencing and interpretation, giving community oncologists easier access to actionable reports. The convergence of tissue-based and plasma-based testing options within a single lab further strengthens the laboratory value proposition. As logistics improve, central laboratories could eclipse hospitals as the primary testing venue, although treatment decisions will still occur at the bedside.
Geography Analysis
North America NTRK Fusion Gene Positive Advanced Solid Tumor Market
North America led with a 41.90% share in 2025 on the back of strong reimbursement for NGS, mature clinical trial networks, and the earliest adoption of tissue-agnostic labels. Public payors have clarified coverage for comprehensive panels, but commercial insurers continue to apply variable utilisation management criteria that can delay testing in community settings. Large pharmaceutical investments, including Roche’s USD 50 billion allocation for new manufacturing and diagnostics capacity, expand supply chain resilience in the region.
APAC NTRK Fusion Gene Positive Advanced Solid Tumor Market
Asia-Pacific posts the highest 15.05% CAGR because of parallel momentum in China’s precision medicine blueprint and Japan’s national genomic screening initiatives. Seoul and Taipei have demonstrated viable reimbursement models that bundle testing with therapy, while India’s private oncology chains incorporate broad molecular profiling for self-pay patients. Pathology capacity gaps persist outside tier-one cities, yet regional governments are funding training to close the skills deficit. The rapid rise in lung and colorectal cancer incidence underpins test volume, and payors are now experimenting with risk-sharing deals that lower the budget impact of premium drugs.
Europe NTRK Fusion Gene Positive Advanced Solid Tumor Market
Europe maintains balanced growth as coordinated EMA reviews keep launch timelines close to those in the United States. Germany and the United Kingdom anchor adoption with robust molecular tumour boards, while France links reimbursement to outcome-based evidence. Central and Eastern European states still lag due to budget constraints, yet EU-wide initiatives aim to harmonise test quality and data-sharing frameworks. Digital pathology networks allow cross-border consultation that compensates for local workforce shortages, supporting gradual convergence in testing standards. Overall, the region’s focus on cost-effectiveness exerts down-ward pressure on price but increases volume predictability.

Competitive Landscape
The NTRK fusion gene positive advanced solid tumor market displays moderate concentration, with first-generation pioneers Bayer and Roche holding key drug assets. Larotrectinib and entrectinib remain category benchmarks for clinicians and payors. Blueprint Medicines is advancing next-generation inhibitors that address emergent resistance profiles and achieve higher CNS penetration. Integrated companies leverage companion diagnostics to lock in share; Roche’s cobas platform, for instance, is linked to its therapeutic portfolio, reinforcing user loyalty.
Diagnostic players seek competitive advantage through panel breadth and bioinformatics. Thermo Fisher’s codevelopment deal with Bayer demonstrates the strategic value of an in-house sequencing platform that feeds directly into drug adoption. BostonGene’s collaboration with Takeda on AI-powered profiling signals that data analytics is an emerging differentiator.
Midsize biotechnology firms exploit white space in paediatric and rare solid tumours, seeking regulatory exclusivity for small patient populations. Venture funding gravitates toward platforms that combine liquid biopsy with AI-driven interpretation. Start-ups developing point-of-care fusion detection using microfluidics may lower the barrier to community oncology adoption. Despite diversification, barriers such as manufacturing scale and clinical evidence for companion diagnostics keep entry hurdles high, favouring incumbents with integrated capabilities.
NTRK Fusion Gene Positive Advanced Solid Tumor Industry Leaders
Bayer AG
Empire Genomics, LLC
F. Hoffmann-La Roche Ltd.
NeoGenomics Laboratories, Inc.
OncoDNA S.A.
- *Disclaimer: Major Players sorted in no particular order
NTRK Fusion Gene Positive Advanced Solid Tumor Market Companies Covered in this Report
- Bayer
- Eli Lilly and Company
- Roche
- Bristol-Myers Squibb
- Blueprint Medicines Corp.
- Novartis
- Takeda Pharmaceutical Co.
- Regeneron Pharmaceuticals
- Pfizer
- Guardant Health
- NeoGenomics Laboratories
- Foundation Medicine Inc.
- Thermo Fisher Scientific
- QIAGEN
- Illumina
- Natera
- Caris Life Sciences
- Tempus Labs Inc.
- OncoDNA S.A.
- Empire Genomics LLC
- LGC Clinical Diagnostics (SeraCare)
- Fulgent Genetics Inc.
- Exact Sciences Corp.
Read Analysis of NTRK Fusion Gene Positive Advanced Solid Tumor Companies

Market Opportunities and Future Outlook
A key near-term opportunity is widening access to high-sensitivity NTRK fusion detection in routine oncology workflows, where the underlying rarity of NTRK fusions (often under 1% of most solid tumors) makes false negatives and delayed testing commercially meaningful. Clinical guidance is converging on RNA-based NGS as the preferred primary strategy for fusion detection (with IHC used as a pragmatic screening tool in some settings). This supports diagnostic laboratories and hospital networks scaling standardized, fast-turnaround comprehensive genomic profiling that feeds into tumor-agnostic prescribing.
On the therapy side, the market is shifting from first-generation TRK inhibitors toward differentiated profiles aimed at acquired resistance and CNS disease. That creates room for next-generation, CNS-penetrant compounds and for sequencing strategies after progression. The direction is reinforced by recent tissue-agnostic regulatory actions, including the FDA accelerated approval of repotrectinib for NTRK gene fusion-positive solid tumors (June 2024) and the FDA full approval of larotrectinib (VITRAKVI) for NTRK fusion-positive solid tumors (April 2025). Pipeline activity and data readouts that emphasize intracranial activity (for example, updates presented at AACR 2026 for taletrectinib) keep CNS control in focus as a differentiator, while integrated pharma-diagnostics approaches, including companion diagnostic platform usage, support more systematic patient identification across tumor types.
Recent Industry Developments in NTRK Fusion Gene Positive Advanced Solid Tumor Market
- April 2026: Nuvation Bio reported longer-term follow-up from pivotal studies of taletrectinib at AACR 2026, highlighting durable responses including intracranial activity. The update pointed to a competitive push toward next-generation agents with CNS performance, an important differentiation lever in advanced solid tumors where brain metastases and CNS progression can shorten treatment duration.
- April 2025: The US FDA granted full approval to Bayer’s VITRAKVI (larotrectinib) for adult and pediatric patients with NTRK gene fusion-positive solid tumors, converting the earlier accelerated approval into a standard approval. Full approval strengthens payer and provider confidence in tumor-agnostic TRK inhibition and reinforces the benchmark position of first-generation TRK therapy in this niche population.
- June 2024: The US FDA granted accelerated approval to repotrectinib (AUGTYRO) for adult and pediatric patients (12 years and older) with NTRK gene fusion-positive solid tumors. The decision expanded the treatable population with an additional tumor-agnostic TRK option and raised the importance of broad molecular testing pathways that can reliably identify rare fusions across histologies.


NTRK Fusion Gene Positive Advanced Solid Tumor Market Report Scope and Research Methodology
Market Definition and Coverage
This market is defined as the revenue generated from diagnosing and treating patients with advanced solid tumors that are confirmed to be NTRK fusion gene positive, across major care settings and geographies.
Scope exclusions: We do not count early stage tumors that are not in advanced disease, and we avoid double counting general oncology spend that is not tied to NTRK fusion confirmation.
Segments Covered in This Report
- By Product Type
- Therapeutics
- First-Generation TRK Inhibitors
- Next-Generation TRK Inhibitors
- Diagnostics
- NGS Panels
- Immunohistochemistry (IHC)
- FISH
- RT-PCR
- Others
- Therapeutics
- By Tumor Origin
- Thyroid Cancer
- Salivary Gland Cancer
- Lung Cancer (NSCLC)
- Colorectal Cancer
- Others
- By End-User
- Hospitals & Clinics
- Cancer Centers
- Diagnostic Laboratories
- Others
- Geography
- North America
- United States
- Canada
- Mexico
- Europe
- Germany
- United Kingdom
- France
- Italy
- Spain
- Rest of Europe
- Asia-Pacific
- China
- Japan
- India
- South Korea
- Australia
- Rest of Asia-Pacific
- Middle East and Africa
- GCC
- South Africa
- Rest of Middle East and Africa
- South America
- Brazil
- Argentina
- Rest of South America
- North America
Data Sources, Market Sizing, and Validation
Desk Research
Desk work starts with building the patient and testing funnel for NTRK fusion gene positive cases, since NTRK fusions are rare and the market is sensitive to screening access. We referenced public sources such as World Health Organization cancer statistics, national cancer registries and health ministry dashboards, and FDA and EMA public drug and diagnostic documentation, alongside peer reviewed oncology journals that report NTRK fusion prevalence and testing practices.
To translate that funnel into spend, we also used company filings and investor presentations for therapy and diagnostic product mix cues, along with association websites and reputable press for reimbursement and guideline shifts. In parallel, we used paid subscriptions for company financials and intelligence, patent databases to track pipeline and resistance narratives, and an import export shipment level database when it helped validate diagnostic kit movement in select markets. These desk sources are not exhaustive, and other public references were also used for data collection, validation, and clarification.
Primary Interviews and Surveys
Primary inputs were collected from oncology treating clinicians, pathology and molecular lab stakeholders, and healthcare commercial teams that support precision oncology programs. Discussions were used to confirm the practical testing sequence (for example, NGS panels versus other methods), typical treatment pathways for advanced cases, and how adoption changes by region across APAC, EMEA, and the Americas.
Distribution of primary research fieldwork respondents
| Company type | Respondent position | Region |
|---|---|---|
| Top tier: 34% | CXOs: 13% | APAC: 46% |
| Mid tier: 48% | Functional/Unit leaders: 28% | EMEA: 33% |
| Smaller Players: 18% | Managers: 59% | Americas: 21% |
Market-Sizing & Forecasting
The core sizing is constructed using a top-down demand pool build, where incidence and prevalence signals are converted into an addressable advanced solid tumor cohort, and then filtered through NTRK fusion positivity and the share of patients who actually get tested. Once that eligible pool is built, spend is calculated by applying diagnosis rates and therapy uptake rates, and then converting volume into value using typical per test pricing and per patient treatment cost assumptions.
To keep the numbers realistic, selective bottom-up checks are used, including sampled price by volume logic for NGS panel testing and channel conversations that indicate how much prescribing is concentrated in cancer centers versus broader hospital networks. Key model inputs include NTRK fusion prevalence by tumor origin, the split of testing methods (NGS panels versus other approaches), the proportion of advanced patients getting molecular profiling, expected duration of therapy in advanced disease, and regional reimbursement readiness for genomic testing. For forecasting, scenario analysis is used, since small changes in testing penetration and access programs can move totals, and then the assumptions are aligned with what experts expect for guideline updates, broader screening, and next generation therapy entry.
Data Validation & Update Cycle
Outputs are cross-checked against independent signals such as public treatment guideline shifts, regulatory milestones for TRK targeted therapies and diagnostics, and observed changes in NGS adoption in oncology. When a region shows a sharp step change, the driver is reviewed in detail, and follow up calls are triggered to confirm whether it is a data artifact or a real access change.
Before sign-off, the model and assumptions go through multi step analyst reviews, where variance checks are run across patient counts, testing rates, and implied spend per patient so the totals remain internally consistent. Reports are refreshed annually, and interim updates are done when material events occur, such as a major label expansion, reimbursement change, or a meaningful diagnostic access shift. Right before delivery, a final pass is completed to incorporate the latest public updates so clients receive the most current view.
Mordor Intelligence's Ntrk Fusion Gene Positive Advanced Solid Tumor Market Estimate Compared With Other Published Estimates
Published market values for this niche oncology area can look far apart, even when they use similar disease words, because the tested patient funnel and what gets counted as market revenue is not always treated the same. In practice, differences show up around whether diagnostics are fully included, how advanced disease is defined, and how quickly testing penetration is assumed to rise.
Some published figures bundle a wide set of precision oncology services, which can pull in broader molecular testing and downstream care elements. In Mordor Intelligence, the counting is limited to revenue tied to NTRK fusion confirmation and the related diagnostic and therapeutic categories, and testing and uptake rates are kept anchored to region-specific access and reimbursement checks.
Benchmark comparison
| Source | Market Size | Gaps in Research Methodology |
|---|---|---|
| Mordor Intelligence | USD 460.82 M (2026) | |
| Global Publisher A | USD 497.70 M (2026) | This estimate appears to include a broader set of precision oncology pathway elements around molecular testing and relapse management, which can expand the spend pool beyond NTRK specific confirmed patient revenue. |
| Industry Publisher B | USD 349.00 M (2025) | This figure is anchored to an earlier base year and may apply more conservative testing penetration and therapy uptake assumptions, which tends to reduce the eligible treated pool for a rare biomarker. |
The spread across sources mainly comes from how wide the diagnostic and care pathway scope is, and how quickly testing access is assumed to scale for a rare fusion. By keeping the model tied to a traceable tested patient funnel and clear pricing logic, we get a balanced number that can be explained and reproduced with the same input signals.


Key Questions Answered in the Report
What is driving the growth of the NTRK fusion gene positive advanced solid tumor market?
Surging cancer incidence, earlier molecular testing, and repeated regulatory approvals for tissue-agnostic TRK inhibitors together raise patient identification and drug uptake.
Which segment of the NTRK fusion gene positive advanced solid tumor market is expanding fastest?
Therapeutics are rising at a 15.55% CAGR, supported by next-generation CNS-penetrant inhibitors moving through late-stage pipelines.
Why does Asia-Pacific register the highest regional CAGR?
Government-funded genomic programs in China, Japan, and South Korea boost NGS adoption and create rapid therapy access, resulting in a 15.05% CAGR over 2026-2031.
What remains the biggest barrier to wider adoption of TRK inhibitors?
High sequencing costs and uneven reimbursement for testing and therapy limit access, particularly in emerging markets and among US commercial payers.
How are next-generation TRK inhibitors different from first-generation drugs?
They are engineered for enhanced CNS penetration and activity against known resistance mutations, potentially extending treatment duration and broadening eligible patient populations.
Page last updated on:


 Your data is secure and never sold or shared.


